


Introduction
Pinyon–juniper woodland is a type of dry woodland ecosystem in North America (S Somershoe, personal communication 2024) defined by the presence of one or more species of juniper (Juniperus spp.) and pinyon pine (Pinus spp.; Nielsen Reference Nielsen2009a). Present in 10 US states and covering over 400 000 km2, pinyon–juniper woodland is the most common forest type in the American Southwest, yet it remains one of the least studied in North America (Tausch & Hood Reference Tausch, Hood, Hood and Miller2007, Nielsen Reference Nielsen2009a, Reference Nielsen2009b). There are concerns that long-term historical changes in climate, along with the impacts of Euro-American settlement, are changing pinyon–juniper woodland ecological dynamics, causing movement into former shrub and grasslands, creating unnaturally dense stands and decreasing tree establishment rates (Romme et al. Reference Romme, Allen, Bailey, Baker, Bestelmeyer and Brown2009, RK Shriver et al., unpublished data 2024). It is unclear whether previous research, such as that on palaeoecology, dendroecology, ecophysiology, restoration and the effects of drought, has adequately captured the vast differences in the structure, composition and physical properties that occur across the pinyon–juniper woodland range (Hartsell et al. Reference Hartsell, Copeland, Munson, Butterfield and Bradford2020). Therefore, widespread treatments might be ineffective in terms of efforts to create a diverse, healthy, productive and sustainable ecosystem, and sites must be evaluated individually, with decisions made based on scientific information about the woodlands, which is often not available (Kaufmann et al. Reference Kaufmann, Graham, Boyce, Moir, Perry and Reynolds1994, Gottfried et al. Reference Gottfried, Swetnam, Allen, Betancourt, Chung-MacCoubrey, Finch and Tainter1995, Romme et al. Reference Romme, Allen, Bailey, Baker, Bestelmeyer and Brown2009).
In the Great Basin and Colorado plateau, pinyon–juniper woodlands cover over 181 000 km2 (Miller et al. Reference Miller, Chambers, Evers, Williams, Snyder, Roundy and Pierson2019) and provide a valuable array of resources including firewood, pine nuts, livestock grazing, recreation and Indigenous peoples’ ceremonial plant materials (Hartsell et al. Reference Hartsell, Copeland, Munson, Butterfield and Bradford2020). The two most prominent species of pinyon pine in the pinyon–juniper woodlands are single-leaf pinyon (Pinus monophylla), which are red-brown and grow up to 14 m tall at elevations from 1000 to 2300 m on dry low-montane or foothills in the Great Basin and Mohave Desert borderlands, and the Colorado pinyon (Pinus edulis), which looks similar, is abundant in Colorado, New Mexico, Arizona and eastern Utah and grows up to 21 m tall on dry mountain slopes, mesas and plateaus at elevations from 1500 to 2100 m (Lanner Reference Lanner1981, Kral Reference Kral1993).
Many plants and animal species utilize pinyon–juniper communities, including the pinyon jay (Gymnorhinus cyanocephalus), a medium-sized bird in the family Corvidae, named for its mutualism with pinyon pines (Balda & Marzluff Reference Balda and Marzluff1992, Hartsell et al. Reference Hartsell, Copeland, Munson, Butterfield and Bradford2020). With superb spatial memory (Stafford et al. Reference Stafford, Balda and Kamil2006) and expandable throat pouches that fit 40–50 seeds (Johnson & Balda Reference Johnson, Balda, Billerman, Keeney, Rodewald and Schulenberg2020), the pinyon jay serves as the primary long-distance disperser of pinyon pine seeds (Lanner Reference Lanner1981, Balda & Marzluff Reference Balda and Marzluff1992, Somershoe et al. Reference Somershoe, Ammon, Boone, Johnson, Darr, Witt and Duvuvuei2020). The bird’s population is currently estimated at 770 000 (Somershoe et al. Reference Somershoe, Ammon, Boone, Johnson, Darr, Witt and Duvuvuei2020), but numbers have decreased by c. 2.2% compounded per year from 1966 to 2022 (BBS 2022), an overall population loss of c. 71%, making it the fastest-declining pinyon–juniper bird species (Johnson & Sadoti Reference Johnson and Sadoti2023). The pinyon jay has been listed as ‘Vulnerable’ (BirdLife International 2020) and was recently petitioned to be listed as endangered or threatened under the US Endangered Species Act (ESA) by Defenders of Wildlife (Estrella Reference Estrella2022).
The causes of these declines in populations are poorly understood (Somershoe et al. Reference Somershoe, Ammon, Boone, Johnson, Darr, Witt and Duvuvuei2020) despite extensive knowledge of the species’ breeding habits, social behaviour and spatial memory (Johnson & Balda Reference Johnson, Balda, Billerman, Keeney, Rodewald and Schulenberg2020). Multiple causes of these declines have been hypothesized, including the past 70 years of pinyon–juniper land management (Johnson & Sadoti Reference Johnson and Sadoti2023), as well as the loss of the habitat due to climate change (Johnson & Balda Reference Johnson, Balda, Billerman, Keeney, Rodewald and Schulenberg2020, Somershoe et al. Reference Somershoe, Ammon, Boone, Johnson, Darr, Witt and Duvuvuei2020, Estrella Reference Estrella2022), around which most of the concern for the pinyon jay population revolves (Van Riper et al. Reference Van Riper, Hatten, Giermakowski, Mattson, Homes and Johnson2014, Johnson & Balda Reference Johnson, Balda, Billerman, Keeney, Rodewald and Schulenberg2020). Droughts and recent high temperatures have been associated with a decrease in pinyon pine cone production (Forcella Reference Forcella1981, Redmond et al. Reference Redmond, Forcella and Barger2012, Parmenter et al. Reference Parmenter, Zlotin, Moore and Myers2018, Wion et al. Reference Wion, Weisberg, Pearse and Redmond2020), and climate-related impacts have also had a broader effect on pinyon–juniper woodlands (Breshears et al. Reference Breshears, Cobb, Rich, Price, Allen and Balice2005, Reference Breshears, Myers, Meyer, Barnes, Zou and Allen2009, Clifford et al. Reference Clifford, Royer, Cobb, Breshears and Ford2013, Meddens et al. Reference Meddens, Hicke, Macalady, Buotte, Cowles and Allen2015, Shriver et al. Reference Shriver, Yackulic, Bell, Bradford and Hampe2022), with predictions of increased mortality across the American south-west (Williams et al. Reference Williams, Allen, Millar, Swetnam, Michaelsen, Still and Leavitt2010, McDowell et al. Reference McDowell, Williams, Xu, Pockman, Dickman and Sevanto2016), decreased growth rates (Williams et al. Reference Williams, Allen, Millar, Swetnam, Michaelsen, Still and Leavitt2010) and changes to distribution patterns (Cole et al. Reference Cole, Ironside, Arundel, Duffy and Shaw2008b). Some tree species in the pinyon–juniper woodlands will become increasingly vulnerable under future climate conditions, and tree populations are expected to decline due to changes in both recruitment and mortality rate, as well as other factors such as insect or other plant infestations (Noel et al. Reference Noel, Shriver, Crausbay and Bradford2023).
Specific research is needed on the effects of pinyon–juniper woodland management, as well as on pinyon pine biology and woodland dynamics (Somershoe et al. Reference Somershoe, Ammon, Boone, Johnson, Darr, Witt and Duvuvuei2020). In addition to increasing knowledge of pinyon pine ecology and management, a more accurate depiction of the distribution of pinyon pine would support further research into the potential threats facing the ESA-petitioned pinyon jay, as the lack of an accurate habitat model is a constraint to the species’ conservation. While pinyon jays are of the highest conservation priority, many other animal species are also reliant upon pinyon–juniper woodlands (Evans Reference Evans1988), and the benefits of research into pinyon–juniper ecology and distribution might be extendable to these other species associated with this habitat.
Currently, the best and most complete vegetation classification data covering the USA are those of Landfire (Landscape Fire and Resource Management Planning Tools), a shared wildland fire management programme between the US Department of Agriculture Forest Service and the US Department of the Interior. However, Landfire is not specifically designed for or tuned to our study area, and there are instances in its Existing Vegetation Type (EVT) data that contain classifications for pinyon–juniper and juniper-only woodlands that are not ecologically accurate (NatureServe 2017, Landfire 2022). As an example, the pure juniper in the South Hills of southern Idaho, where there is no known instance of pinyon pine, is listed as pinyon–juniper woodland in Landfire. An opportunity exists, therefore, to build upon Landfire’s classification power and improve its resolution and accuracy for locations of pinyon pine in pinyon–juniper woodlands.
We aimed to use a machine learning technique with geographical, ecological and climate variables to create a probability distribution of pinyon pine throughout the northern Great Basin, USA. We used this smaller region of single-leaf and Colorado pinyon pines’ full range, as the model will be more accurate when focused on an area that shares some biophysical similarities, and using a broader model might risk losing some specificity and accuracy. In addition, this region approximately represents the scope of the Intermountain Bird Observatory’s work and where we have ecological knowledge of and relationships with forest services and other field experts. This prediction will provide future research efforts with a tool to pinpoint the areas of highest likelihood for pinyon pine in the broader pinyon–juniper landscape and could potentially benefit pinyon jays by supporting habitat modelling, improving pre-survey planning and refining upcoming occurrence models (S Somershoe, personal communication 2024). Understanding pinyon pine distribution will increase the knowledge surrounding pinyon–juniper woodlands and the threats they face, and it will ideally reduce the need for ground truthing (S Somershoe, personal communication 2024) and lead to the more rapid implementation of management and conservation actions.
Methods
Study area
Our study area was 365 300 km2 of the northern Great Basin, including the north-western and north-eastern areas of Utah and Nevada, respectively, south and central Idaho and eastern Oregon (Fig. 1).

Figure 1. Pinyon pine study area within four western states of the USA with presence and pseudo-absence points and major cities. Extent (–119.00, 40.00 : –111.00, 45.00).
Acquisition of spatial data
We downloaded data from the Landsat 8 satellite data archive for Surface Reflection (SR) bands 2–7 (blue, green, red, near-infrared, short-wave infrared 1 and short-wave infrared 2) from the United States Geological Survey (USGS) LandsatLook tool (https://landsatlook.usgs.gov/explore). The images for each of the bands were captured between 1 June and 30 September 2022 and with less than 5% cloud cover. We acquired a digital elevation model (DEM) for our study area using The National Map (TNM) tool of the USGS at 1 arcsecond for 2022 (https://apps.nationalmap.gov/downloader/). We obtained EVT classification data from the Landfire programme 2020 version with 30 m × 30 m resolution (https://landfire.gov/evt.php). We downloaded 11 climate variables from the set of 30-year (1991–2020) Normals (precipitation, mean temperature, maximum temperature, minimum temperature, mean dew point temperature, maximum vapour pressure deficit, minimum vapour pressure deficit, solar radiation (horizontal, sloped and clear sky) and cloud transmittance) from the Parameter-elevation Regressions on Independent Slopes Model (PRISM) Climate Group (https://prism.oregonstate.edu/normals/). We also downloaded long term (2081–2100) CMIP6 future climate projection data for mean, maximum and minimum temperatures from WorldClim (https://www.worldclim.org/data/cmip6/cmip6_clim30s.html) for the Shared Socio-Economic Pathway (SSP) 5-8.5 climate scenario.
We loaded these datasets as raster layers using QGIS 3.30.2 (QGIS Development Team 2023), re-projected to the EPSG-4269 coordinate referencing system using the NAD83 datum and cropped to the extent of the study area. All numeric datasets (e.g., climate data) were re-projected and aligned with the DEM using bilinear interpolation, whereas all categorical datasets (e.g., Landfire EVTs) were re-projected and aligned using a nearest neighbour approach.
We evaluated 22 predictor variables in our modelling that we hypothesized might influence pinyon pine presence (Table 1). We included the elevation and terrain variables (elevation, slope, terrain position index (TPI) and roughness), as single-leaf and Colorado pinyon pines are both found on varying slopes (Meeuwig Reference Meeuwig1979), topographical positions (Miller et al. Reference Miller, Meeuwig and Budy1981), mountainous terrain (Rust Reference Rust1999) and in the elevation range of 1000–3000 m (Meeuwig Reference Meeuwig1979, Miller et al. Reference Miller, Meeuwig and Budy1981, Burns & Honkala Reference Burns and Honkala1990, West et al. Reference West, Tausch and Tueller1998). We included the climate variables as pinyon pines are known to favour arid and semi-arid environments (Montes et al. Reference Montes, Peláez, Willyard, Moreno-Letelier, Piñero and Gernandt2019) and the current distributions of single-leaf and Colorado pinyon pines are limited by climate variables (Cole et al. Reference Cole, Fisher, Arundel, Cannella and Swift2008a). Although the Landfire EVT dataset is not sufficient to classify pinyon pine based on the granularity of our research, we included it because it distinguishes pinyon–juniper woodland from other forest types. Finally, we included surface reflectance bands because pinyon pine has a slightly different colour from other trees and the juniper that it often grows with.
Table 1. Predictor variables, type, units, range, mean, standard deviation (SD) and definition used in modelling of pinyon pine presence within the northern Great Basin, USA.

NA = not applicable.
Acquisition of field data
Field experts from the US Forest Service and the City of Rocks National Preserve located in south-central Idaho provided a dataset of pinyon pine presence and pseudo-absence points. The presence points were known instances of pinyon pines being observed and recorded, while the pseudo-absence points consisted of both verified locations as well as randomly generated locations. The randomly generated locations were selected from areas where the experts had spent many years conducting field research and not once seen an instance of pinyon pine, so we have an extremely high level of confidence in them and consider them much closer to true absences. The dataset contained 144 presence points and 621 pseudo-absence points. During analysis, we included all presence points and randomly selected 288 of the 621 pseudo-absence points for use to maintain a ratio of 1:2 to reduce modelling bias (Evans et al. Reference Evans, Murphy, Holden, Cushman, Drew, Wiersma and Huettmann2011).
Random forest modelling
We modelled pinyon pine presence using random forest classification modelling with the package ‘randomForest’ (Breiman Reference Breiman2001) in R version 4.3.0 (R Core Team 2023). In randomForest, many independent but identically distributed decision trees first cast a vote for a class, and then the most popular class becomes the model’s prediction (Breiman Reference Breiman2001, Yiu Reference Yiu2019). Ten parallel models were run, so predictions were made on 2880 pseudo-absence and 1440 presence points.
To identify which geographical, ecological and climate variables were predictive of pinyon pine presence, we combined satellite imagery and field data into a single dataset (Table 1). We found that all of the predictor variables were important to the model using the variable selection algorithm in the R package ‘rfUtilities’ (Murphy et al. Reference Murphy, Evans and Storfer2010, Evans et al. Reference Evans, Murphy, Holden, Cushman, Drew, Wiersma and Huettmann2011, Behl & Benkman Reference Behl and Benkman2018), and therefore we included all of them in the final model.
We mapped predicted probability of habitat suitability for pinyon pine across our study area for both current and future climate conditions by replacing three variables in our model (mean, maximum and minimum annual temperature) with their future estimates. The future projection made critical assumptions – such as no change to current land cover or other variables due to climate change – that we understand are unlikely but are necessary to create a conservative estimate of the potential effect of a changing climate on pinyon pine habitat suitability. We arbitrarily selected 0.66 as a benchmark and compared overall area of the current prediction to the future climate projection prediction and to the area Landfire has classified as pinyon–juniper woodland.
Measures of model performance
We computed a confusion matrix (with true and false positives, negatives and overall accuracy) to evaluate the performance of the random forest model. Overall accuracy was calculated by dividing the sum of correctly classified locations by the total number of locations. It is important to note that this is a theoretical measure and does not represent ecological accuracy. We also plotted the receiver operating characteristic (ROC) curve to calculate the value of the area under the curve (AUC). The ROC curve illustrates the ratio, at any given point, between the model’s true- and false-positive rates (Florkowski Reference Florkowski2008, Hajian-Talaki Reference Hajian-Talaki2013). AUC values of 0.5 suggest no ability to discriminate between positives and negatives, values of 0.7–0.8 indicate acceptable levels of discrimination, values of 0.8–0.9 are considered excellent and values above 0.9 are considered outstanding (Mandrekar Reference Mandrekar2010).
We calcuated the model’s true skill statistic (TSS), which compares the number of correct predictions minus those attributable to random guessing, and Cohen’s kappa coefficient, which also corrects the overall accuracy of the model using the accuracy expected by chance (Allouche et al. Reference Allouche, Tsoar and Kadmon2006). Both statistics range from –1 to +1, with +1 indicating perfect agreement and values less than or equal to 0 indicating random performance at best (Cohen Reference Cohen1960, Allouche et al. Reference Allouche, Tsoar and Kadmon2006).
Results
Using geographical, ecological and climate data, the random forest algorithm showed great potential for predicting the distribution of pinyon pine throughout the northern Great Basin, USA. The variables ranked highest in importance, as explained by mean decrease in accuracy (MDA; Han et al. Reference Han, Guo and Yu2016), included the four solar radiation variables, climate variables and elevation (Fig. 2). The solar transmittance (SolTrans) and radiation (SolSlope and SolTotal) variables all indicate increased likelihood of presence with higher values (Fig. 3). Lower values of precipitation showed higher likelihood for habitat suitability for pinyon pine. Probability was highest for elevations of 1500–2500 m, peaking at c. 2000 m. Maximum likelihood occurred at an average mean dewpoint temperature of c. –5°C (Fig. 3).

Figure 2. The relative importance of the 10 most important variables used in predicting pinyon pine presence within the northern Great Basin, USA, as measured by random forest classifiers using the mean decrease in accuracy. (See Table 1 for variable definitions.)

Figure 3. Marginal effects plots for the six most important variables used in predicting pinyon pine presence within the northern Great Basin, USA. (See Table 1 for variable definitions.)
We generated a study-wide prediction for the probability of habitat suitability for pinyon pine occurrence, with the highest-probability areas including the mountain ranges of northern Nevada and north-western Utah (Fig. 4). When selecting only predictions greater than or equal to 0.66 (an arbitrary choice), 21 006.6 km2 of the study area indicated habitat suitability, but only 4169.79 km2 of that was classified as pinyon–juniper woodland by the Landfire EVT data. In addition, of the 8548.35 km2 of Landfire-classified pinyon–juniper woodlands, 3406.13 km2 were not shared by the predictions. That is not to say that Landfire has misclassified nearly 3500 km2, nor that it has missed over 16 800 km2 of pinyon–juniper woodland. Rather, those areas are locations that have been classified as pinyon–juniper woodland in Landfire but have low probability for habitat suitability and as those that Landfire has not classified as pinyon–juniper woodland but have high probability for habitat suitability.

Figure 4. Map of the predicted probability of presence of pinyon pine within the northern Great Basin, USA.
Upon replacing just three climate variables in the model (maximum, minimum and mean annual temperature) with future projections of those variables under an SSP5-8.5 climate model dataset, we found that the area of habitat with high probability of suitability for pinyon pine was projected to significantly decrease. The overall area of predictions greater than or equal to 0.66 (again an arbitrary selection) decreased from 21 006.6 to 10 438.44 km2, not shifting greatly in geographical range, but shrinking by 50.31% in the current areas of highest prediction in the hills of northern Nevada and north-western Utah.
Model performance
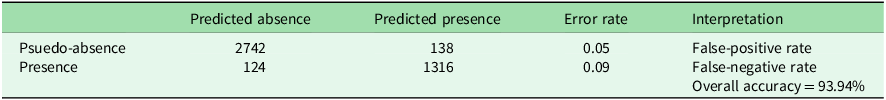
The average overall accuracy of the random forest model was 93.94%, with a false-positive rate of 0.05 and a false-negative rate of 0.09 (Table 2). The prediction counts (2880 for pseudo-absence and 1440 for presence) were 10 times the sample size (288 pseudo-absence and 144 presence) as we ran 10 parallel models. The AUC value was 0.96, classifying our model as outstanding, and the TSS and Cohen’s kappa coefficient were 0.87 and 0.88, respectively.
Table 2. Confusion matrix generated from random forest model predicting presence of pinyon pine within the northern Great Basin, USA.
Discussion
Our objective in this work was to create a probability distribution of pinyon pine throughout the northern Great Basin, USA, by using a machine learning technique with geographical, ecological and climate variables. With these results showing a model with high accuracy and strong classification capability, we were very successful in achieving that objective. This prediction map will assist further research efforts in pinpointing probable areas of pinyon pine in the broader pinyon–juniper woodlands, help increase our knowledge of pinyon–juniper woodlands and could prove useful for future pinyon jay research.
The model was trained on the realized niche of pinyon pine, not the fundamental niche, so the results could be stemming from direct environmental conditions, unquantified biological interactions or some combination of both. The top variables from the model were all climate variables, specifically solar radiation, which indicates a narrow climate envelope, but could be the result of pinyon pine being outcompeted by other species in higher-elevation, more moist environments and being unable to successfully maintain populations in more arid environments, for example, and there may have been other important variables that we did not include in our model. Another study found that certain soil compositions and other climate variables (e.g., mean temperatures of the wettest and coldest quarters and precipitation of the driest month) were among the most important variables when predicting habitat suitability for both single-leaf and Colorado pinyon pines across their entire range under climate change (Buck & Flores-Rentería Reference Buck and Flores-Rentería2022).
For the top three variables in our model (SolTrans, SolTotal and SolSlope), as well as the precipitation variable (Precip), the increasing presence likelihood with increasing solar radiation and decreasing precipitation aligns with pinyon pine being a desert pine species that prefers arid environments (Lanner Reference Lanner1981, Kral Reference Kral1993, Montes et al. Reference Montes, Peláez, Willyard, Moreno-Letelier, Piñero and Gernandt2019). The elevation (Elev) variable was also important, indicating higher likelihood in the known elevation range (1000–2300 m) of pinyon pine (Lanner Reference Lanner1981, Kral Reference Kral1993), but it is not surprising that it has less importance than others, as the same conditions appear at different elevations as latitude changes. We did expect the EVT variable (Landfire) to rank higher, as it is known to be suitable for distinguishing between types of woodlands, but there may be some confounding issues (e.g., large areas of known juniper classified as pinyon–juniper woodland). Altogether, however, the results of our model indicate higher probabilities of habitat suitability in areas with lower levels of precipitation and higher levels of solar radiation, which is to be expected in pinyon pine.
Models created with few presence points for large study areas run the risk of being biased and therefore not capturing all of the relevant information necessary to accurately predict across a wide range of conditions for the target species (Stockwell & Peterson Reference Stockwell and Peterson2002, McPherson et al. Reference McPherson, Jetz and Rogers2004, Hernandez et al. Reference Hernandez, Graham, Master and Albert2006). However, the random forest method has been shown to have the best performance when compared to other common machine learning algorithms, a better fit to testing data and to provide better species’ range maps than other commonly used methods, and it has been known to perform extremely well in terms of ecological predictions, making it suitable for applications to conservation, especially when working with an under-sampled study area (Mi et al. Reference Mi, Huettmann, Guo, Han and Wen2017). Increased study efforts focused on pinyon pine and pinyon–juniper woodlands will naturally increase the number of presence points available, which can then be used to refine the working model.
Although external cross-validation is often performed to supplement the metrics of a random forest model, we used only the built-in performance evaluation. The high accuracy of the random forest model does not necessarily translate to similarly accurate ecological predictions, but it is an indication of a model that might prove helpful. It is therefore important to consider the consequences of false positives (travelling to a location where there is no pinyon pine) and false negatives (refraining from travelling to a location that does have pinyon pine). The latter has a worse effect, as the goal of further research is to find and study the largest amount of pinyon pine and pinyon–juniper woodland possible. These errors could also have downstream effects on analyses using these (or similar) data to study species that utilize pinyon–juniper woodlands, as false positives can overestimate available resources and false negatives can underestimate them. However, since the model performance was excellent and both the false-positive and false-negative rates were low, we expect these incorrect predictions to be manageable at the study area level, and we suggest that this model would greatly reduce the time needed for ground truthing of study sites in this region.
We believe this modelling effort can also augment data collection relevant to the proposed listing of the pinyon jay as threatened or endangered under the ESA, encouraging the prioritization of management actions. It could help refine modelling and provide remote assessment of jay locations and of where they spend the majority of their time and potential food resources, and it could also result in less ground work being required to quantify habitat uses (S Somershoe, personal communication 2024). If the pinyon jay is listed as threatened or endangered under the ESA, the results of the random forest model could have an unexpected but beneficial secondary use, informing which areas would probably have the environmental suitability to sustain pinyon pines into the future, which might lead to the planting of new trees. By projecting our model results into the future (SSP5-8.5 for 2081–2100), we saw a 50.31% decrease in the current areas of highest prediction. These results could be beneficial in selecting sites for planting, as environmental factors are likely to be very different in the future from those that exist now, and current locations of highest habitat suitability are not likely to remain the same.
Our modelling area – the northern Great Basin – is vast, and pinyon–juniper woodlands are extremely complex, with nearly every site being different (S Somershoe, personal communication 2024). Anything that can be done to reduce the time, energy and cost of study efforts could have a major impact on the timeliness and effectiveness of such efforts. Refining Landfire’s EVT data would be helpful, and by comparing current classifications with our predictions for habitat suitability, areas that could potentially be misclassified as pinyon–juniper woodlands or omitted as such can be highlighted. The pure juniper in the South Hills of southern Idaho, for example (which have no known instances of pinyon pine), has low probability for habitat suitability in our model but has been classified as pinyon–juniper woodland rather than simply juniper. Considering the entire study area, there were 3406.13 km2 of pinyon–juniper woodland classifications that had low probability in our predictions and 16 826.4 km2 of high probability for habitat suitability that were not classified as pinyon–juniper woodland. The very strong results for our model indicate its ability to assist in correcting potential misclassifications and adding large amounts of pinyon–juniper woodland that have not yet been classified as such.
Acknowledgements
We would like to acknowledge the Boise State University department of mathematics, specifically Dr Kyungduk Ko, for providing the academic framework to pursue this research question and for the advice. Special thanks go to Wallace Keck (City of Rocks National Reserve superintendent) and Christopher Witt (US Forest Service ecologist) for providing highly accurate pseudo-absence and ground-truthed presence points for pinyon pine.
Financial support
This research did not receive any specific grant from funding agencies in the public, commercial or not-for-profit sectors.
Competing interests
The authors declare none.
Ethical standards
Due to the nature of the study, ethical permission was not required.


 Open access