


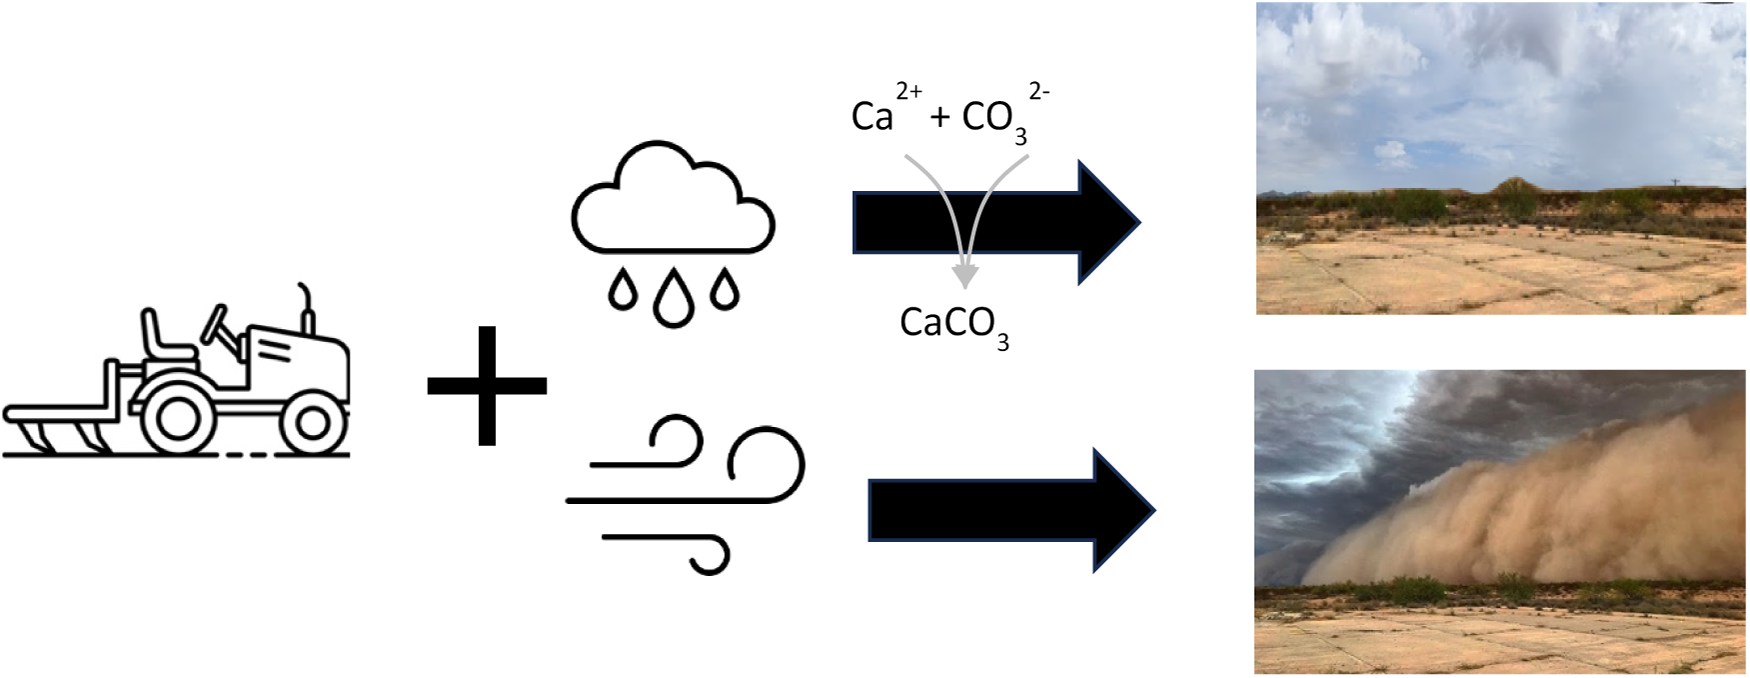
Impact Statement
Fugitive dust and dust storms are naturally occurring phenomena in arid and semi-arid environments (Ginoux et al., Reference Ginoux, Prospero, Gill, Hsu and Zhao2012). Airborne dust has a direct impact on human populations, leading to sometimes fatal traffic accidents (Joshi, Reference Joshi2021; Henry et al., Reference Henry, Mozer, Rogich, Farrell, Sachs, Selzer, Chikani, Bradley and Comp2023), a variety of respiratory illnesses (Vergadi et al., Reference Vergadi, Rouva, Angeli and Galanakis2022), and can serve as a vector for plant and animal pathogens (Finn et al., Reference Finn, Maldonado, de Martini, Yu, Penton, Fontenele, Schmidlin, Kraberger, Varsani, Gile, Barker, Kollath, Muenich, Herckes, Fraser and Garcia-Pichel2021). Human activities like vehicular traffic and plowing can increase dust generation and air particulate loads. Given the size of some dust storms, as large as 160 km in width and 2.4 km in height (Ramakrishnan et al., Reference Ramakrishnan, Lueders, Dun and Friedrich2001), efforts to control them may seem futile. While soil stabilization technologies that prevent dust formation are available, their implementation at a large scale is cost-prohibitive (Heredia-Velásquez et al., Reference Heredia-Velásquez, Giraldo-Silva, Nelson, Bethany, Kut, González-de-Salceda and Garcia-Pichel2023). Identification of soil stabilization target areas, where intervention would have a high impact, would be very desirable. Our research suggests that carbonate content in dryland agricultural soils is a good predictor of how likely a soil is to become a significant fugitive dust source, and prioritizing the stabilization of soils low in carbonate, or strategically enhancing carbonate precipitation in them, could make interventions more effective.
Introduction
Global drylands are commonly characterized by elevated levels of airborne dust that cause a variety of environmental hazards (Middleton, Reference Middleton2017). Dust production can be prevented or diminished by a variety of natural conditions. Vegetation provides a wind break and stabilizes surface soils against wind erosion (Tibke, Reference Tibke1988; Vos et al., Reference Vos, Karst, Eckardt, Fister and Kuhn2022). The soil surface itself may be inhabited by biological soil crusts that produce sticky, interwoven cellular material binding particles together (Belnap and Gillette, Reference Belnap and Gillette1997). Dryland soils may also form a variety of naturally occurring abiotic physical–chemical crusts that provide resistance against wind erosion (Williams et al., Reference Williams, Pagliai and Stoops2018).
The mechanisms of abiotic soil crusting have been widely studied. Abiotic crust formation is complex, but in general, crusts develop when fine particles become dispersed in water during rain events, migrate to the soil surface, and infill surficial pores forming a surface seal (Assouline, Reference Assouline2004). Plate-like clays can also align and stack horizontally (Awadhwal and Thierstein, Reference Awadhwal and Thierstein1985; Williams et al., Reference Williams, Pagliai and Stoops2018). Clay dispersion is enhanced by Na+ dissolution in low ionic strength rainwater (Forster and Goldberg, Reference Forster and Goldberg1990). As crust terminology can vary, we use the definitions in (Laker and Nortjé, Reference Laker and Nortjé2019) and the term “crust formation” to identify that our treatments resulted in a change in crust strength. Crusts formed by clay dispersion are termed depositional. Structural seals, which form under raindrop-induced dispersion, can be amplified when raindrop momentum is sufficient to break apart soil aggregates, increasing dispersion (Laker and Nortjé, Reference Laker and Nortjé2019). While clay minerals (e.g. montmorillonite, kaolinite, and illite) vary in their crust-forming potential due to their differing dispersal behaviors (Forster and Goldberg, Reference Forster and Goldberg1990), it is difficult to generalize the role of specific mineralogy on crust formation because constituent minerals differ markedly in their response to salts, pH, and organic matter (OM). Ca2+ (and other polyvalent cations, e.g. Mg2+) generally stabilize the soil by increasing flocculation and aggregate formation (Singer and Warrington, Reference Singer, Warrington, Summer and Stewart1992). Calcium (and magnesium) carbonate precipitation may also contribute to crusting through soil cementation (Williams et al., Reference Williams, Pagliai and Stoops2018). Carbonates are often a mineral component of soils, particularly in arid and semi-arid environments, and can also act as binding agents increasing crust strength (Gillette et al., Reference Gillette, Adams, Muhs and Kihl1982). At extremely high carbonate contents, desert soils can form a true pavement (Bungartz et al., Reference Bungartz, Garvie and Nash2004). Interventional microbial or enzyme-induced carbonate precipitation (MICP or EICP) for dust control (Hamdan and Kavazanjian, Reference Hamdan and Kavazanjian2016) is also based on carbonate cementation. A correlation between abiotic crusting potential has also been reported with potassium and pH (Stovall et al., Reference Stovall, Ganguli, Schallner, Faist, Yu and Pietrasiak2022).
The presence of an abiotic crust increases the minimal wind velocities required to entrain soil particles in wind flow (Vos et al., Reference Vos, Fister, Eckardt, Palmer and Kuhn2020) as well as their resistance to abrasion by saltating dust particles (Rice et al., Reference Rice, Willetts and McEwan1996). However, abiotic soil crusts can be disrupted by physical disturbance as is common in agricultural activity (Finn et al., Reference Finn, Maldonado, de Martini, Yu, Penton, Fontenele, Schmidlin, Kraberger, Varsani, Gile, Barker, Kollath, Muenich, Herckes, Fraser and Garcia-Pichel2021). Due to the large aerial footprint and ongoing disturbance, agricultural fields can be significant dust sources at the landscape scale (Ginoux et al., Reference Ginoux, Prospero, Gill, Hsu and Zhao2012; Li et al., Reference Li, Kandakji, Lee, Tatarko, Blackwell, Gill and Collins2018; Joshi, Reference Joshi2021). Actively cultivated fields have temporarily high dust potential during “fallow” periods between crops (Zucca et al., Reference Zucca, Fleiner, Bonaiuti and Kang2022). A persistent and growing issue in drylands is water scarcity, which extends fallow periods when soil moisture is not replenished through irrigation (Huang et al., Reference Huang, Li, Fu, Chen, Fu, Dai, Shinoda, Ma, Guo, Li, Zhang, Liu, Yu, He, Xie, Guan, Ji, Lin, Wang, Yan and Wang2017). Despite being fallow, dryland fields may continue to be plowed to remove weedy vegetation, for pest control, and in some cases to break up hard soil pans in preparation for future cultivation, a practice known as “preparatory tillage” (Piemeisel et al., Reference Piemeisel, Lawson and Carsner1951; Oswal, Reference Oswal1994). While these practices serve useful purposes, they may render otherwise naturally stable soils into continuous and significant dust sources. Thus, fallow dryland agricultural fields act as increasingly significant sources of atmospheric dust.
We posit that a better mechanistic understanding of crust formation in drylands can be instrumental in predicting the dust-forming potential of soils. Current models, based primarily on fine particle redistribution, are mechanistically accurate but don’t predict wind erosion potential. We investigated which, if any, soil compositional factors correlate to soil crust strength. Further, we hypothesized that a soil’s carbonate content was most likely to predict abiotic crust formation potential and crust strength. The role of carbonate is independent of mineralogy and raindrop momentum as it relies solely on dissolution (on wetting) and reprecipitation (on drying) at the soil-atmosphere interface (surface cementation). To test our hypothesis, we conducted a study of diverse fallow agricultural soils from Pinal County, Arizona with varying carbonate contents. We generated surface crusts using wetting and drying cycles, with and without raindrop momentum, and measured crust strength. Then we determined which compositional factors were best correlated with the soil’s physical crust strength. Our findings shed light on the mechanisms of crust formation contributing to better predicting which soils are likely dust sources. This, in turn, may help develop land management guidelines that promote superficial abiotic crusting during fallow periods (enough to limit wind erosion) while still meeting the plowman’s needs.
Methods
Sample locations, sampling, and sample preparation
Composited soil samples (filling a 5-gallon bucket) were collected from 26 fallow agricultural fields with a variety of soil types in Pinal County, Arizona. Sample locations are shown in Figure 1. Soil types (series) were assigned by location based on the United States Department of Agriculture – National Cooperative Soil Survey (NCSS), accessible through the University of California (Davis) online browser (https://casoilresource.lawr.ucdavis.edu/gmap/). We selected and sampled 15 soil types to represent a range of relevant physical and chemical properties as listed in Table 1. The sample names are derived from the first three characters of the corresponding soil series name (e.g., Gladsen = Gla), except in the case of Casa Grande (=Cas), which appears at two locations, identified with the numerals “3” and “4” on the NCSS map. Accordingly, these samples are identified as Cas3 and Cas4. In cases where we collected two or more samples within the same soil series name, we added a lower-case identifier [e.g., Cas3(a) and Cas3(f)].
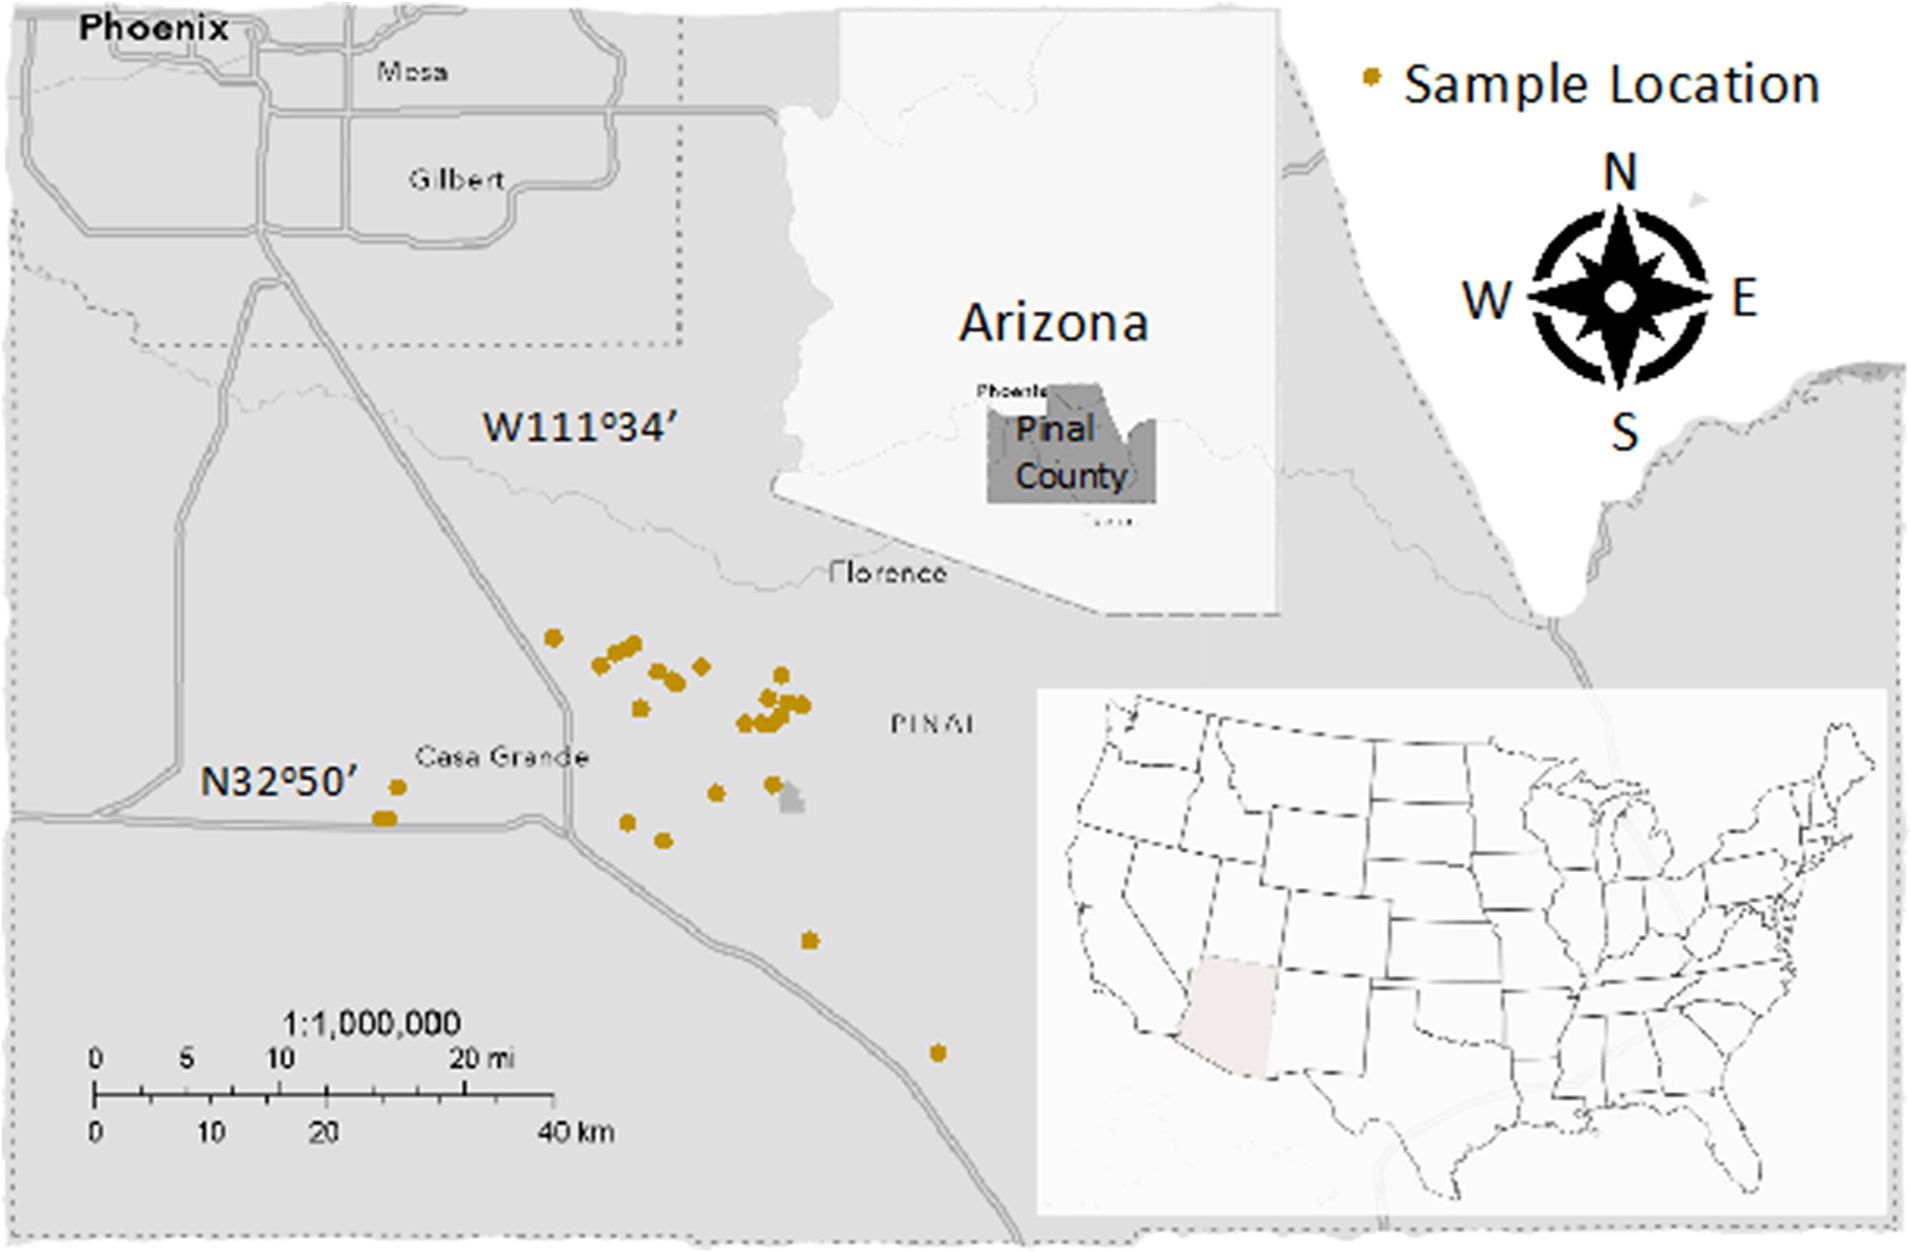
Figure 1. Soil sample locations used for this study. All locations are within Pinal County, Arizona. Summer monsoons, the primary source of dust storms, often travel northward through Pinal County into metropolitan Phoenix.
Table 1. Soil designations, physical, textural and chemical properties of soil samples in our survey.
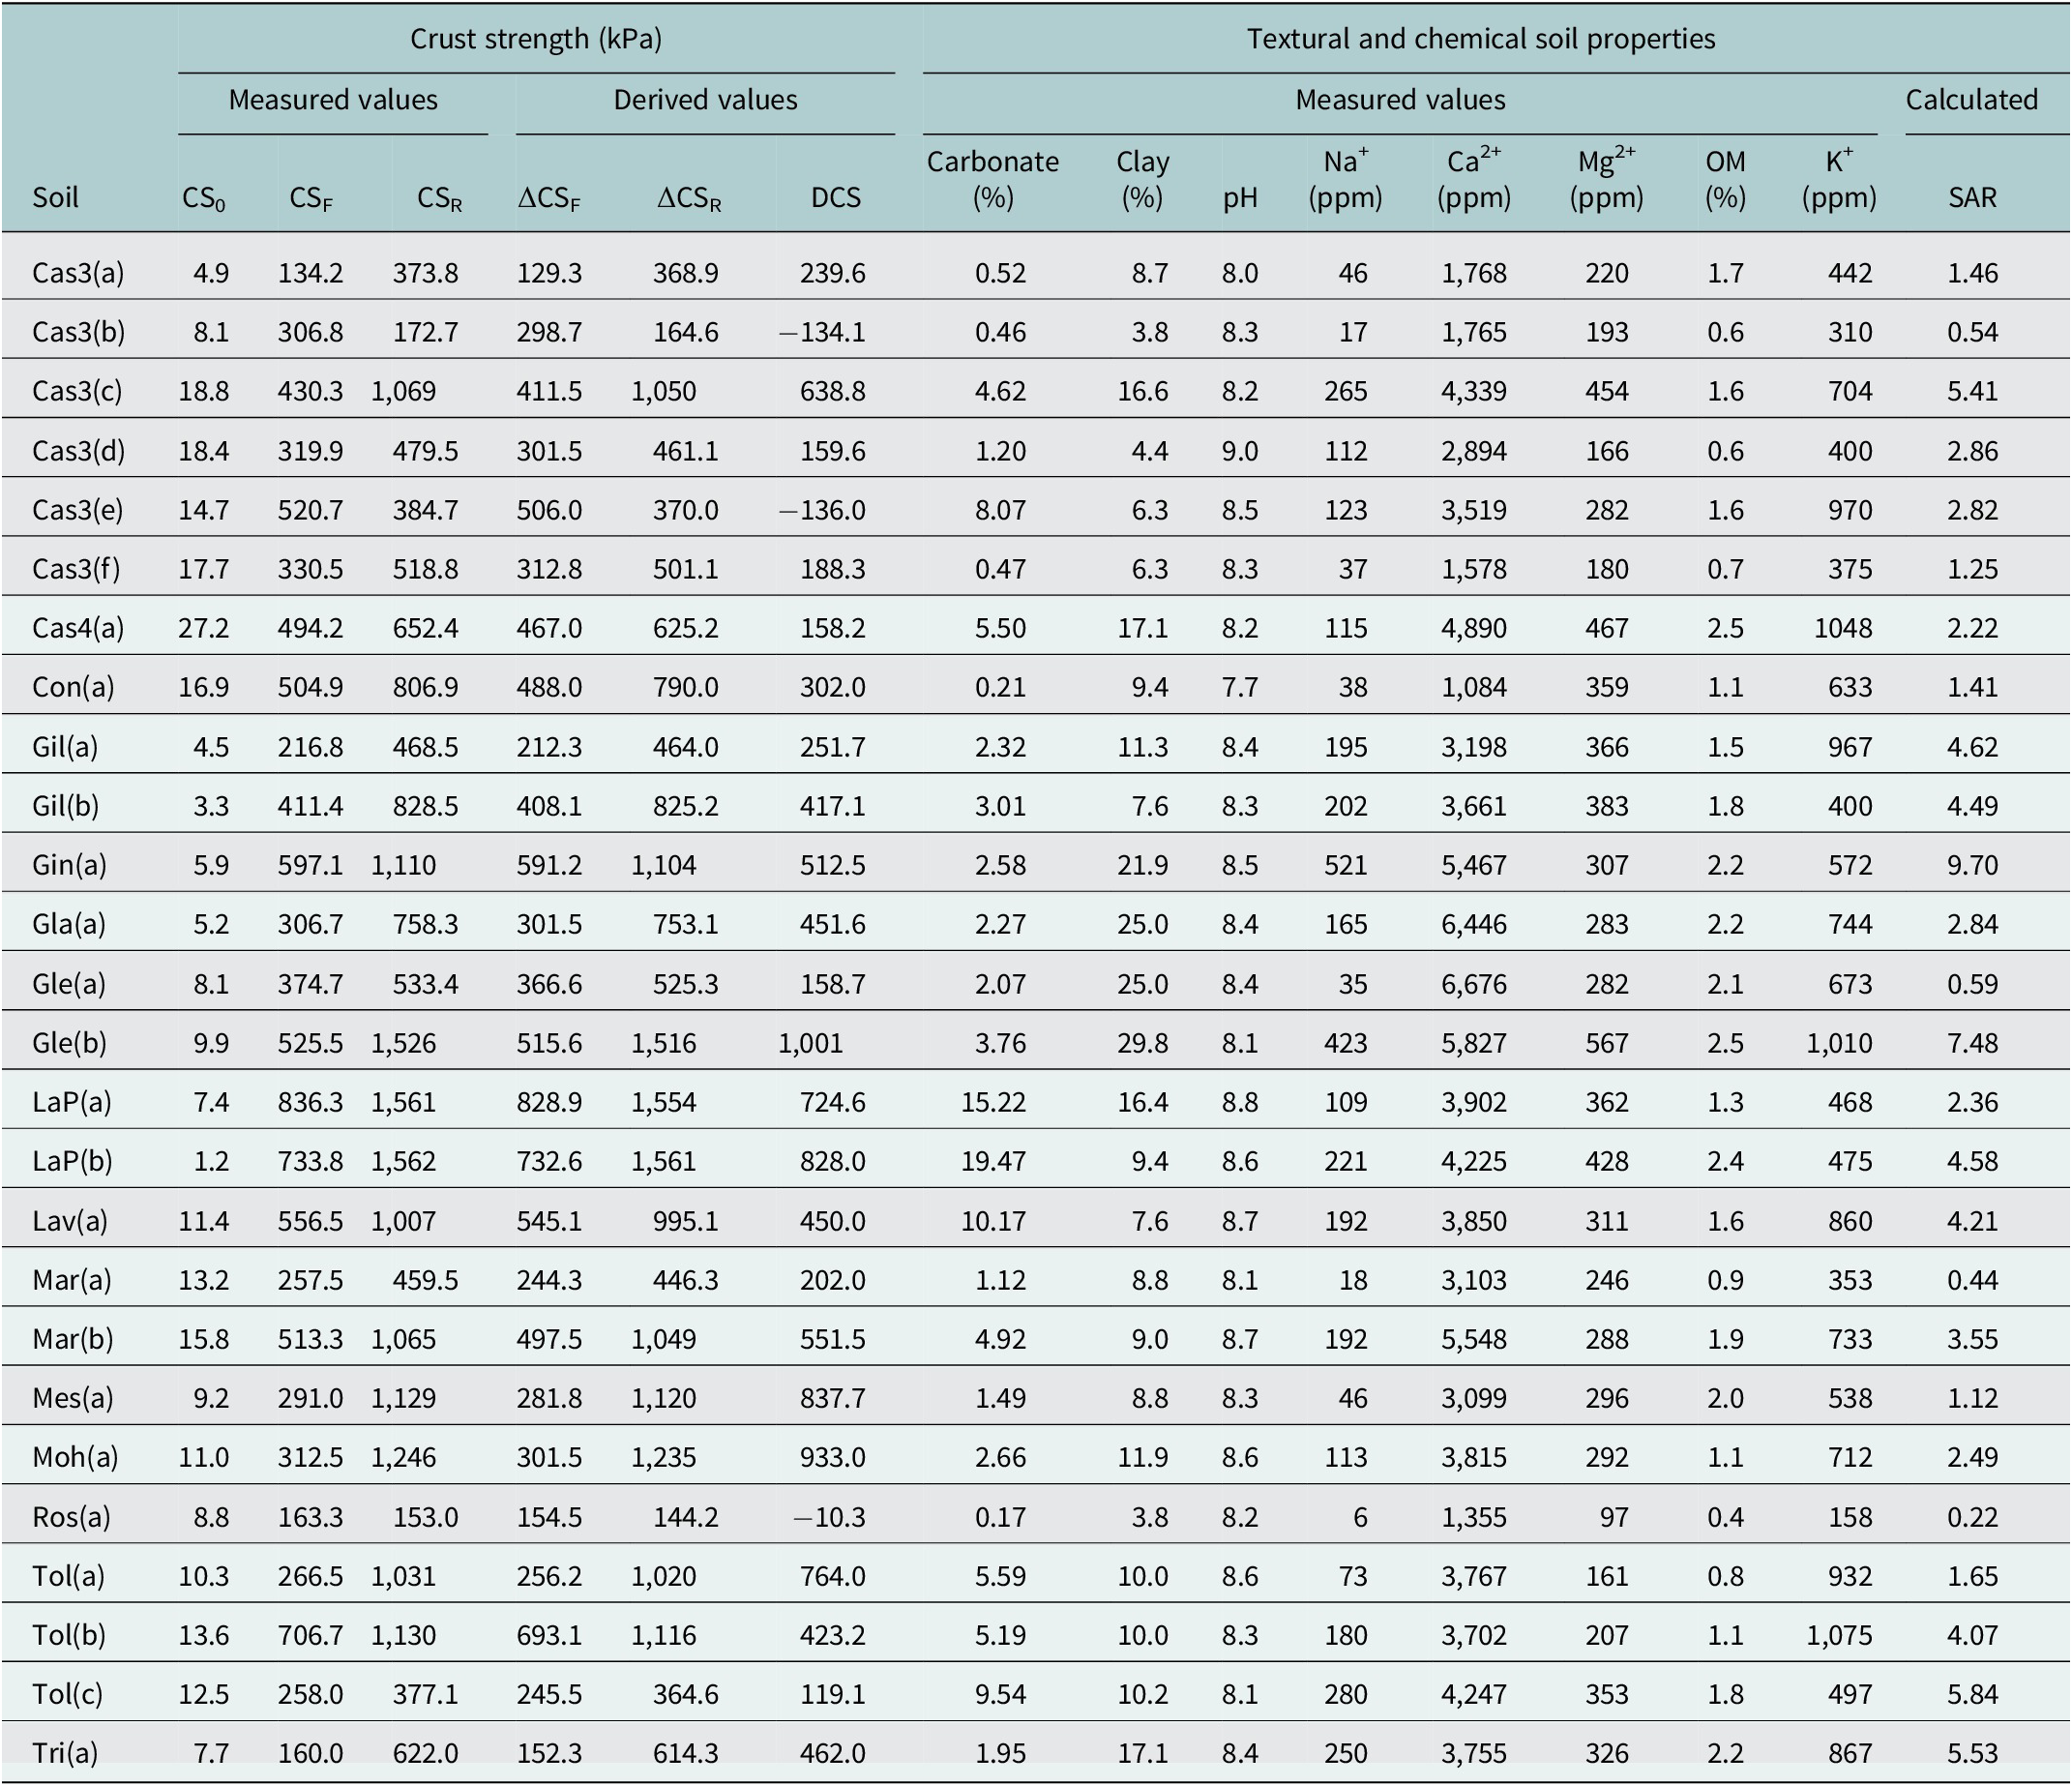
Note: CS0, Crust strength of dry, sieved soil measured as penetration resistance in kilopascals (kPa); CSF, Crust strength after wetting soil with fog; CSR, Crust strength after wetting soil with simulated rain; ΔCS F, Increase in crust strength due to fog (CS F – CS o); ΔCS R, Increase in crust strength due to simulated rain (CS R – CS o); DCS, Differential crust strength due to simulated rain compared to fog (ΔCS R − ΔCS F); Na +, Sodium; Ca 2+, Calcium; Mg 2+, Magnesium; SAR, Sodium adsorption ratio; OM, Organic matter; K +, Potassium. Shading separates soil types with the same series name.
We sampled the upper 5 cm of the soil, sieving samples through a 40 mesh (0.425 mm) screen to remove pre-formed peds, seeds, and very coarse sand, allowing for air drying prior to analysis. Residual soil moisture was determined by drying for 10 min in a microwave oven (Jalilian et al., Reference Jalilian, Moghaddam and Tagizadeh2017). In all cases, initial soil moisture was <6.7%. We used the measured residual moisture content to correct gravimetrically determined soil weight.
Chemical, textural, and structural characterization
The Schiebler volumetric method (ASTM D4373-21) was used to measure soil carbonate in triplicate using an Eijkelkamp Calcimeter. Dry soil specimens were treated with 4 M hydrochloric acid (HCl) to produce CO2 gas from carbonates, which was quantified by water displacement. The method was calibrated using commercially obtained calcium carbonate powder. Although the method implies the CO2 gas evolves from calcium carbonates, magnesium carbonates may also be detected, thus we specify these results broadly as “carbonate”. Standard geological thin sections (40 μm thick) were prepared from six field-crusted soils for microscopic examination using EpoFix epoxy resin (Tippkötter and Ritz, Reference Tippkötter and Ritz1996). Epoxy impregnation of the soils was achieved under a vacuum and left to cure overnight. Polished thin sections were prepared commercially by Spectrum Petrographics (Vancouver, WA) and analyzed using a standard dissection and petrographic microscope equipped with cross-polarizers.
Clay content was determined based on grain size using the bouyoucous hydrometer test (ASTM D7928). Other chemical soil tests (K+, pH, Na+, Ca2+, Mg2+, and organic matter) were performed commercially by WARD Laboratories. Three samples were sent to the lab in duplicate to verify sampling and analytical repeatability (Supplemental Table S1). The sodium adsorption ratio (SAR) was calculated as (Brady and Weil, Reference Brady and Weil2008):
 $$ \mathrm{SAR}=\frac{\left[{\mathrm{Na}}^{+}\right]}{\sqrt{\frac{1}{2}\left(\left[{\mathrm{Ca}}^{2+}\right]+\left[{\mathrm{Mg}}^{2+}\right]\right)}} $$
Penetration resistance (soil surface strength) and soil wetting
The strength of the soil surface was evaluated using an automated Instron penetrometer (Rice et al., Reference Rice, Mullins and McEwan1997; Rice and McEwan, Reference Rice and McEwan2001), where a blunt-end probe (6.9 mm diameter) affixed to a loading piston is pushed into the specimen at a constant rate of 1.3 mm/min, while the applied normal force and displacement are recorded continuously. Each specimen was tested multiple times, at least thrice, on visually undisturbed surfaces. The applied force (kiloNewtons) per unit area (square meter) has the units kiloPascals (kPa), which were plotted against the displacement (mm). The peak strength of the crust was determined as the average maximum stress (kPa) from the multiple runs.
We evaluated soil crust strength before and after inducing the formation of surface crusts by wetting with deionized water and drying. We used ~150 g of sieved soil (prepared as above) placed in a 100 mm diameter, 20 mm deep Petri dish. Background strength (CS0) was evaluated using dry, sieved soil (not wetted).
Next, the same Petri dish was placed in a 110 cm × 50 cm x 70 cm terrarium provided with a Coospider Reptile Fogger, where a mist was applied until the surface of the soil maintained a visible sheen for more than 10 min, indicating the surficial soil had become nearly saturated. The soil was then dried under an AC Infinity S22 light on a 12-h on–off cycle with a maximum intensity of ~1000 μE m−2 s−1, which created a peak temperature of ~32°C, for at least two on–off cycles. After drying, the resistance to penetration was measured as above, yielding the fog-induced crust strength (CSF).
Last, we simulated rain-induced crusts by wetting sieved soil to saturation with a PetraTools HD4000 garden sprayer with a fan nozzle. We used the lowest pressure necessary to create a full fan breadth and applied water using a back-and-forth motion from about 10 cm in height, which simulates high-energy raindrops of 1860 ± 60 Joules m−2 h−1 (compared to 10.3 ± 0.3 Joules m−2 h−1 with fog-wetting). Raindrop energy was calculated from the water application rate using equations in (Petrü and Kalibová, Reference Petrü and Kalibová2018). After wetting to saturation, soils were dried, as above, and measured for penetration resistance, yielding the rain-induced crust strength (CSR).
Threshold velocity (dust generation potential)
A Portable In Situ Soil Wind Erosion Laboratory (PI-SWERL™–Dust Quant LLC) was used to determine the potential for dust formation by wind shear (Etyemezian et al., Reference Etyemezian, Nikolich, Ahonen, Pitchford, Sweeney, Purcell, Gillies and Kuhns2007). The PI-SWERL™ device (Supplemental Figure S1) is equipped with a rotating flat annular blade in a closed chamber positioned 6 cm above the soil surface. We used six progressive blade rotation speeds: 2000, 3000, 4000, 4500, 5000, and 6000 RPM, for 60 s each. The RPM is converted to frictional velocity, (U *), using equation (1) (Etyemezian et al., Reference Etyemezian, Nikolich, Ahonen, Pitchford, Sweeney, Purcell, Gillies and Kuhns2007).
 $$ \mathrm{Frictional}\ \mathrm{velocity},{U}_{\ast }={C}_1{\alpha}^4{\mathrm{RPM}}^{C_2/\alpha } $$
where C 1 is a constant (=0.000683), C 2 is a constant (=0.832) and the value of α depends on the surface roughness (taken as 0.992 for the soil types/tests/scenarios in our study).
U * is then converted to equivalent wind velocities using equation (2) (Marticorena et al., Reference Marticorena, Bergametti, Aumont, Callot, N’Doumé and Legrand1997).
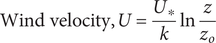 $$ \mathrm{Wind}\ \mathrm{velocity},U=\frac{U_{\ast }}{k}\ln \frac{z}{z_o} $$
where k is von Karman’s constant (set to 0.4); z is the height of laminar flow above the ground surface and is taken 1 m (for PI-SWERL™); z o is a surface roughness factor and is taken to be 0.001 m for desert landscapes. Laser diffraction is used to measure the resulting particle emissions flux (PM10). Each rotor speed corresponds to a specific wind velocity, calculated using internal proprietary software. We report the wind velocity at which soil particles begin to detach, i.e. the threshold velocity (Tv). Laboratory samples for PI-SWERL™ testing were prepared by lightly compacting 1.7–1.8 kg of surface soil into a 23 cm diameter × 2.5 cm pie pan and leveling off the surface to minimize surface roughness. The test was initially conducted on dried but untreated specimens and then repeated after creating an abiotic crust by rain-wetting and drying (as detailed for penetrometer testing).
Data analysis
To determine which chemical and/or physical properties may influence abiotic crusting, we applied linear regression models using R, open-source statistical analysis software (R-Core, 2017 Version 3.1-3). Linear model homoscedasticity, normality of residuals, and variance inflation factors were evaluated with the “car” package (Fox and Weisberg, Reference Fox and Weisberg2019). Correlations were performed on the derived values of increased fog-wetted crust strength (ΔCSF = CSF − CS0), increased rain-wetted crust strength (ΔCSR = CSR − CS0), and differential crust strength (DCS: ΔCSR − ΔCSF) versus each compositional variable. Once the (independent) linear model parameters were determined, we applied the Akaike algorithm (AICcmodavg package version 2.3.3, Mazerolle MJ, 2023) to evaluate which model best described the data (Akaike, Reference Akaike2011). We also considered and reported multi-variate models of regression to determine if they would give a better fit. We considered using transformed data for percent clay content (Lin and Xu, Reference Lin and Xu2020), but this did not have a meaningful impact on overall results.
Results
Abiotic crust formation: potential and modes
Abiotic soil crusting was consistently replicated in the laboratory using a wet/dry treatment. Crust formation was evident by comparing the baseline soil strength (S 0) of untreated, sieved soil to that attained by fog-wetting and drying (CSF). The magnitude of crusting, determined by penetrometer, varied considerably among samples, between 134 and 836 kPa (Table 1). A second round of crust formation, this time using simulated rainfall to include raindrop momentum in the crusting process (CSR), resulted in penetration forces ranging from 153 to 1562 kPa (Table 1). A single wet/dry cycle sufficed to form a crust, and additional wet/dry cycles did not result in increased strength regardless of watering mode (Supplemental Figure S2). It should also be noted that precipitated calcium carbonate is resilient in an outdoor setting with continued exposure to heat and ultraviolet light radiation (Woolley et al., Reference Woolley, Hamdan and Kavazanjian2021). In rain-wetted soils of sufficient clay content, a thin surficial clay seal forms that are visible by a characteristic surface sheen when dry, but such clay layers are absent in fog-wetted counterparts. Figure 2 displays these features in prepared petrographic thin sections, where the upper soil profile can be seen in cross-section. These observations are consistent with prior mechanistic notions of crust formation where clays create a depositional soil seal at the surface (Gillette et al., Reference Gillette, Adams, Muhs and Kihl1982; Laker and Nortjé, Reference Laker and Nortjé2019). Generally, the net gain in strength of rain-induced crusts (ΔCSR) was much higher than that of their corresponding fog-induced crust (ΔCSF), but in 3 out of 26 soils, we found the opposite (Table 1). These soils, Cas3(b), Cas3(e), and Ros(a)] had very low clay content and did not form a clay layer.
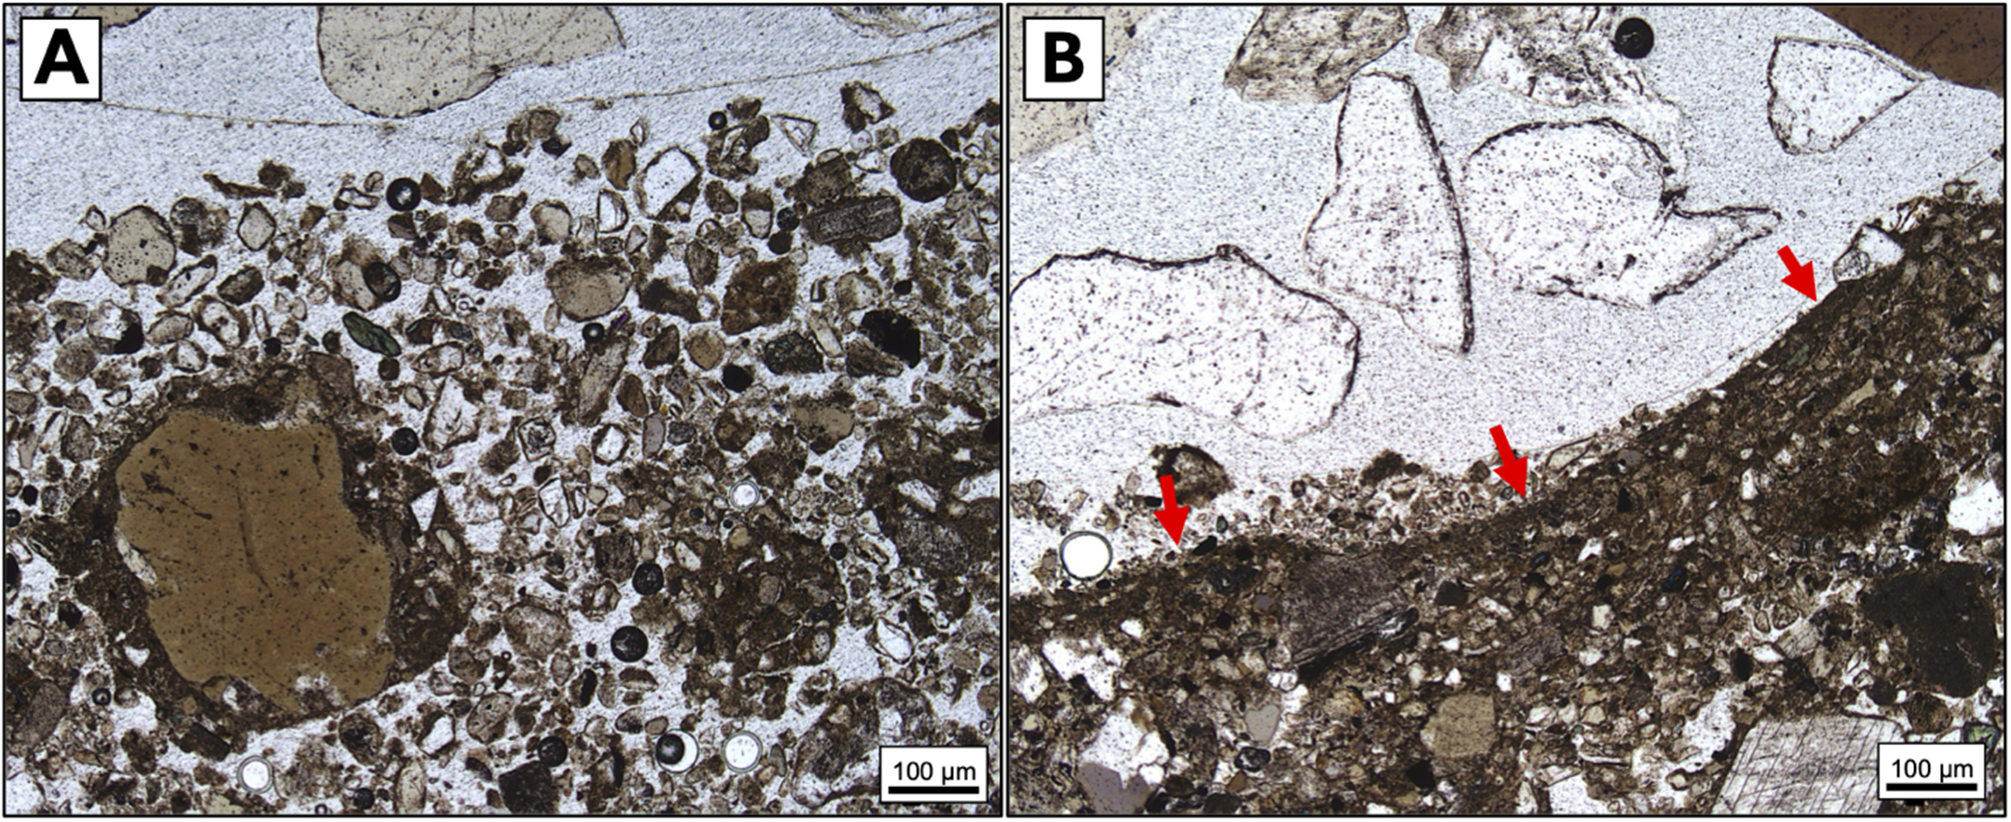
Figure 2. Geological thin section photomicrographs showing a cross-sectional profile of Tol(a) soil, a recently fallowed farm plot. (a) Soil collected from an area that had recently been plowed (prior to any subsequent rain events) showing a lack of developed soil crust at the surface (top). (b) Soil collected from the same area after winter rains had created a thin seal layer at the surface (red arrows).
We used penetrometer crust strength as a surrogate measure for wind erosion resistance. Prior research (Vos et al., Reference Vos, Fister, Eckardt, Palmer and Kuhn2020) has shown that penetrometer crust strength can predict the threshold velocity (Tv), a direct measure of dust generation potential by wind shear. However, we needed to confirm that this relationship was valid for our soils. Therefore, we conducted both penetrometer and Tv determinations on a subset of our soil samples. Strength (ΔCSR) indeed correlated with Tv (Figure 3; R 2 = 0.72, p = 0.008), predicting Tv with a slope of 4.6 x 10⁻³ ± 2.9 x 10⁻³ m2 s−1 kPa−1 (95% CI).
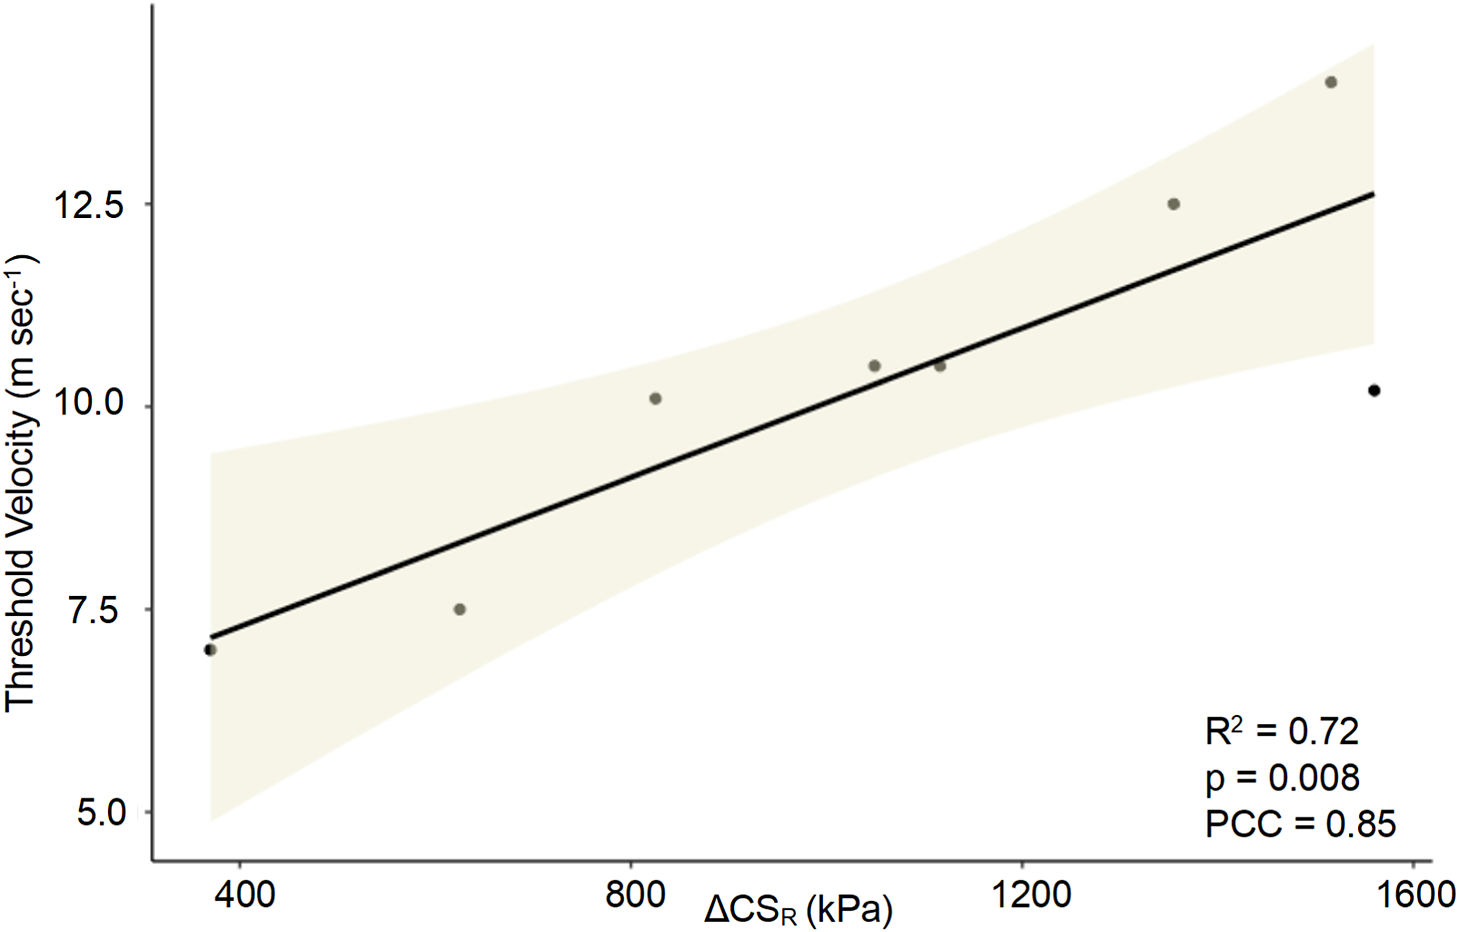
Figure 3. Correlation of PI-SWERL™-determined Threshold Velocity (Tv) with penetrometer-measured Rain-Wetted Crust Strength (ΔCSR). Solid line represents best-fit linear regression, with 95% confidence intervals (shaded area). n = 8, PCC = Pearson Correlation Coefficient, kPa = kiloPascals.
Compositional predictors of soil crust strength
We evaluated the importance of compositional variables that could potentially predict CSF and CSR by applying a linear correlation model to each variable independently and reporting p values and slopes with 95% confidence intervals (Table 2). For crust formed by fog watering, ΔCSF was a strong direct function of carbonate content (p < 0.0001, Table 2, Figure 4a), which spanned a wide range of values from 0.2 to 20% with a median value of 2.6%. Carbonate content was in fact the best predictor among all variables measured. The usefulness of a predictive variable depends not only on the goodness of fit (R 2) to a linear model, but also on how far away the slope is from zero. If the slope’s 95% CI includes a zero value, the variable has no predictive usefulness. To represent this, we define the Predictive Usefulness Index (PUI) as the ratio of the minimal absolute slope value in the 95% CI range to the best-fit slope. The PUI can range from 1 (best possible predictor) to 0 (useless as a predictor). Carbonate predicts ΔCSF with a PUI of 0.55 (Table 2). While soil pH had a positive correlation with ΔCSF (p < 0.05), it provided no predictive usefulness (PUI = 0; Table 2) because its slope 95% CI envelope included a slope of zero. Similarly, Mg2+ and Ca2+ were also correlated with ΔCSF though only marginally significant (p = 0.10), and PUIs were 0.07 and 0 (Table 2). PUIs are consistent with an Akaike analysis of ΔCSF: the weighted influence of carbonate was 99.79%. We also ran multivariate correlation analyses by combining all variables with carbonate against ΔCSF, and again the model with carbonate alone gave the best fit (Supplemental Table S2). Another consideration is the strength of the linear models, which can be evaluated using homoscedasticity and normality of residuals. Only carbonate met the statistical criteria (p < 0.05) for both. We conclude that ΔCSF can only be predicted using carbonate content.
Table 2. Correlation of soil crust strength parameters with single primary predictive variables
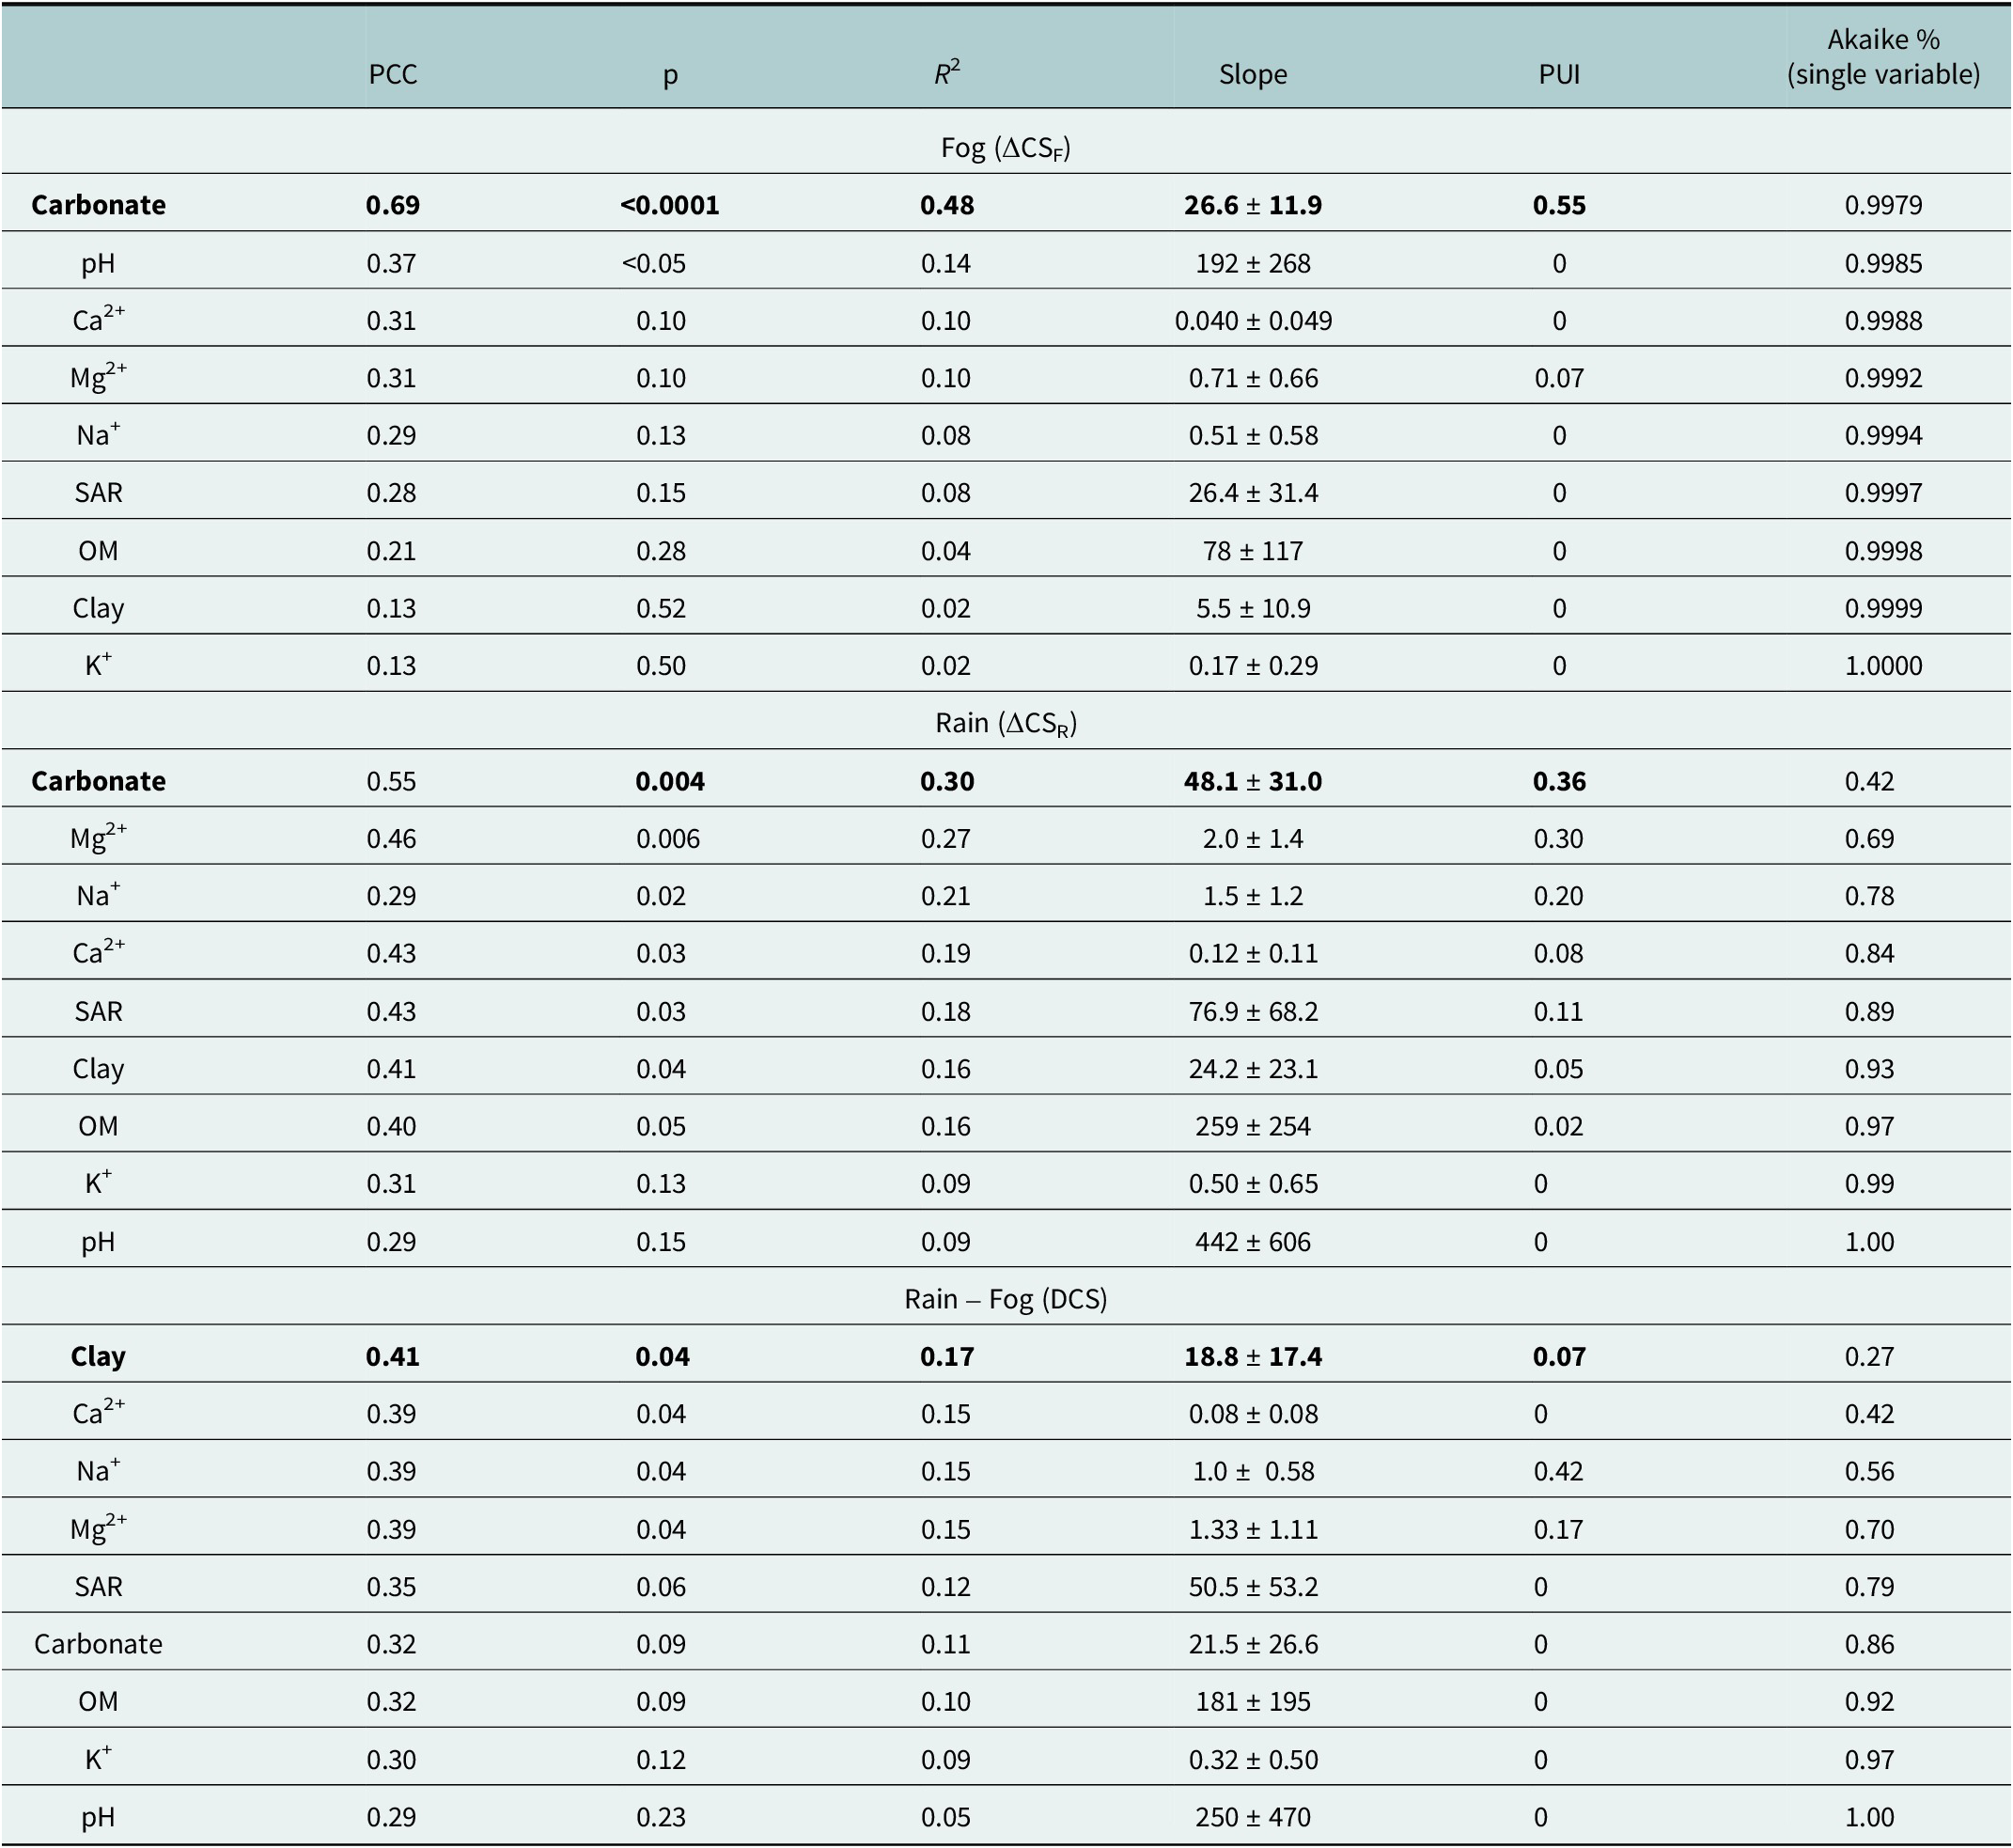
Note: Soil crust strength measures are: ΔCSF, Fog-wetted strength; ΔCSR, Rain-wetted strength; DCS, Differential crust strength (Rain – Fog). Among variables: SAR, Sodium adsorption ratio; OM, Organic matter. Listed statistics are the Pearson Correlation Coefficient (PCC) for a linear model, the probability that there is no correlation (p), the goodness of linear fit (R2), and the best-fit slope (slope), representing the change in strength divided by the change in the explanatory variable value, with its 95% confidence interval. Slope units vary: Carbonate + Clay = kPa/(g/100 g soil); cations and OM = kPa/(g/1 × 106 g soil); pH + SAR =kPa/(unitless). PUI stands for Predictive Usefulness Index, which is calculated as the ratio of the minimal absolute slope value in the 95% CI range to the best-fit slope and varies from 1 (best possible predictor) to 0 (useless as a predictor). Akaike weights depict the cumulative contribution of each additional variable to the percent of variation predicted by the primary variable (bolded) in order of decreasing contributions.
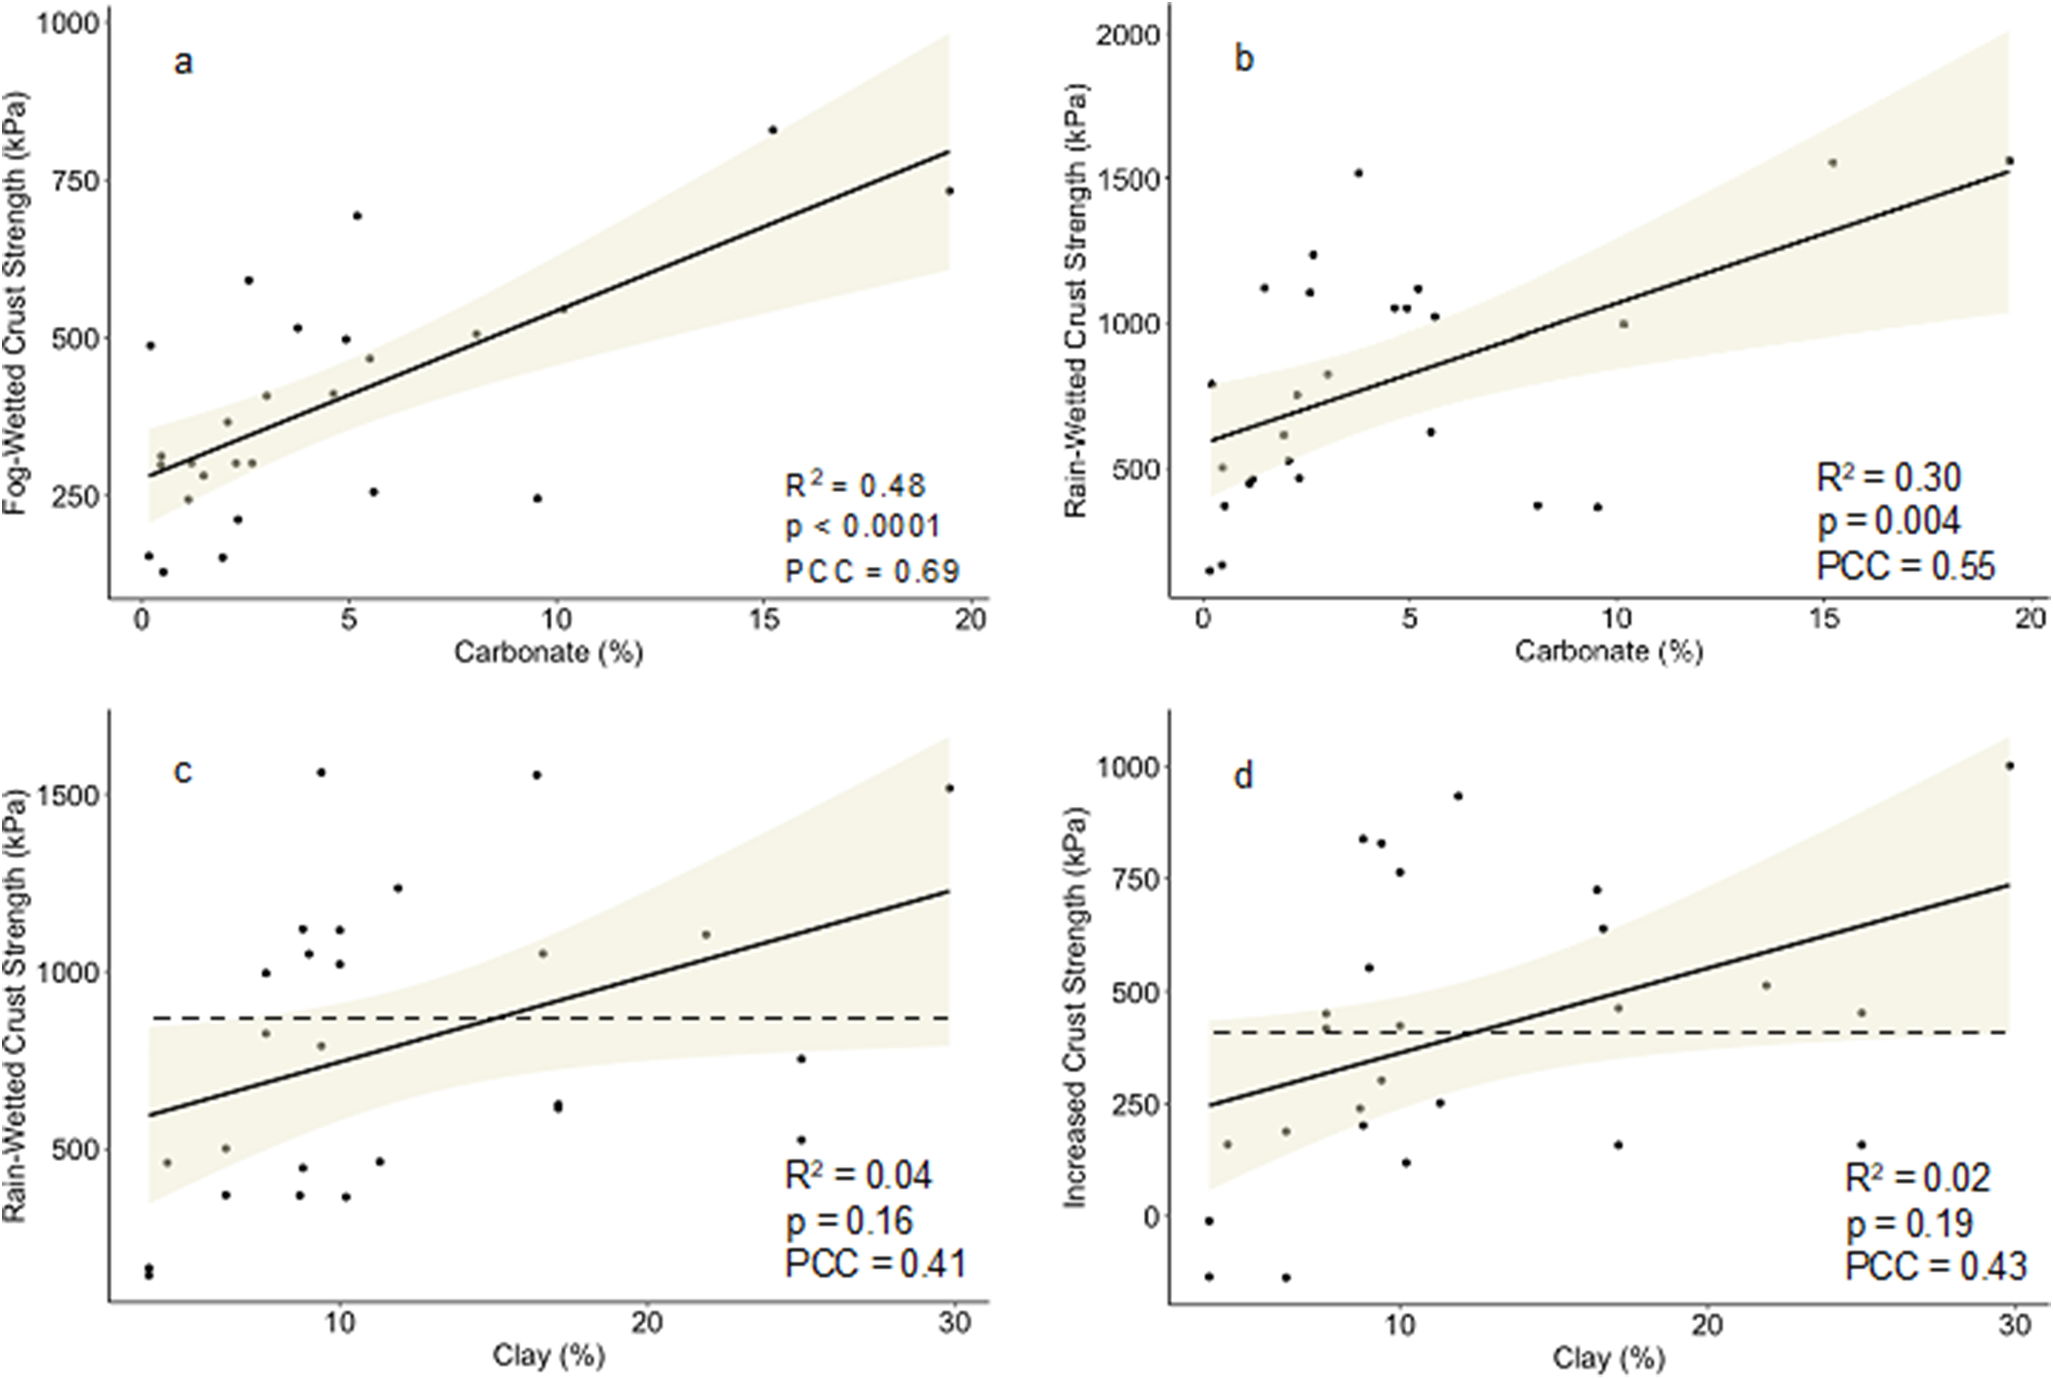
Figure 4. Best-fit models for abiotic crust strength as a function of predictive variables. PCC = Pearson Correlation Coefficient, kPa = kiloPascals. The solid line represents the best-fit linear model. The shaded area shows the 95% Confidence Interval for the slope (n = 26). The dashed line in (c) shows that the range includes a slope of 0 (Predictive Usefulness Index (PUI) = 0) and therefore is useless as a predictor. The comparable dashed line in (d) has a very small positive slope (PUI = 0.07) and therefore has minimal usefulness as a predictor.
With respect to rain-induced crust strength (ΔCSR), and considering only single variables, carbonate was also the best predictor of ΔCSR (p = 0.004, Table 2), the only variable whose linear model met homoscedasticity and normality of residuals criteria, and the one parameter with the highest Akaike weight (42%) and a PUI of 0.36 (Table 2, Figure 4b). Yet, the PUI for ΔCSR carbonate (0.36) was lower than that for ΔCSF carbonate (0.55). Other parameters (Ca2+, Mg2+, Na+, clay) had significant (p < 0.05) correlations but lower PUIs (Table 2). Mg2+ (PUI = 0.30) and to a lesser degree Na+ (PUI = 0.20) appeared to be potentially useful as secondary predictors. A multiple regression analysis here shows that Carbonate + Clay (Supplemental Table S2; adjusted R 2 = 0.40) provided a better fit than carbonate alone (R 2 = 0.30) and had an Akaike-weighted influence of 38%. Thus, while carbonate remains the main driver of ΔCSR, the influence of clays on this parameter seems important as an additional mechanism to increase crust strength (Table 1). However, clay alone is not a useful predictor of ΔCSR (PUI = 0.05, Table 2, Figure 4c). In addition to clay, we considered silt and sand content but did not find a helpful correlation. Sand, silt, and clay values are provided in the Supplemental Table and Figure S3, along with a soil texture triangle.
To further test the notion that clay is important in rain-wetted crust strength, we investigated the relationships of the differential crust strength, DCS = ΔCSR − ΔCSF, with potential drivers. These correlations were less robust as all linear models had lower homoscedasticity and normality of residuals (p < 0.2). Clay content had the strongest correlation (p = 0.04, Table 2, Figure 4d), where clay accounted for 27% of the Akaike weighted influence. This is consistent with our structural data in Figure 2. However, clay was not useful as a predictor (PUI = 0.07). The cations Ca2+, Mg2+, and Na+ seemed to contribute significantly (p = 0.04) to the increased strength in rain-induced crusts. Each cation was co-correlated with clay (Ca2+, p < 0.001: Mg2+, p = 0.002: Na+, p = 0.005), but the variance inflation factors were moderately low (2.54, 1.65, and 1.42, respectively), so independent effects were nevertheless evident. The multiple regression analysis for DCS showed the importance of clay, even when clay + carbonate (adjusted R 2 = 0.21) gave a slightly better fit than clay alone (R 2 = 0.17; Supplemental Table S2). Thus, while clay appears to be the main driver of DCS, the contribution of carbonate to the clay seal strength seems preeminent in terms of predictive value.
Discussion
We show that carbonate content can be used as a predictor of abiotic crust formation and strength in dryland farm soils from Pinal County in Arizona, and by deduction, to predict their potential as a source of wind-blown dust. Our experiments show that, following a soil-wetting event, drying causes carbonate (re)precipitation and soil cementation. This likely happens more prominently at the soil surface where water evaporation raises effective concentrations of carbonate and cations beyond their respective salt’s solubility products, promoting preferentially surface cementation, as a drop in water potential promotes upward flux of the soil solution to continuously feed the process. The current mechanistic framework for soil crust formation, based primarily on studies that focus on water infiltration, tends to emphasize clay re-deposition and sealing (Assouline, Reference Assouline2004; Cattle et al., Reference Cattle, Cousin, Darboux and Bissonnais2004) and downplays the role of cementation. Cementation has not been shown to be a factor in infiltration rates but effectively stabilizes soil against wind erosion (McFadden et al., Reference McFadden, McDonald, Wells, Anderson, Quade and Forman1998; Robinson and Woodun, Reference Robinson and Woodun2008). We saw a very high degree of correlation (Table 2; p < 0.0001) between fog-wetted strength (CSF) and carbonate, and virtually exclusive dependence on this parameter. This conclusion is also supported indirectly by the positive relationship of pH to crust strength. CSF had a highly significant (p < 0.05, Table 2) correlation with pH, as alkalinization increases the proportion of carbonate ions in solution, promoting precipitation, even within an invariant level of dissolved inorganic carbon (Stumm and Morgan, Reference Stumm and Morgan1996). This effect did not overwhelm the importance of the absolute carbonate content, and pH did not rise to the level of a good predictor. Similarly, divalent cation levels can be expected to correlate with crust strength, as they also influence how easily soil solution concentrations exceed the solubility product for carbonate minerals. Indeed, ΔCSR had a high correlation with Mg2+, and Ca2+ (p < 0.03, Table 2). We acknowledge that others have speculated on the role of carbonates in soil crusting (Gillette et al., Reference Gillette, Adams, Muhs and Kihl1982; Robinson and Woodun, Reference Robinson and Woodun2008; Virto et al., Reference Virto, Gartzia-Bengoetxea and Fernández-Ugalde2011; Feng et al., Reference Feng, Sharratt and Vaddella2013), though without thorough experimental interrogations. By contrast, the correlation between crust strength and clay content was weak. Hence, abiotic crust strength is primarily controlled by carbonate precipitation, while clay sealing has a secondary effect that increases strength. By isolating the factors that cause deposition and cementation processes, our results not only point to a useful predictive tool but suggest carbonate precipitation may be an important factor to consider when evaluating the potential abiotic crust strength of desert farm soils, and possibly other settings with frequent disturbance such as off-road areas and military training grounds.
By comparing fog-wetted to rain-wetted soils, we were able to parse out cementation due to carbonate precipitation, eliminating raindrop energy as a factor needed to break apart and disperse aggregate-bound clays (McIntyre, Reference McIntyre1958). Comparisons of fog and rain-wetting used in the past have been applied to study infiltration rates, not crusting (Kaseke et al., Reference Kaseke, Mills, Esler, Henschel, Seely and Brown2012; Li et al., Reference Li, Kandakji, Lee, Tatarko, Blackwell, Gill and Collins2018), where rain-wetting decreases infiltration (Agassi et al., Reference Agassi, Morin and Shainberg1985). In these cases, the authors report how dispersed clays and sodium combine to create a water-resistant soil seal (Khatei et al., Reference Khatei, Rinaldo, Van Pelt, D’Odorico and Ravi2024), but cementation was not considered. Consistent with this canonical mechanistic framework based on the formation of a depositional clay seal, DCS was most strongly correlated with clay (p = 0.04, Table 2). If clay sealing were the principal mechanism of increased crust strength, one should expect the content of Na+ to be also important, because it acts as a clay dispersing agent (Parameswaran and Sivapullaiah, Reference Parameswaran and Sivapullaiah2017). Indeed, in our study, Na+ was also correlated with strength and is potentially a useful predictor of DCS (PUI = 0.42, Table 2).
Our study presents a unique condition by using exclusively arid agricultural soils and considering crust strength by wetting with and without forceful rain impact. Prior mechanistic studies have largely considered how the destructive force of raindrops destroys soil aggregates (McIntyre, Reference McIntyre1958; Fan et al., Reference Fan, Lei, Shainberg and Cai2008; Feng et al., Reference Feng, Sharratt and Vaddella2013). In our setting, the soils had a low degree of aggregation after dry season plowing. We removed even small aggregates in our experiment by sieving. Thus, the experimental conditions may have dampened a larger effect of raindrop energy potentially present in non-agricultural soils. In addition, the aridisols we targeted may have enhanced the role of carbonate precipitation and cementation due to their alkaline nature and high content of calcium, magnesium, and carbonate ions (Dunkerley, Reference Dunkerley and Thomas2011). In such soils, processes that stabilize soil by increasing flocculation and aggregate formation (Singer and Warrington, Reference Singer, Warrington, Summer and Stewart1992) may not be as relevant.
While our study has implications for the mechanisms of desert soil crust formation, our primary objective was to find a predictive tool to estimate abiotic crust strength as a tool to aid in dust control measures. To that end, we have shown that in desert agricultural soils carbonate is the best predictor of crust strength, a surrogate for dust-forming potential (Rice et al., Reference Rice, Mullins and McEwan1997) (Figure 3). While we obtained a favorable correlation of crust strength and Tv for dust formation (p = 0.008, Figure 3), we acknowledge the limitations of our findings. PI-SWERL™ results require expertise to interpret (Supplemental Figure S4), and penetrometer tests can be variable, with the potential for false positives and outliers (Supplemental Figure S5). In addition, we extended our dust susceptibility prediction across two correlative steps (carbonate to CSR and to dust formation potential).
We contend that fugitive dust control in large areas such as Pinal County can be optimized by identification of soils with low crusting potential, and prioritizing interventions there. In this regard, the soil’s carbonate content constitutes a suitable screening parameter that is measurable with simple, portable tests. Some carbonate content data is immediately available in public databases, such as the USGS Soil Survey, although local carbonate testing would be prudent since soils within a single type can be variable in carbonate content and dust susceptibility (for example, consider the Cas3 series in Table 1). It is possible to map the estimated wind erodibility of soils based on carbonate content. We provide an example in Supplemental Figure S6. Previous work on modeling aeolian dust concentrations in Pinal County, using soil texture, met with limited success (Joshi, Reference Joshi2021). Our work suggests that the inclusion of carbonate content may improve such efforts. We note here that such a model would only predict dust potential from undisturbed soils because continual disturbance by plowing effectively destroys the soil armor. Based on our lab and field observations, all disturbed soils are potential dust sources, thus both soil stabilization and modified farming practices in fallow fields are required for effective dust mitigation strategies.
Open peer review
For open peer review materials, please visit https://doi.org/10.1017/dry.2024.5.
Supplementary material
To view supplementary material for this article, please visit http://doi.org/10.1017/dry.2024.5.
Data Availability statement
All results are listed in Table 1 and Supplementary Table S1.
Acknowledgments
Paco Ollerton helped us navigate within the Pinal County farming community, and, as a member of the ADEQ Agricultural PM10 Best Management Practices Committee for dust control, provided insight into existing dust control efforts. Dr. Xi Yu performed some of the lab testing and analysis and Dr. Pierre Herckes provided helpful editorial comments. We thank Dr. Tom Sharp and Leah Shteynman for access and assistance in the petrographic microscopy laboratory at Arizona State University.
Author Contribution
BS and FGP prepared the manuscript, with sections contributed by ES. FGP directed the research. EK and ES directed the penetrometer and PI-SWERL™ testing and, along with MF, provided manuscript edits. SAA and AHA performed the penetrometer and PI-SWERL™ testing. JLZ coordinated soil thin section mounts and accompanying microscopy.
Financial Support
Funding for this research was provided by a grant from the Arizona Board of Regents (#31).
Competing interest
None.


 Open access
Comments
Dear Drs. Osvaldo Sala and David Eldridge,
With respect to our research article: “Abiotic crust formation in fallow agricultural desert soils through carbonate cementation reduces fugitive dust.”
We believe this work is well suited for placement into the new journal: Cambridge Prisms: Drylands. While the work is genuinely a scientific research effort, it is primarily intended as an engineering and management tool to address the dryland-specific issue of dust storm formation. We initially set out to evaluate potential soil stabilization methods that could reduce hazardous airborne dust. However, throughout the course of our study we became aware of two confounding issues. One was an observation that the soils we tested tended to create their own stabilizing crust that in some cases would render treatment gratuitous. Another issue is the sheer scope of the problem – we would be hard pressed to treat enough land area to substantially reduce regional dust loads. This work addresses both issues and provides a potential path forward, where the scientific principles behind potential treatment options may be applied at sufficient scale. However, where would one publish such work, which cannot be easily ascribed to a specific discipline? By happy coincidence you are helping to institute a new topic-driven journal designed for just such research.
As Dr. Eldridge points out in the journal’s introductory video, agriculture and animal husbandry is an essential part of dryland activities. Our work focuses on agricultural areas because they are often the most significant regional source of dust due to widespread disturbance. However, we also recognize other factors. Current global warming and drying trends will extend fallow periods, increasing dust vulnerability. Also, farmers and purveyors of livestock are themselves adversely impacted by airborne dust.
The Arizona Board of Regents funded our research, in Pinal County, Arizona, out of recognition that dust sources vary regionally, so local solutions are needed. Nevertheless, we believe the basic underlying principle, that of carbonate cementation, is likely ubiquitous in arid and semi-arid soils.
Our primary intention was to suggest that carbonate cementation could be exploited as a dryland management tool. However, we are aware that our findings may appear to contradict the canonical understating of soil surface crusting as being driven primarily by clay stacking. To that end, we have been careful to qualify our findings, which suggest a soil crusting paradigm that is unique to drylands and have offered reviewer suggestions that we anticipate will be mindful of this context. The dryland-specific context is another reason we feel Cambridge Prism: Drylands is the most appropriate placement for our work.
Thank you for your consideration.