Thornicroft & Slade (Reference Thornicroft and Slade2000) said:
“Can mental health outcome measures be developed which meet the following three criteria: (1) standardised, (2) acceptable to clinicians, and (3) feasible for ongoing routine use? We shall argue that the answers at present are ‘yes’, ‘perhaps’, and ‘not known’.”
For psychotherapies, we argue that the Clinical Outcomes in Routine Evaluation — Outcome Measure (CORE—OM) described below can answer ‘yes’, ‘largely’ and ‘generally’. There have been previous initiatives to create a core battery to assess change in psychotherapy (Reference Waskow, Waskow and ParloffWaskow, 1975; Reference Strupp, Horowitz and LambertStrupp et al, 1997). We have analysed some reasons why these did not achieve wide uptake (Reference Barkham, Evans and MargisonBarkham et al, 1998). In the UK, the need for a core battery and routine data collection has been acknowledged, as has the need for routine effectiveness and efficacy evidence (Department of Health, 1996, 1999; Reference Roth and FonagyRoth & Fonagy, 1996). Despite a multitude of measures (Reference Froyd, Lambert and FroydFroydet al, 1996), there is still no single, pantheoretical measure. Such a measure would need to measure the ‘core’ domains of problems, meet Thornicroft & Slade's desiderata and be ‘copyleft’ (i.e. the copyright holders license it for use without royalty charges subject only to the requirement that others do not change it or make a profit out of it).
Development of the new outcome measure
This paper assesses the self-report CORE—OM. Its rationale and development have been described elsewhere (Reference Barkham, Evans and MargisonBarkham et al, 1998; Reference Evans, Mellor-Clark and MargisonEvans et al, 2000). A team, led by the authors, reviewed current psychological measures and produced a measure refined in two waves of pilot work involving quantitative analyses and qualitative feedback from a wide group of service users and clinicians. This paper reports the psychometric properties and utility of the final measure.
The measure
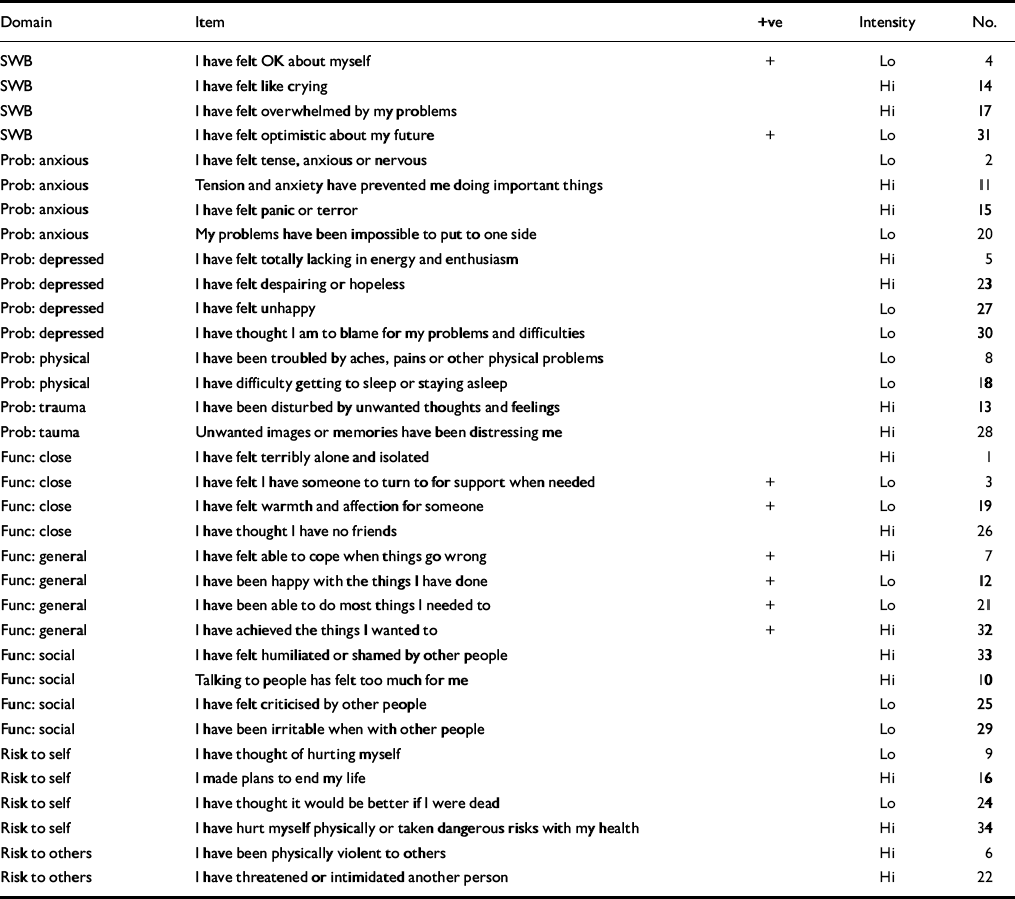
The measure fits on two sides of A4 and includes 34 simply worded items all answered on the same five-point scale ranging from ‘not at all’ to ‘most or all the time’. It can be hand-scored or scanned by computer. The items cover four domains: subjective well-being (four items), problems/symptoms (twelve items), life functioning (twelve items) and risk (to self and to others; six items) (see Table 1). Some items are tuned to lower and some to higher intensity of problems in order to increase scoring range and sensitivity to change; 25% of the items are ‘positively’ framed with reversed scores. Overall, the measure is problem scored (i.e. higher scores indicate more problems). Scores are reported as means across items that give a ‘pro-rated’ score if there are incomplete responses. For example, if two items have not been responded to, the total score is divided by 32 (see below). Pro-rating an overall score is not recommended if more than three items have been missed; nor should pro-rating be applied to domains if more than one item is missing from that domain.
Table 1 Domains and items of the Clinical Outcomes in Routine Evaluation — Outcome Measure
| Domain | Item | +ve | Intensity | No. |
|---|---|---|---|---|
| SWB | I have felt OK about myself | + | Lo | 4 |
| SWB | I have felt like crying | Hi | 14 | |
| SWB | I have felt overwhelmed by my problems | Hi | 17 | |
| SWB | I have felt optimistic about my future | + | Lo | 31 |
| Prob: anxious | I have felt tense, anxious or nervous | Lo | 2 | |
| Prob: anxious | Tension and anxiety have prevented me doing important things | Hi | 11 | |
| Prob: anxious | I have felt panic or terror | Hi | 15 | |
| Prob: anxious | My problems have been impossible to put to one side | Lo | 20 | |
| Prob: depressed | I have felt totally lacking in energy and enthusiasm | Hi | 5 | |
| Prob: depressed | I have felt despairing or hopeless | Hi | 23 | |
| Prob: depressed | I have felt unhappy | Lo | 27 | |
| Prob: depressed | I have thought I am to blame for my problems and difficulties | Lo | 30 | |
| Prob: physical | I have been troubled by aches, pains or other physical problems | Lo | 8 | |
| Prob: physical | I have difficulty getting to sleep or staying asleep | Lo | 18 | |
| Prob: trauma | I have been disturbed by unwanted thoughts and feelings | Hi | 13 | |
| Prob: tauma | Unwanted images or memories have been distressing me | Hi | 28 | |
| Func: close | I have felt terribly alone and isolated | Hi | 1 | |
| Func: close | I have felt I have someone to turn to for support when needed | + | Lo | 3 |
| Func: close | I have felt warmth and affection for someone | + | Lo | 19 |
| Func: close | I have thought I have no friends | Hi | 26 | |
| Func: general | I have felt able to cope when things go wrong | + | Hi | 7 |
| Func: general | I have been happy with the things I have done | + | Lo | 12 |
| Func: general | I have been able to do most things I needed to | + | Lo | 21 |
| Func: general | I have achieved the things I wanted to | + | Hi | 32 |
| Func: social | I have felt humiliated or shamed by other people | Hi | 33 | |
| Func: social | Talking to people has felt too much for me | Hi | 10 | |
| Func: social | I have felt criticised by other people | Lo | 25 | |
| Func: social | I have been irritable when with other people | Lo | 29 | |
| Risk to self | I have thought of hurting myself | Lo | 9 | |
| Risk to self | I made plans to end my life | Hi | 16 | |
| Risk to self | I have thought it would be better if I were dead | Lo | 24 | |
| Risk to self | I have hurt myself physically or taken dangerous risks with my health | Hi | 34 | |
| Risk to others | I have been physically violent to others | Hi | 6 | |
| Risk to others | I have threatened or intimidated another person | Hi | 22 |
We recommend the measure to be used before and at the end of therapy. It may be useful to repeat it during therapy in longer therapies and follow-up is highly desirable, if not often sought in current clinical practice. Different therapies and services will address different questions and create very different ‘best’ usage. A research-oriented example is given by Barkham et al (Reference Barkham, Margison and Leach2001). We know of services offering very brief therapies that find it useful as an overall nomothetic assessment on initial and final session completions, whereas other services have posted the measure at referral and repeated it at assessment or first session. Services with waiting times between assessment and therapy have also found checking stability over that interval informative. Reliable and clinically significant change appraisal (see below) supports a case audit of successes and failures.
METHOD
The analyses assessed whether the measure is usable, reliable (i.e. sufficiently uncontaminated by random error) and valid (i.e. apparently measuring what it intended to). This paper reports specifically on usability, internal reliability, test—retest reliability, convergent validity in relation to other measures and validity in large-effect sizes for clinical/non-clinical comparison and change but small-effect sizes for socio-demographic variables.
The data
Results are reported on data from two main samples: a non-clinical sample and a clinical sample. Samples are described in Table 2.
Table 2 Characteristics of non-clinical and clinical samples

| Sample | Type of sample | n | Female n(%) | Male n(%) | Gender not known | Age range (years) | 25th, 50th, 75th centiles |
|---|---|---|---|---|---|---|---|
| Non-clinical (n=1106) | University | 691 | 304 (44) | 381 (55) | 6 | 17-43 | 19, 20, 23 |
| University (test—retest sample) | 55 | 46 (84) | 8 (15) | 1 | 20-45 | 20, 21, 23 | |
| Sample of convenience | 360 | 251 (70) | 109 (30) | 0 | 14-45 | 18, 20, 23 | |
| Clinical (n=890) | 23 sites (sample size 10-96, mean=42) | 890 | 530 (60) | 344 (39) | 16 | 16-78 | 26, 34, 45 |
The clinical data came from 23 sites that expressed an interest in such a measure in our initial survey of purchasers and providers (Reference Evans, Mellor-Clark and MargisonEvans et al, 2000) or were known through the UK Society for Psychotherapy Research's ‘Northern Practice Research Network’. The majority of sites were within the National Health Service (NHS) but also included three university student counselling services and a staff support service. Two services were focused on primary care, whereas others had wider spans of referrals. Leadership and membership varied, including medical psychotherapists, clinical psychologists, counselling psychologists, counsellors and psychotherapists. Theoretical orientation also varied, the majority describing themselves as ‘eclectic’ and the remainder asserting behavioural, cognitive—behavioural or psychodynamic orientations. Minimal patient demographic information was collected but non-completion rates were not assessed because most services said that they were not logistically ready for this. Data used were the first available when from pre-treatment or the first treatment session.
One non-clinical sample was from a British university with both undergraduate and postgraduate students. To complement this in relation to the ‘general population’, a ‘sample of convenience’ was sought from non-clinical workers, relatives and friends of the clinicians in the CORE battery team and in the major collaborating sites. Differences between the student and non-student samples generally were minimal and all results reported here are pooled across both.
Analysis
The CORE—OM data were scanned by computer using the FORMIC data-capturing system (Formic Design and Automatic Data Capture, 1996). Most analyses were conducted in SPSS for Windows, version 8.0.2. Non-parametric tests were used because statistical power was high and distributions generally differed significantly from Gaussian. All inferential tests of differences were two-tailed againstP<0.05. The large sample sizes gave high statistical power so that significance would be found for small effects, thus effect sizes and confidence intervals (Reference Gardner and AltmanGardner & Altman, 1986) generally are reported. Most were produced by SPSS but confidence intervals for Spearman correlations were calculated using Confidence Interval Analysis (CIA; Reference Gardner, Gardner and WinterGardneret al, 1989) and those for Cronbach's alpha were calculated using an SAS/IML (SAS Institute, 1990) program written by one of us (C. E.), implementing the methods of Feldt et al (Reference Feldt, Woodruff and Salih1987).
RESULTS
Acceptability
The first fundamental requirement of any measure is that respondents complete it. Of the total, 91% of the non-clinical and 80% of the clinical samples returned complete data. The difference is statistically significant (P<0.0005). The numbers omitting few enough items to allow pro-rating showed a different pattern, with 1084 (98%) of the non-clinical and 863 (97%) of the clinical samples retaining sufficient items to allow scoring (P=0.15).
The item that was most often incomplete was no. 19 (‘I have felt warmth and affection for someone’) in both samples (2.5% incomplete in the non-clinical and 3.8% incomplete in the clinical sample). The overall omission rate was 1.7%. If this applied for all items, then the numbers omitted would be distributed binomially. Forty-three or more omitted would be a significantly (P<0.05) elevated number. Items exceeding this were nos 21 and 34 (43 omissions), nos 20 and 30 (44), no. 32 (49) and no. 19 (61). A significantly low number of omissions would be 24 or fewer. These items were no. 3 (23 omissions), no. 2 (20), no. 14 (18) and no. 5 (16). There is heterogeneity in omission of items, with some suggestion that later items were omitted more frequently, but there is no link with domain.
Internal consistency
Internal reliability is indexed most often by coefficient α (Reference CronbachCronbach, 1951), which indicates the proportion of the variance that is covariant between items. Low values indicate that the items do not tap a nomothetic dimension of individual differences. Very high values (near unity) indicate that too many items are being used or that items are semantically equivalent (i.e. not adding new information to each other). All domains show α of >0.75 and <0.95 (i.e. appropriate internal reliability; Table 3). Confidence intervals show that the values are estimated very precisely by the large sample sizes. Despite this, only the problem domain showed a statistically significant lower reliability in the clinical than the non-clinical sample. Even this difference of 2% (88% v. 90%) in the proportion of covariance is not problematic, although its origins may prove to be of theoretical interest.
Table 3 Coefficient α (95% CI) denoting internal consistency for non-clinical and clinical samples

| Domain | Non-clinical (n=1009) | Clinical (n=713) |
|---|---|---|
| Subjective well-being (4 items) | 0.77 (0.75-0.79) | 0.75 (0.72-0.78) |
| Problems/symptoms (12 items) | 0.90 (0.89-0.91)* | 0.88 (0.87-0.89)* |
| Functioning (12 items) | 0.86 (0.85-0.87) | 0.87 (0.86-0.88) |
| Risk (6 items) | 0.79 (0.77-0.81) | 0.79 (0.77-0.81) |
| Non-risk items (28 items) | 0.94 (0.93-0.95) | 0.94 (0.93-0.95) |
| All items (34 items) | 0.94 (0.93-0.95) | 0.94 (0.93-0.95) |
Test—retest stability
Very marked score changes over a short period of time would suggest problems. Of 55 students approached, 43 returned complete data from both occasions. Test—retest correlations were highest within domains (see Table 4). The stability of the risk domain was lowest at 0.64, which is unsurprising in view of the small length and situational, reactive nature of these items. The stabilities of 0.87-0.91 for all other scores are excellent. The second part of Table 4 gives the mean change, 95% confidence interval and the significance (Wilcoxon test), showing small but statistically significant falls on some scores.
Table 4 Test—retest stability in a non-clinical student sample (n=43)

| Spearman's ρ | Change | ||||||||
|---|---|---|---|---|---|---|---|---|---|
| Domain | W | P | F | R | -R | All | Mean | 95% Cl | P 1 |
| Well-being (W) | 0.88 | 0.76 | 0.82 | 0.50 | 0.85 | 0.85 | 0.06 | -0.08 to 0.21 | 0.30 |
| Problems (P) | 0.80 | 0.87 | 0.84 | 0.54 | 0.88 | 0.88 | 0.14 | -0.003 to 0.29 | 0.04 |
| Functioning (F) | 0.75 | 0.68 | 0.87 | 0.44 | 0.81 | 0.80 | 0.11 | -0.003 to 0.22 | 0.02 |
| Risk (R) | 0.39 | 0.48 | 0.48 | 0.64 | 0.50 | 0.51 | 0.02 | -0.02 to 0.07 | 0.26 |
| Non-risk items (-R) | 0.85 | 0.83 | 0.91 | 0.52 | 0.91 | 0.90 | 0.12 | 0.008 to 0.22 | 0.01 |
| All items (All) | 0.85 | 0.83 | 0.91 | 0.52 | 0.90 | 0.90 | 0.10 | 0.01 to 0.19 | 0.01 |
Convergent validity
As noted, the measure is designed to tap the difference between clients and change in therapy across the three domains. Failure to correlate with appropriate specific measures would suggest invalidity. Correlations (Table 5) are highest against conceptually close measures, showing convergent validity and that scores do not just reflect common response sets.
Table 5 Correlations with referential measures in clinical samples

| Domain | |||||||
|---|---|---|---|---|---|---|---|
| Measure | n | Well-being | Problems | Functioning | Risk | Non-risk items | All items |
| BDI-I | 251 | 0.77 | 0.78 | 0.78 | 0.59 | 0.84 | 0.85 |
| BDI-II | 29 | 0.79 | 0.74 | 0.78 | 0.32 | 0.83 | 0.81 |
| BAI | 218 | 0.56 | 0.68 | 0.55 | 0.39 | 0.65 | 0.65 |
| BSI | 97 | 0.63 | 0.76 | 0.71 | 0.62 | 0.79 | 0.81 |
| SCL-90-R | 34 | 0.68 | 0.87 | 0.79 | 0.83 | 0.85 | 0.88 |
| GHQ-A | 69 | 0.43 | 0.60 | 0.44 | 0.30 | 0.56 | 0.55 |
| GHQ-B | 69 | 0.55 | 0.61 | 0.57 | 0.30 | 0.64 | 0.64 |
| GHQ | 69 | 0.67 | 0.66 | 0.65 | 0.56 | 0.72 | 0.75 |
| GHQ-C | 69 | 0.60 | 0.52 | 0.60 | 0.44 | 0.62 | 0.63 |
| IIP-32 | 246 | 0.48 | 0.58 | 0.65 | 0.45 | 0.64 | 0.65 |
| GHQ-D | 69 | 0.63 | 0.47 | 0.55 | 0.69 | 0.58 | 0.63 |
The only exception was for the new version of the Beck Depression Inventory (BDI—II; Reference Beck, Steer and BrownBeck et al, 1996), where n gives only low precision (95% CI for ρ =0.51-0.87).
In one site — a university counselling service — clinician ratings of ‘significant risk’ were recorded and 7/40 clients were considered to be at risk. Their risk scores differed statistically significantly and strongly from those of the other 33 clients (mean 1.1-0.3; 95% CI 0.41-1.2, P<0.0005), with no statistically significant differences on the other domains. This supports the allocation of risk items to this domain, as does the high correlation with severe depression on the General Health Questionnaire (GHQ).
Differences between clinical and non-clinical samples
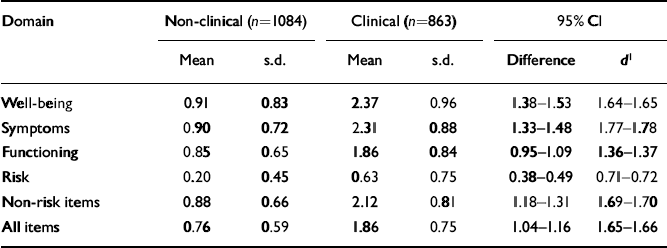
The main validity requirement of an outcome measure is that it should discriminate between the clinical populations for which it has been designed and the non-clinical populations. Table 6 illustrates that these differences were large and highly statistically significant on all domains. Confidence intervals are small, showing that the differences are estimated precisely and are large — more than one point on a 0-4 scale for all domain scores other than risk.
Table 6 Means and standard deviations for clinical and non-clinical samples
| Domain | Non-clinical (n=1084) | Clinical (n=863) | 95% Cl | |||
|---|---|---|---|---|---|---|
| Mean | s.d. | Mean | s.d. | Difference | d 1 | |
| Well-being | 0.91 | 0.83 | 2.37 | 0.96 | 1.38-1.53 | 1.64-1.65 |
| Symptoms | 0.90 | 0.72 | 2.31 | 0.88 | 1.33-1.48 | 1.77-1.78 |
| Functioning | 0.85 | 0.65 | 1.86 | 0.84 | 0.95-1.09 | 1.36-1.37 |
| Risk | 0.20 | 0.45 | 0.63 | 0.75 | 0.38-0.49 | 0.71-0.72 |
| Non-risk items | 0.88 | 0.66 | 2.12 | 0.81 | 1.18-1.31 | 1.69-1.70 |
| All items | 0.76 | 0.59 | 1.86 | 0.75 | 1.04-1.16 | 1.65-1.66 |
The boxplot in Fig. 1 shows a few patients in the clinical sample scoring zero and a very few patients (outliers) in the non-clinical sample scoring very highly. However, the box for the one sample (which covers the middle 50% of scores in each group) and the median line bisecting the box for the other sample do not overlap.
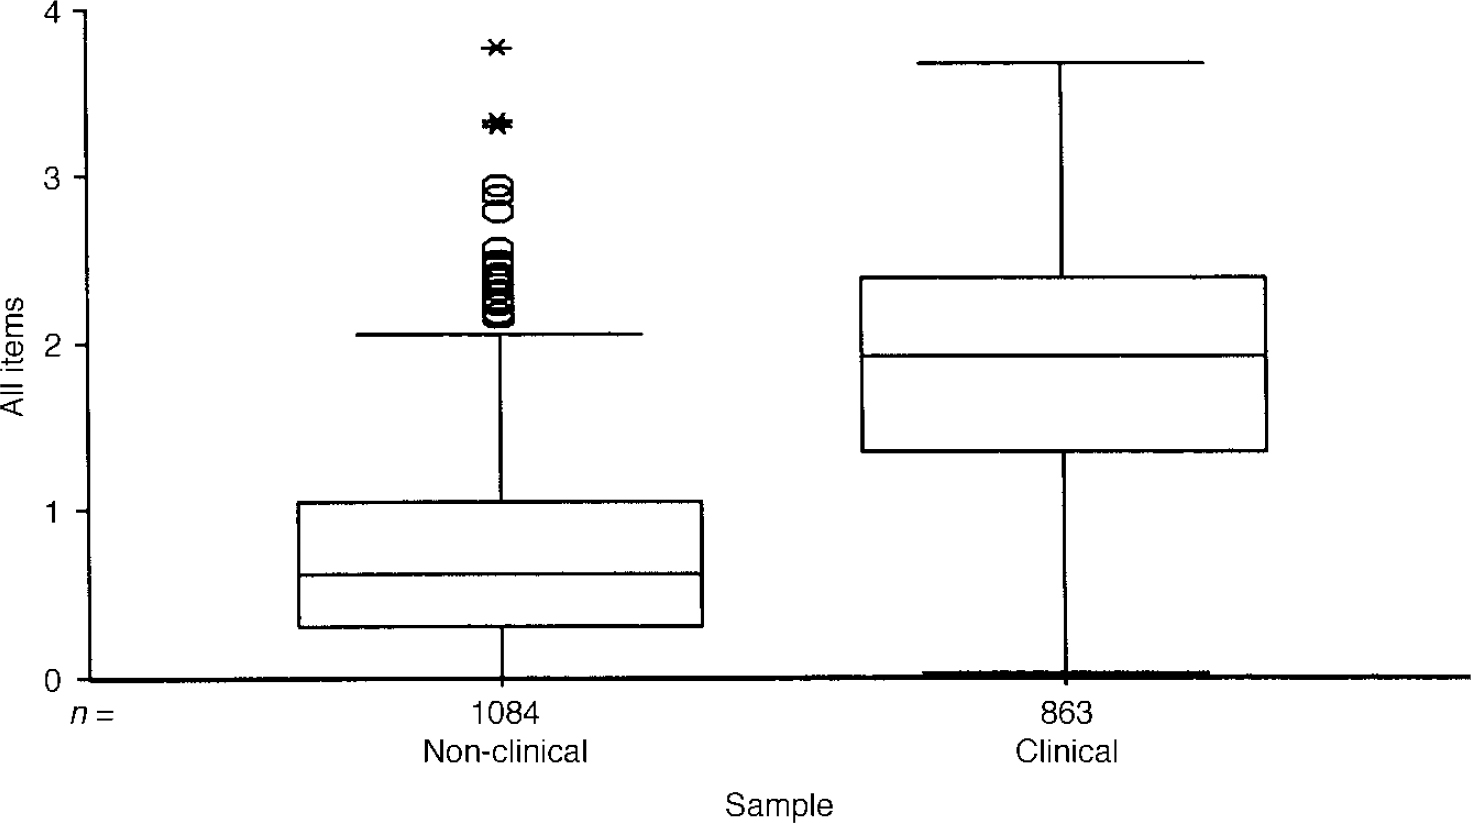
Fig. 1 Boxplot of mean item score for all items for clinical and non-clinical samples. The box encloses the interquartile range (IQR) (i.e. encloses the middle 50% of scores) and the line through the box marks the sample median. ‘Whiskers’ extend below both boxes to the minimum scores and for the clinical sample up to its maximum. The non-clinical sample shows a number of outliers (1.5 × to 3 × the IQR above the 75th centile) and extremes (over 3 × IQR), illustrating the presence of very few, very high scorers in the non-clinical sample.
Ethnicity, age and gender differences
Students were asked whether English was their first language. Because omission of items might reflect linguistic problems with the measure, the number of omitted items was related to the first language. This showed that the 50 respondents who said that their first language was not English omitted an average of 2.5 items, as opposed to 0.35 by the other 607 who answered the language question in that survey. This is statistically significant (P<0.0005) but relatively few items were dropped by either group. Internal consistency was similar for the samples, with no statistically significant differences, suggesting that answering in a second language in these samples did not impair internal consistency.
Analysis showed only small correlations between scores and age. There was a statistically significant but negligible increase in symptom scores with age (ρ=0.076, P=0.014) in the non-clinical sample, and small reductions in risk (ρ=-0.15, P<0.0005) and function scores (ρ=-0.10, P=0.004) with age in the clinical sample.
Many psychological measures show gender differences and much has been written on whether these represent response biases. In the design of the CORE—OM, we sought to minimise gender bias but had no belief in a ‘gender free’ instrument. The results (Table 7) show moderate and statistically significant gender differences in the non-clinical samples for all domain scores except functioning. The differences in the clinical samples were smaller, with statistically significant differences on well-being and, narrowly, on risk. Clearly, gender should be taken into account when relating individual scores to referential data, but the effects of gender are small compared with effects of clinical v. non-clinical status.
Table 7 Gender differences in scores for clinical and non-clinical samples

| Domain | Non-clinical | 95% CI | Clinical | 95% CI | ||||||||
|---|---|---|---|---|---|---|---|---|---|---|---|---|
| Male (n=471) | Female (n=576) | Difference | d 1 | Male (n=338) | Female (n=515) | Difference | d 1 | |||||
| Mean | (s.d.) | Mean | (s.d.) | Mean | (s.d.) | Mean | (s.d.) | |||||
| Well-being | 0.68 | (0.71) | 1.10 | (0.87) | -0.51 to −0.32 | 0.52-0.53 | 2.22 | (0.98) | 2.41 | (0.97) | -0.33 to — 0.06 | 0.19-0.20 |
| Symptoms | 0.78 | (0.64) | 1.00 | (0.76) | -0.30 to −0.13 | 0.30-0.32 | 2.32 | (0.92) | 2.28 | (0.87) | -0.08 to 0.17 | 0.04-0.05 |
| Functioning | 0.83 | (0.62) | 0.86 | (0.67) | -0.11 to 0.05 | 0.04-0.05 | 1.92 | (0.87) | 1.84 | (0.85) | -0.04 to 0.20 | 0.08-0.10 |
| Risk | 0.23 | (0.47) | 0.15 | (0.40) | 0.03 to 0.14 | 0.18-0.19 | 0.69 | (0.75) | 0.61 | (0.77) | -0.02 to 0.19 | 0.10-0.11 |
| Non-risk items | 0.79 | (0.59) | 0.95 | (0.70) | -0.25 to −0.09 | 0.24-0.25 | 2.13 | (0.84) | 2.11 | (0.82) | -0.09 to 0.14 | 0.01-0.03 |
| All items | 0.69 | (0.53) | 0.81 | (0.61) | -0.19 to −0.04 | 0.20-0.22 | 1.88 | (0.78) | 1.85 | (0.77) | 0.07 to 0.14 | 0.03-0.05 |
Correlations between domain scores
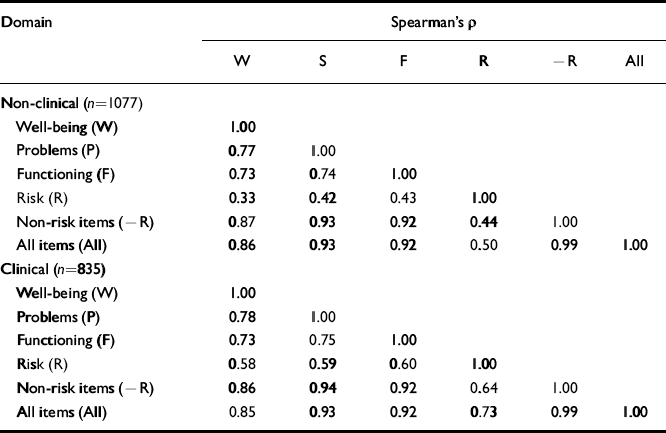
Given the interrelationship between clinical domains, scores were expected to be positively correlated. The correlations in Table 8 show that the risk items show lower correlations with the other scores, more so in the non-clinical than the clinical sample. The three other scores show high correlations with each other.
Table 8 Correlations between Spearman's ρ values for clinical and non-clinical samples
| Domain | Spearman's ρ | |||||
|---|---|---|---|---|---|---|
| W | S | F | R | -R | All | |
| Non-clinical (n=1077) | ||||||
| Well-being (W) | 1.00 | |||||
| Problems (P) | 0.77 | 1.00 | ||||
| Functioning (F) | 0.73 | 0.74 | 1.00 | |||
| Risk (R) | 0.33 | 0.42 | 0.43 | 1.00 | ||
| Non-risk items (-R) | 0.87 | 0.93 | 0.92 | 0.44 | 1.00 | |
| All items (All) | 0.86 | 0.93 | 0.92 | 0.50 | 0.99 | 1.00 |
| Clinical (n=835) | ||||||
| Well-being (W) | 1.00 | |||||
| Problems (P) | 0.78 | 1.00 | ||||
| Functioning (F) | 0.73 | 0.75 | 1.00 | |||
| Risk (R) | 0.58 | 0.59 | 0.60 | 1.00 | ||
| Non-risk items (-R) | 0.86 | 0.94 | 0.92 | 0.64 | 1.00 | |
| All items (All) | 0.85 | 0.93 | 0.92 | 0.73 | 0.99 | 1.00 |
Exploratory principal-component analysis
Principal-component analyses were conducted separately for the clinical and non-clinical samples. The scree plot for the non-clinical sample is shown in Fig. 2. This shows the very large proportion of the variance in the first component (38%) and the suggestion of an ‘elbow’ (i.e. a flatter ‘scree’) thereafter (Reference CattellCattell, 1966), after three components.
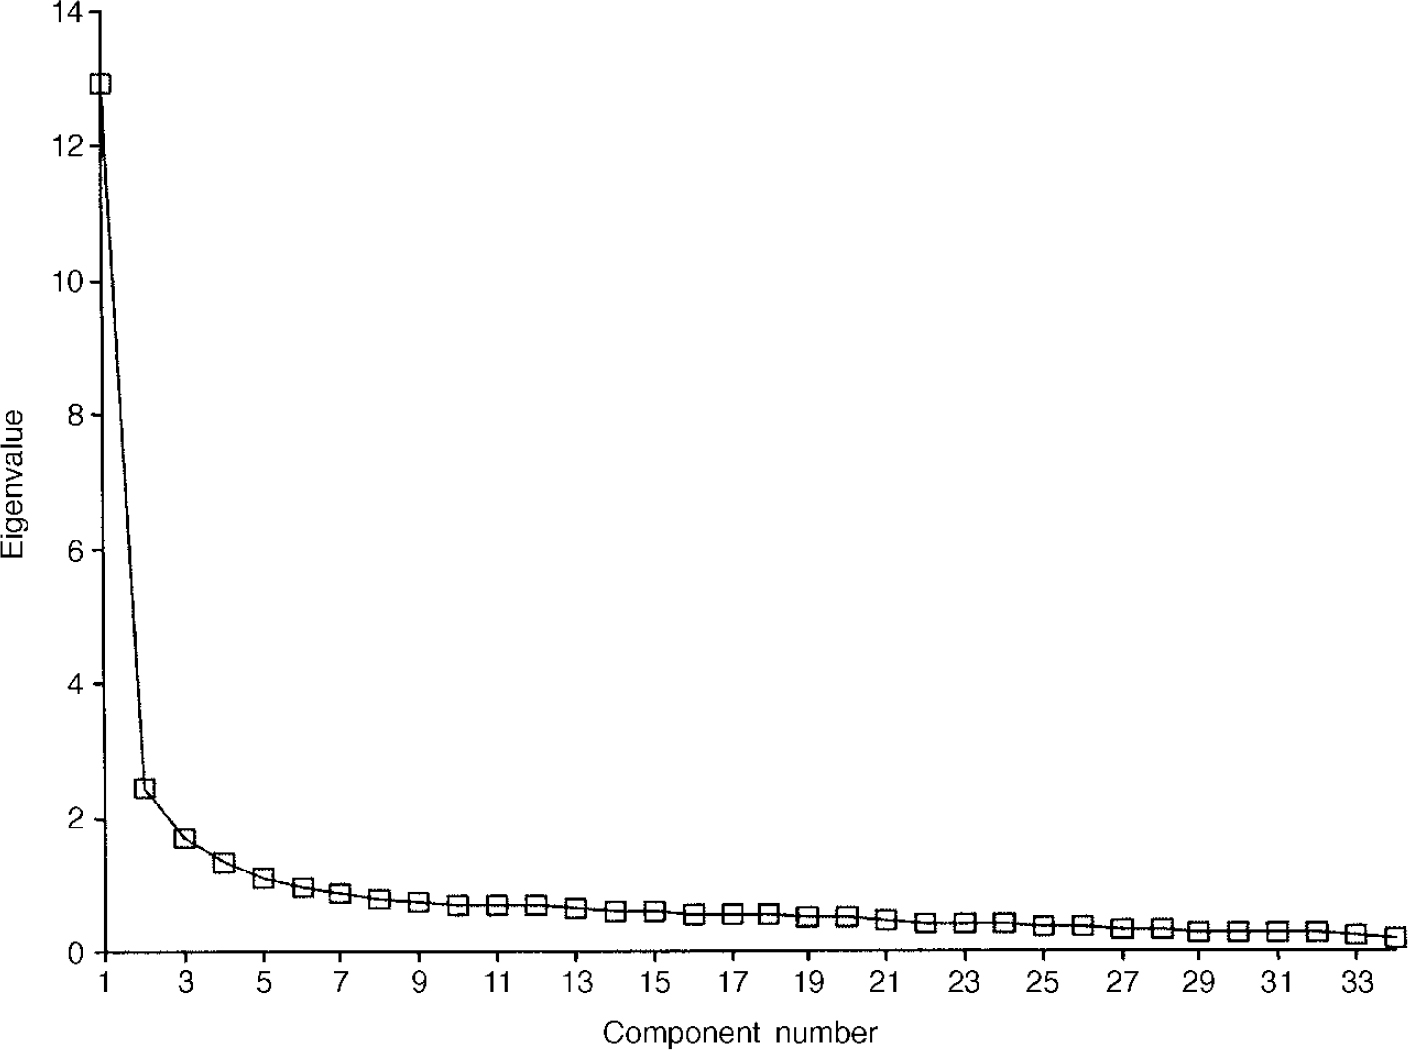
Fig. 2 Scree plot for non-clinical sample (n=1009).
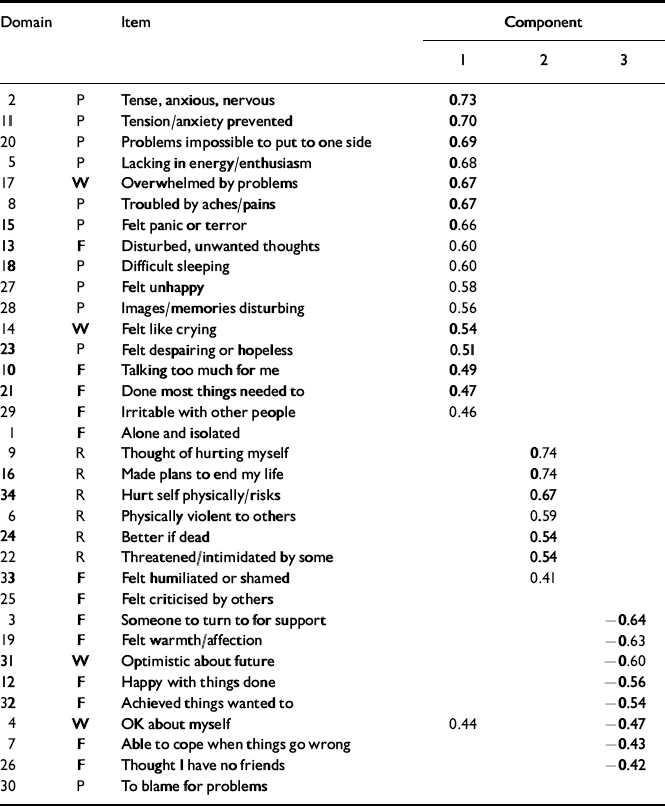
The pattern matrix after oblique rotation (Table 9) shows a clear separation of the items into a negatively worded group, a group made up largely of the risk items and a positively worded group. Figure 3 presents the scree plot for the clinical sample. Again, the pattern matrix suggests three components: a problem one, a risk one and a more positively worded one. However, the solution seems to differ in fine detail from that for the non-clinical sample (Table 10).

Fig. 3 Scree plot for clinical sample (n=713).
Table 9 Pattern matrix for non-clinical sample

| Domain | Item | Component | |||
|---|---|---|---|---|---|
| 1 | 2 | 3 | |||
| 14 | W | Felt like crying | 0.82 | ||
| 27 | P | Felt unhappy | 0.78 | ||
| 17 | W | Overwhelmed by problems | 0.78 | ||
| 23 | P | Felt despairing or hopeless | 0.74 | ||
| 20 | P | Problems impossible to put to one side | 0.73 | ||
| 28 | P | Images/memories disturbing | 0.73 | ||
| 2 | P | Tense, anxious, nervous | 0.73 | ||
| 25 | F | Felt criticised by others | 0.71 | ||
| 13 | F | Disturbed, unwanted thoughts | 0.70 | ||
| 30 | P | To blame for problems | 0.68 | ||
| 1 | F | Alone and isolated | 0.66 | ||
| 11 | P | Tension/anxiety prevented | 0.66 | ||
| 33 | F | Felt humiliated or shamed | 0.65 | ||
| 15 | P | Felt panic or terror | 0.61 | ||
| 29 | F | Irritable with other people | 0.59 | ||
| 26 | F | Thought I have no friends | 0.57 | ||
| 18 | P | Difficulty sleeping | 0.52 | ||
| 10 | F | Talking too much for me | 0.49 | ||
| 5 | P | Lacking in energy/enthusiasm | 0.45 | ||
| 8 | P | Troubled by aches/pains | |||
| 16 | R | Made plans to end my life | 0.72 | ||
| 34 | R | Hurt self physically/risks | 0.66 | ||
| 22 | R | Threatened/intimidated by some | 0.64 | ||
| 6 | R | Physically violent to others | 0.61 | ||
| 24 | R | Better if dead | 0.40 | 0.56 | |
| 9 | R | Thought of hurting myself | 0.56 | ||
| 19 | F | Felt warmth/affection | 0.67 | ||
| 12 | F | Happy with things done | 0.64 | ||
| 32 | F | Achieved things wanted to | 0.61 | ||
| 31 | W | Optimistic about future | 0.60 | ||
| 4 | W | OK about myself | 0.56 | ||
| 3 | F | Someone to turn to for support | 0.53 | ||
| 21 | F | Done most things needed to | 0.52 | ||
| 7 | F | Able to cope when things go wrong | 0.43 | ||
Table 10 Pattern matrix for clinical sample
| Domain | Item | Component | |||
|---|---|---|---|---|---|
| 1 | 2 | 3 | |||
| 2 | P | Tense, anxious, nervous | 0.73 | ||
| 11 | P | Tension/anxiety prevented | 0.70 | ||
| 20 | P | Problems impossible to put to one side | 0.69 | ||
| 5 | P | Lacking in energy/enthusiasm | 0.68 | ||
| 17 | W | Overwhelmed by problems | 0.67 | ||
| 8 | P | Troubled by aches/pains | 0.67 | ||
| 15 | P | Felt panic or terror | 0.66 | ||
| 13 | F | Disturbed, unwanted thoughts | 0.60 | ||
| 18 | P | Difficult sleeping | 0.60 | ||
| 27 | P | Felt unhappy | 0.58 | ||
| 28 | P | Images/memories disturbing | 0.56 | ||
| 14 | W | Felt like crying | 0.54 | ||
| 23 | P | Felt despairing or hopeless | 0.51 | ||
| 10 | F | Talking too much for me | 0.49 | ||
| 21 | F | Done most things needed to | 0.47 | ||
| 29 | F | Irritable with other people | 0.46 | ||
| 1 | F | Alone and isolated | |||
| 9 | R | Thought of hurting myself | 0.74 | ||
| 16 | R | Made plans to end my life | 0.74 | ||
| 34 | R | Hurt self physically/risks | 0.67 | ||
| 6 | R | Physically violent to others | 0.59 | ||
| 24 | R | Better if dead | 0.54 | ||
| 22 | R | Threatened/intimidated by some | 0.54 | ||
| 33 | F | Felt humiliated or shamed | 0.41 | ||
| 25 | F | Felt criticised by others | |||
| 3 | F | Someone to turn to for support | -0.64 | ||
| 19 | F | Felt warmth/affection | -0.63 | ||
| 31 | W | Optimistic about future | -0.60 | ||
| 12 | F | Happy with things done | -0.56 | ||
| 32 | F | Achieved things wanted to | -0.54 | ||
| 4 | W | OK about myself | 0.44 | -0.47 | |
| 7 | F | Able to cope when things go wrong | -0.43 | ||
| 26 | F | Thought I have no friends | -0.42 | ||
| 30 | P | To blame for problems | |||
Sensitivity to change
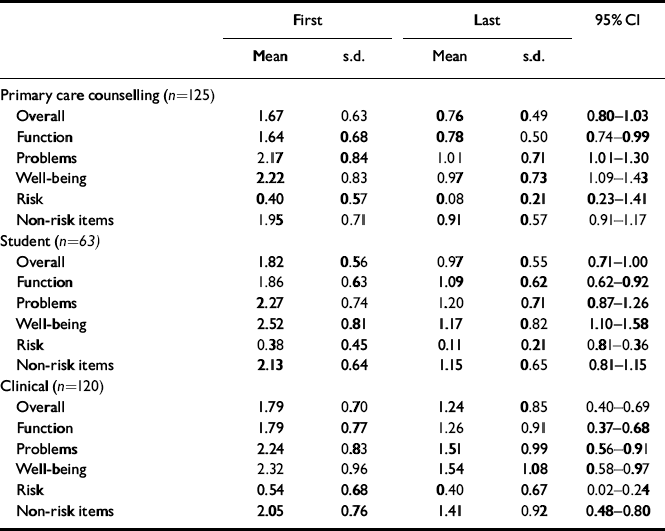
To test for possible differences relating to the nature of problems and to differences in typical numbers of sessions offered, change was considered in relation to three settings: counselling in primary care, student counselling and a ‘clinical’ group comprising NHS psychotherapy and/or counselling services (i.e. the remainder of the overall sample). The results (Table 11) show substantial and highly statistically significant improvements on all scores for all three settings.
Table 11 Grouped change data
| First | Last | 95% Cl | |||
|---|---|---|---|---|---|
| Mean | s.d. | Mean | s.d. | ||
| Primary care counselling (n=125) | |||||
| Overall | 1.67 | 0.63 | 0.76 | 0.49 | 0.80-1.03 |
| Function | 1.64 | 0.68 | 0.78 | 0.50 | 0.74-0.99 |
| Problems | 2.17 | 0.84 | 1.01 | 0.71 | 1.01-1.30 |
| Well-being | 2.22 | 0.83 | 0.97 | 0.73 | 1.09-1.43 |
| Risk | 0.40 | 0.57 | 0.08 | 0.21 | 0.23-1.41 |
| Non-risk items | 1.95 | 0.71 | 0.91 | 0.57 | 0.91-1.17 |
| Student (n=63) | |||||
| Overall | 1.82 | 0.56 | 0.97 | 0.55 | 0.71-1.00 |
| Function | 1.86 | 0.63 | 1.09 | 0.62 | 0.62-0.92 |
| Problems | 2.27 | 0.74 | 1.20 | 0.71 | 0.87-1.26 |
| Well-being | 2.52 | 0.81 | 1.17 | 0.82 | 1.10-1.58 |
| Risk | 0.38 | 0.45 | 0.11 | 0.21 | 0.81-0.36 |
| Non-risk items | 2.13 | 0.64 | 1.15 | 0.65 | 0.81-1.15 |
| Clinical (n=120) | |||||
| Overall | 1.79 | 0.70 | 1.24 | 0.85 | 0.40-0.69 |
| Function | 1.79 | 0.77 | 1.26 | 0.91 | 0.37-0.68 |
| Problems | 2.24 | 0.83 | 1.51 | 0.99 | 0.56-0.91 |
| Well-being | 2.32 | 0.96 | 1.54 | 1.08 | 0.58-0.97 |
| Risk | 0.54 | 0.68 | 0.40 | 0.67 | 0.02-0.24 |
| Non-risk items | 2.05 | 0.76 | 1.41 | 0.92 | 0.48-0.80 |
Reliable and clinically significant change (RCSC)
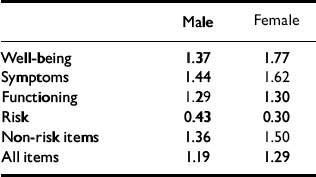
The methods of classifying change as ‘reliable’ and as ‘clinically significant’ address individual change rather than group mean change. Reliable change is that found only in 5% of cases if change were simply due to unreliability of measurement. Clinically significant change is what moves a person from a score more characteristic of a clinical population to a score more characteristic of a non-clinical population (Reference Jacobson and TruaxJacobson & Truax, 1991). The RCSC complements and extends grouped analyses (Reference Evans, Margison and BarkhamEvans et al, 1998). The referential data reported here give the cut-points shown in Table 12.
Table 12 Male and female cut-off scores between clinical and non-clinical populations
| Male | Female | |
|---|---|---|
| Well-being | 1.37 | 1.77 |
| Symptoms | 1.44 | 1.62 |
| Functioning | 1.29 | 1.30 |
| Risk | 0.43 | 0.30 |
| Non-risk items | 1.36 | 1.50 |
| All items | 1.19 | 1.29 |
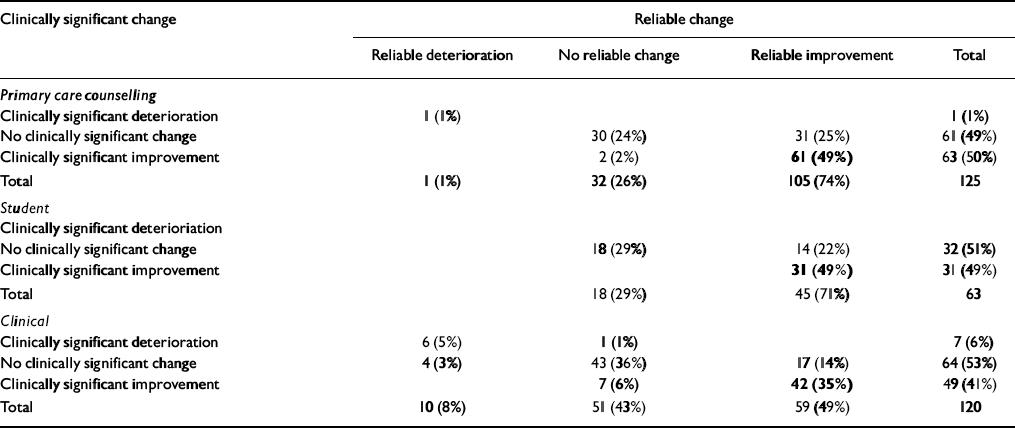
Using those and the coefficient α values of 0.94 to calculate the reliable change criterion allows the change categories to be counted. The three possible categories of reliability of change are: small enough to fall within the range that would be seen by chance alone given reliability (‘not reliable’); reliable improvement; and reliable deterioration. The four categories of clinical significance of change are: stayed in the clinical range; stayed in the non-clinical range; changed from clinical to non-clinical (‘clinically significant improvement’); and changed from the non-clinical to the clinical (‘clinically significant deterioration’). Together, these give the 12 theoretically possible change categories seen in Table 13. Clearly, the ideal outcome is the one shown in bold: reliable and clinically significant improvement. A few patients will score too low on entry into therapy to show clinically significant improvement, whereas some will score highly on entry and improve reliably but not necessarily such that they end below the cut-point to be in the clinically significant improved range.
Table 13 Reliable and clinically significant change
| Clinically significant change | Reliable change | |||
|---|---|---|---|---|
| Reliable deterioration | No reliable change | Reliable improvement | Total | |
| Primary care counselling | ||||
| Clinically significant deterioration | 1 (1%) | 1 (1%) | ||
| No clinically significant change | 30 (24%) | 31 (25%) | 61 (49%) | |
| Clinically significant improvement | 2 (2%) | 61 (49%) | 63 (50%) | |
| Total | 1 (1%) | 32 (26%) | 105 (74%) | 125 |
| Student | ||||
| Clinically significant deterioriation | ||||
| No clinically significant change | 18 (29%) | 14 (22%) | 32 (51%) | |
| Clinically significant improvement | 31 (49%) | 31 (49%) | ||
| Total | 18 (29%) | 45 (71%) | 63 | |
| Clinical | ||||
| Clinically significant deterioration | 6 (5%) | 1 (1%) | 7 (6%) | |
| No clinically significant change | 4 (3%) | 43 (36%) | 17 (14%) | 64 (53%) |
| Clinically significant improvement | 7 (6%) | 42 (35%) | 49 (41%) | |
| Total | 10 (8%) | 51 (43%) | 59 (49%) | 120 |
The majority of patients showed reliable improvement in all three groups. The clinical significance results were less impressive with a slight majority, except in the primary care sample that shows no clinically significant change. Very few showed either clinically significant or reliable deterioration. However, identifying these 19 people of the 281 (7%) who seem to have shown reliable, or clinically significant, deterioration would support case-level audit.
Without knowing more about the clinical services or about the non-response rates, it is premature to interpret either the grouped or the individually categorised change data comparatively. However, they underline that the measure is sensitive to, and can usefully categorise, change in all three settings.
DISCUSSION
This paper has presented the psychometric properties of a specifically developed ‘core’ outcome measure that has been developed through active interaction between researchers, clinician—researchers and pure clinicians. Our discussion focuses on three questions that are central to our original objectives: is the CORE-OM valid, reliable and sensitive to change; is it acceptable and accessible; and does it have wide utility?
Is the CORE-OM reliable, valid and sensitive to change?
The results presented are satisfactory. The CORE-OM and its domain scores show excellent internal consistency in large clinical and non-clinical samples. In addition, it has high 1-week test—retest reliability in a small sample of students. Convergent validation against a battery of existing measures and clinician ratings of risk is good. Gender differences are statistically significant in the non-clinical samples but less so in the clinical samples. Although sufficiently different to require gender-specific referential data, the differences are small enough in relation to the clinical/non-clinical differences to suggest that the measure is not heavily gender-biased. On this evidence, the CORE-OM meets the required standard for acceptable validity and reliability.
The very strong discrimination between clinical and non-clinical samples suggests that the measure is tuned to the distinction between clinical and non-clinical samples. The correlations between the domain scores and the principal-component analysis suggest that item responses across domains are highly correlated, both in clinical and non-clinical samples. A first component accounts for a large proportion of the variance, but a three-component structure that separates problems, risk items and positively scored items may be worthy of further exploration, particularly in relation to the phase model of change in psychotherapy (Reference Howard, Lueger and MalingHoward et al, 1993). Change data from counselling in primary care, student counselling and NHS psychotherapies all suggest that the CORE-OM is sensitive to change and capable of categorising change using the methods of ‘reliable and clinically significant change’.
Is the CORE-OM acceptable and accessible?
The rates of omitted items are such that most scores can be pro-rated and the measure has good acceptability in clinical and non-clinical use. Non-completion rates were not assessed, so the results can be generalised only to the population of clients who are currently willing to complete such measures on the minimal encouragement available when a research project is spliced onto normal clinical practice. Work is now in progress with some sites to gain regular and detailed non-completion information and to explore residual practitioner and patient reluctance.
The non-clinical data-sets provide referential data on score distributions in British populations that are not available for many symptom measures in routine use. Further work is in progress to develop translations into other languages. In addition, two parallel, 18-item, single-sided short forms are available for services wishing to track progress session by session. Data on them will be reported separately.
Does the CORE-OM have wide utility?
The collaboration between practitioners and researchers has produced a reliable, valid and user-friendly core outcome measure that has clinical utility in a range of different settings. It has achieved its design aims. However, the aims went beyond creating ‘another measure’. The first intention was that the CORE-OM constitutes a ‘core’: something onto which other measures can be added (Reference Barkham, Evans and MargisonBarkham et al, 1998), as shown in Fig. 4. The CORE-OM then constitutes a common, available measure to pursue the broader goals of measurement of efficacy and effectiveness in psychological treatments. A report on its usage in one large service is given by Barkham et al (Reference Barkham, Margison and Leach2001). However, to return to Thornicroft & Slade (Reference Thornicroft and Slade2000) for a more general overview:
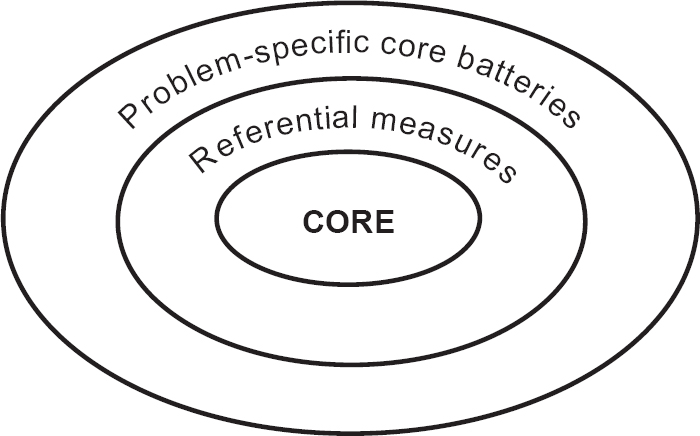
Fig. 4 Relationship between the CORE-OM and other outcome measures.
“Can mental health outcome measures be developed which meet the following three criteria: (1) standardised, (2) acceptable to clinicians, and (3) feasible for ongoing routine use?…
… implementing the routine use of outcome measures is a complex task involving the characteristics of the scales, the motivation and training of staff, and the wider clinical and organisational environment.
… When assessed using these criteria [applicability, acceptability and practicality] it is clear that our current knowledge tells us more about barriers to implementing routine outcome measures than about the necessary and sufficient ingredients for their successful translation into clinically meaningful everyday use.”
We believe that the CORE-OM and the CORE system provide a strong platform to amend their first assessment to ‘yes’, ‘largely’ and ‘generally’ for psychological therapies and we believe that the CORE-OM shows applicability, acceptability and practicality. However, we agree completely that much cultural change, in which practice-based evidence (Reference Margison, Barkham and EvansMargison et al, 2000) must be given equal respect to evidence-based practice, will be needed for “successful translation into clinically meaningful everday use”.
Clinical Implications and Limitations
CLINICAL IMPLICATIONS
-
• The Clinical Outcomes in Routine Evaluation — Outcome Measure (CORE-OM) can be hand-scored for immediate use or scanned by computer to facilitate audit of large clinical populations as part of clinical governance.
-
• The CORE-OM is a reliable and valid instrument to use in clinical audit at the case, therapist or unit levels.
-
• The CORE-OM provides a ‘lowest common denominator’ or ‘common currency’ for assessing clinical effectiveness across models of therapy, complementing theory-specific case formulation and detailed, problem— or resource-specific measures.
LIMITATIONS
-
• The current referential data-set needs to be extended to fully represent populations.
-
• More data on test—retest stability in different populations and over different time intervals are needed.
-
• More data from the instrument in formal efficacy studies is needed to strengthen its use as a bridge between efficacy and routine evaluation.


eLetters
No eLetters have been published for this article.