Admission to hospital remains the most expensive form of psychiatric treatment (Reference Johnstone and ZoleseJohnstone & Zolese, 1999). Changes in the structure of mental health services have enabled multi-disciplinary teams to manage many acute psychiatric disorders without admission (Reference Dean and GadDean & Gad, 1990; Reference Muijen, Marks and ConnellyMuijen et al, 1992) and led to a reduction in the proportion of patients with first-episode psychosis requiring hospitalisation at initial contact (Reference Harrison, Cooper and GancarczykHarrison et al, 1991). Although the majority of those suffering from psychotic disorders still require admission (Reference Castle, Phelan and WesselyCastle et al, 1994; Reference Geddes and KendellGeddes & Kendell, 1995; Reference Mason, Harrison and GlazebrookMason et al, 1996) surprisingly little is known about the timing and predictors of hospitalisation. We assembled a complete and representative cohort of first-episode psychoses in Nottingham (Reference Brewin, Cantwell and DalkinBrewin et al, 1997) and followed them up after 3 years (Reference Singh, Croudace and AminSingh et al, 2000). In this paper we profile the pattern of hospitalisation during the 3 years from first contact, and investigate predictors of admission.
METHOD
Sample
The sample originally comprised 168 consecutive adult patients making first contact with psychiatric services in Nottingham with a first psychotic episode between 1 June 1992 and 31 May 1994. All patients met the criteria defined in the World Health Organization (WHO) Screening Schedule for Psychosis (Reference Jablensky, Sartorius and ErnbergJablensky et al, 1992) and were subsequently assessed using standardised rating instruments, including the Schedule for Clinical Assessment in Neuropsychiatry (SCAN; WHO, 1994) and the Scale for the Assessment of Negative Symptoms (SANS; Reference AndreasenAndreasen, 1982). Where possible, informants were also interviewed and the Personal and Psychiatric History Schedule (PPHS; Reference Jablensky, Sartorius and ErnbergJablensky et al, 1992) was completed for all cases. Consensus diagnoses were made at baseline using ICD-10 (WHO, 1993) with symptoms derived from SCAN and supplemented by other data sources, including case notes and informant interviews. The process has been described by Brewin et al (Reference Brewin, Cantwell and Dalkin1997).
Follow-up procedure
Follow-up assessments took place between 1 June 1995 and 31 May 1997 and occurred in chronological order of initial contact, as close as possible to 3 years after first contact with psychiatric services. Clinical and social outcomes, their methods of assessment and distribution across diagnostic groups have previously been reported by Singh et al (Reference Singh, Croudace and Amin2000).
Briefly, 164 subjects (99%) were traced to residence. Face-to-face interviews were obtained with 135 (81%) and another eight (5%) were interviewed by telephone. Two subjects had died, including one by suicide. Of the direct assessments, 97% were carried out 35-37 months after inclusion in the original cohort, thus ensuring that subjects were homogeneous with respect to time since contact with services.
Outcome measures
Our main outcome measure was time to admission.
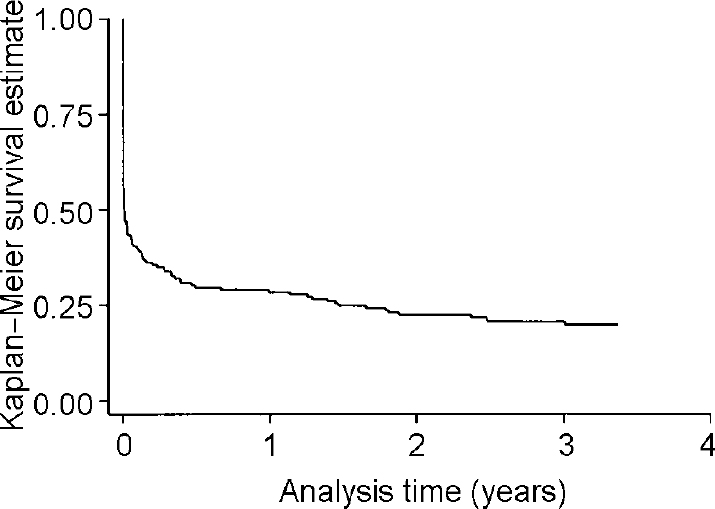
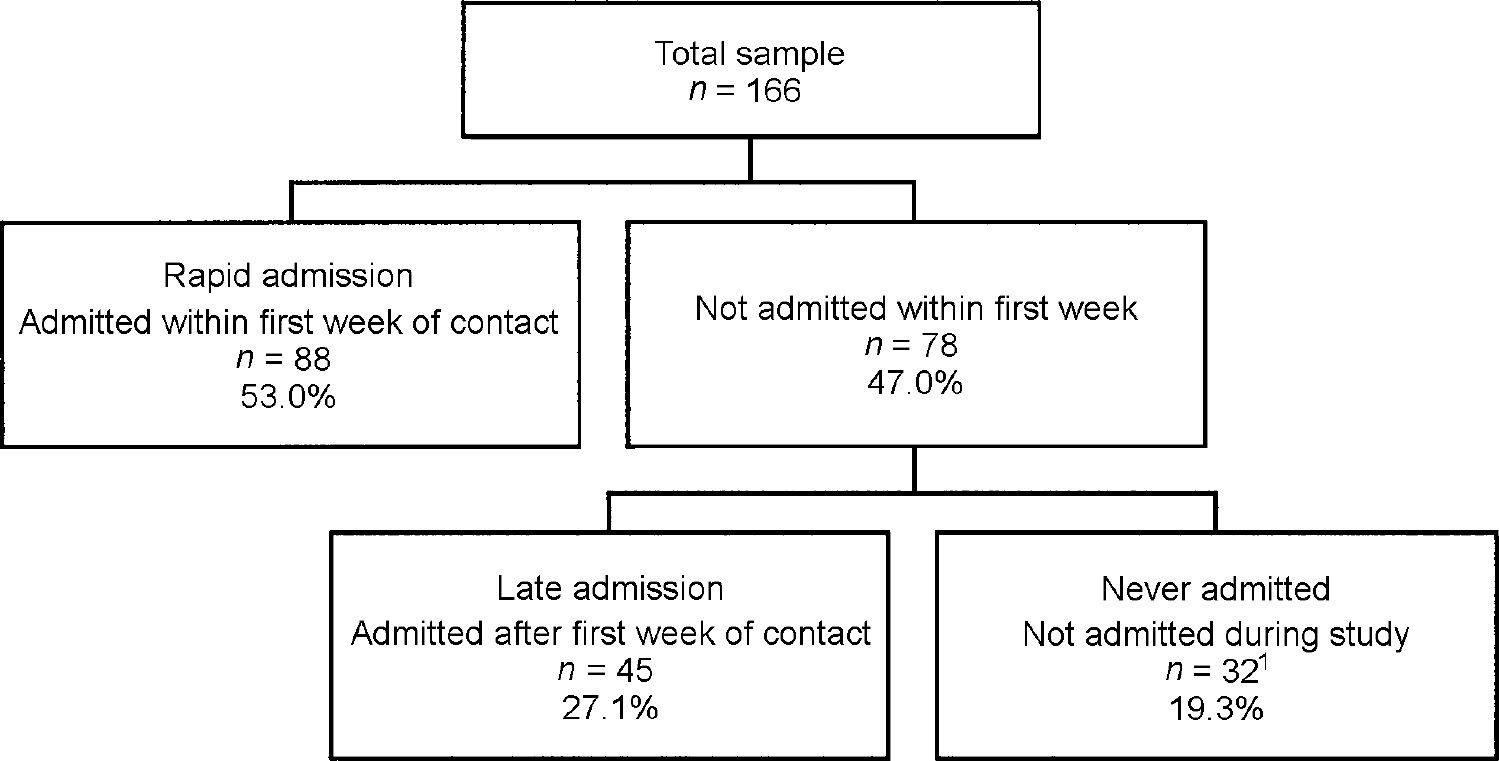
Following graphical analysis of survival times (using the Kaplan-Meier procedure, see Fig. 1), the sample was divided into three subgroups (see Fig. 2):

Fig. 1 Kaplan-Meier survival estimate for time from first contact with services to first admission.

Fig. 2 Subgroups for further analysis. I. One patient lost to follow-up at 2.2 years.
-
(a) ‘rapid admission’ (patients admitted to hospital within 7 days of first contact with services),
-
(b) ‘late admission’ (patients admitted to hospital later than 7 days after first contact with services but within the 3-year follow-up period),
-
(c) ‘never admitted’ (patients who were not admitted during the 3-year follow-up period).
Explanatory variables
Socio-demographic variables
Standard socio-demographic information was available for all patients. Patients were classified as being ‘not married’ if they were neither married nor cohabiting at the time of first contact with services. ‘Unemployed’ was defined as no paid part- or full-time employment. At least one parent of ‘African-Caribbean’ patients had been born in the Caribbean.
History of aggressive incidents
A history of aggressive incidents - defined as aggressive behaviour against persons or property at any time before illness onset - was obtained for all patients in the cohort. Information regarding such incidents was available from the PPHS, psychiatric and general practitioner case notes and in some cases legal reports. A full description of the methodology to obtain these data can be found in Milton et al (Reference Milton, Amin and Singh2001).
Substance misuse
Information regarding alcohol or drug misuse was available from items in the PPHS. Drug misuse was defined as the daily use of illicit substances for a period of at least 2 weeks over the preceding year. Alcohol misuse was defined as daily use for at least 2 weeks in the preceding year, associated with evidence of significant psychological or social harm, or dependence. Patterns of substance misuse for this cohort have been previously described (Reference Cantwell, Brewin and GlazebrookCantwell et al, 1999).
Symptoms
Complete SCAN interviews at first service contact were achieved for 71% of the sample. Where it was not possible to carry out a direct interview with the patient, the Item Group Checklist (IGC) was completed according to SCAN rules, using case notes and any other information available for the patient. Item group (IG) ratings from the checklist were used to compare differences in psychopathology at baseline between those admitted and those not admitted to hospital.
We defined four symptom clusters for further analysis as follows:
-
(a) manic symptoms (two or more positive scores on IG15 ‘heightened subjective functioning’, IG16 ‘rapid subjective tempo’, IG17 ‘expansive mood’, IG18 ‘expansive delusions and hallucinations’, IG19 ‘overactivity’ or IG34 ‘socially embarrassing behaviour’);
-
(b) negative symptoms (two or more positive scores on IG35 ‘flat and incongruous affect’, IG36 ‘poverty of speech’, IG37 ‘non-verbal communication’ or IG38 ‘self-neglect’);
-
(c) depressive symptoms (two or more positive scores on IG10 ‘lowered bodily functioning’, IG11 ‘special features of depressed mood’, IG12 ‘depressed mood’ or IG13 ‘depressed delusions and hallucinations’);
-
(d) core psychotic symptoms (two or more positive scores on IG24 ‘non-affective auditory hallucinations’, IG25 ‘experience of disordered form of thought’, IG26 ‘delusions of control’ or IG27 ‘bizarre delusions and interpretations’).
Each of these four clusters should not, of course, be equated with a specific diagnosis.
Global Assessment of Functioning measures
Global Assessment of Functioning (GAF) scales for symptoms and disability derived from the Global Assessment Scale (Reference Endicott, Spitzer and FleissEndicott et al, 1976) were used to assess global outcomes at 3 years (Reference Singh, Croudace and AminSingh et al, 2000) and were available for 160 patients. The GAF rates the severity of symptoms and disability in the past month with scores from one (most severe) to 90 (no symptoms). Scores of 61 and above are generally taken to represent a favourable outcome (Reference Harrison, Croudace and MasonHarrison et al, 1996). Reliability data for these measures are reported in Singh et al (Reference Singh, Croudace and Amin2000).
Duration of untreated illness
Illness onset was defined as the date of first symptoms or first change in behaviour that was attributable to illness - not necessarily the date of detection of first positive psychotic symptoms. We used the best estimate of the time that elapsed between the date of the first change in symptoms or behaviour attributed to mental illness and the first contact with secondary mental health services. This was based upon both patient and informant reports in the baseline and follow-up assessments.
Data analysis
Fisher's exact, χ2 and Kruskal-Wallis tests were used as appropriate to test for statistically significant differences between subgroups. Factors independently associated with overall risk of admission and risk of rapid admission were identified using logistic regression analysis. Variables associated with admission at a significance level of <0.20 in univariable regression analysis were then entered into a final multivariable model.
All statistical analysis was performed using Stata Release 6.0 (StataCorp, 1999).
RESULTS
Sample
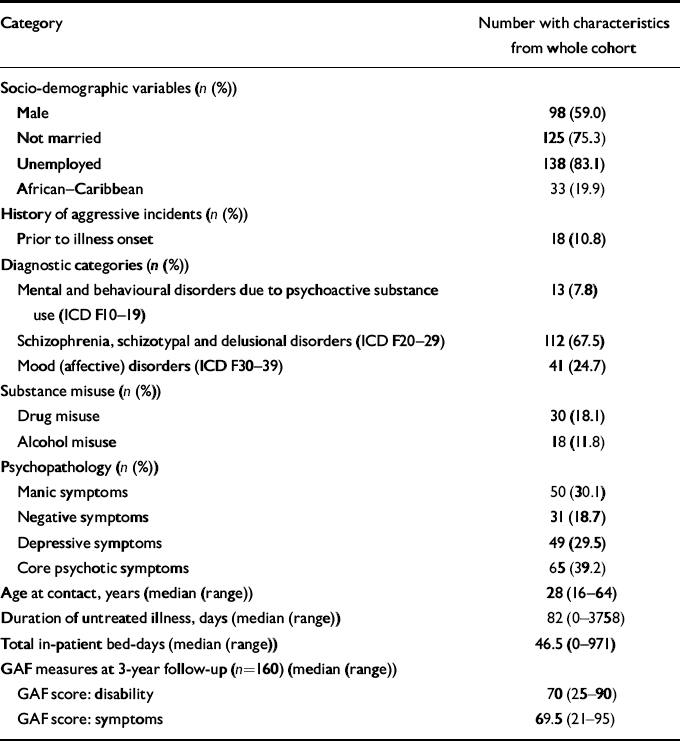
Of the 168 patients who entered the study two had to be excluded. One was found to have an organic psychosis and one withdrew consent for the study. Table 1 describes the sample (n=166) characteristics at baseline.
Table 1 Socio-demographic, diagnostic, psychopathological and other characteristics of the cohort (n=166)

| Category | Number with characteristics from whole cohort |
|---|---|
| Socio-demographic variables (n (%)) | |
| Male | 98 (59.0) |
| Not married | 125 (75.3) |
| Unemployed | 138 (83.1) |
| African-Caribbean | 33 (19.9) |
| History of aggressive incidents (n (%)) | |
| Prior to illness onset | 18 (10.8) |
| Diagnostic categories (n (%)) | |
| Mental and behavioural disorders due to psychoactive substance use (ICD F10-19) | 13 (7.8) |
| Schizophrenia, schizotypal and delusional disorders (ICD F20-29) | 112 (67.5) |
| Mood (affective) disorders (ICD F30-39) | 41 (24.7) |
| Substance misuse (n (%)) | |
| Drug misuse | 30 (18.1) |
| Alcohol misuse | 18 (11.8) |
| Psychopathology (n (%)) | |
| Manic symptoms | 50 (30.1) |
| Negative symptoms | 31 (18.7) |
| Depressive symptoms | 49 (29.5) |
| Core psychotic symptoms | 65 (39.2) |
| Age at contact, years (median (range)) | 28 (16-64) |
| Duration of untreated illness, days (median (range)) | 82 (0-3758) |
| Total in-patient bed-days (median (range)) | 46.5 (0-971) |
| GAF measures at 3-year follow-up (n=160) (median (range)) | |
| GAF score: disability | 70 (25-90) |
| GAF score: symptoms | 69.5 (21-95) |
Of those patients not admitted to hospital only five had follow-up periods of less than 3 years. Four of these patients had been followed up for periods only 13 or fewer days short of 3 years and these four patients were included as never admitted in all analyses. One patient was lost to followup at 2.2 years and this case was excluded from the analysis looking at differences in patient characteristics between subgroups and the logistic regression analysis for factors associated with overall risk of admission. However, we included this case in the logistic regression analysis for factors associated with rapid admission.
Timing of admission
The median time between first contact with services and admission to hospital was 1 day (range 1-1097). Figure 1 displays the Kaplan-Meier survival curve for the risk of admission for patients from the time of their first contact with services.
Frequency and total length of admissions
The median number of admissions was one (range 0-7). The median number of total in-patient bed-days per subject was 46.5 (range 0-971).
Admission rates and subgroups for further analysis
Following the graphical analysis of survival times (Fig. 1), we used 7 days as a cut-off time to distinguish between rapid and late admission. Figure 2 shows the division of the whole sample into three subgroups. One week was judged to be a clinically relevant duration to define rapid admission and was also reasonably near to the median duration of time to admission in this sample. Just over half of the subjects (53.0%, n=88) were admitted rapidly, 27.1% (n=45) were admitted late and 19.3% (n=32) were not admitted at all during the follow-up period of 3 years.
Differences in patient characteristics between subgroups
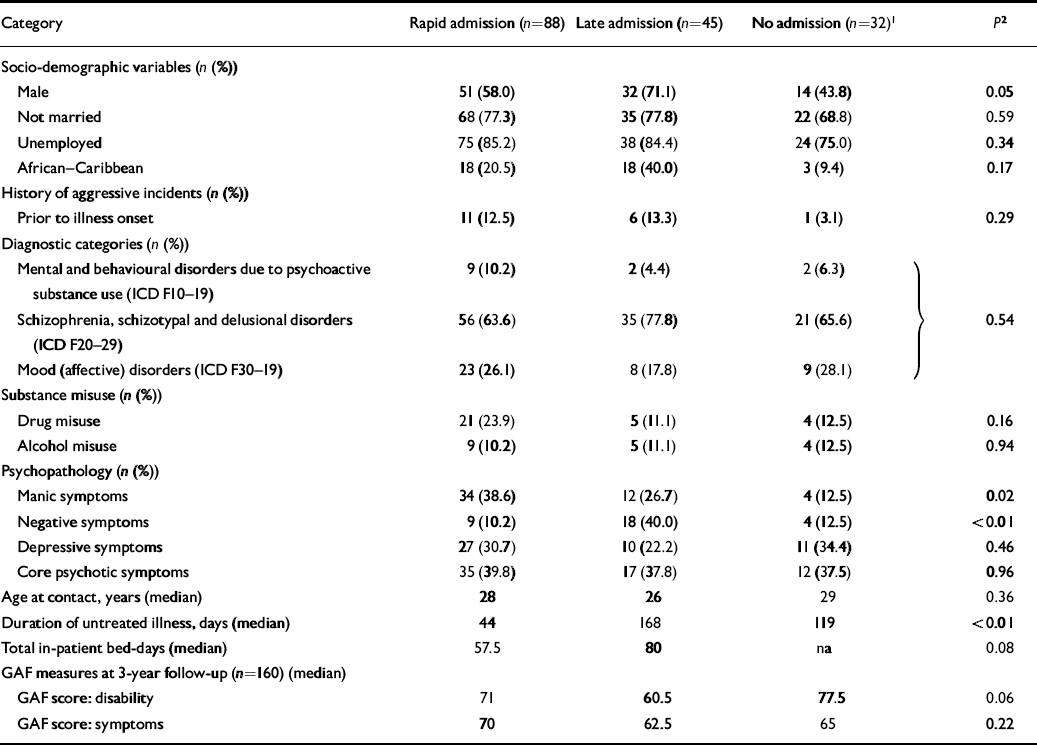
Table 2 compares the characteristics of patients who were admitted rapidly, late or not at all. Significant differences between groups were present for two psychopathological variables: manic symptoms (P=0.02) and negative symptoms (P<0.01). Manic symptoms were more common in the rapid admission group and negative symptoms were more frequent among those with late admissions. The duration of untreated illness was longer in those admitted late (median 168 days v. 44 days in those admitted rapidly and 124 days in those never admitted, P<0.01 for differences between groups). The differences between the three groups approached conventional levels of statistical significance for the proportion of male patients (P=0.05), GAF disability scores (P=0.06) and total bed-days (P=0.08). GAF disability scores were lower, the number of total bed-days and proportions of male patients were higher, in those admitted late.
Table 2 Comparison of socio-demographic, diagnostic, psychopathological and other characteristics in patients admitted rapidly, late or not at all during 3 years of follow-up

| Category | Rapid admission (n=88) | Late admission (n=45) | No admission (n=32)1 | P 2 |
|---|---|---|---|---|
| Socio-demographic variables (n (%)) | ||||
| Male | 51 (58.0) | 32 (71.1) | 14 (43.8) | 0.05 |
| Not married | 68 (77.3) | 35 (77.8) | 22 (68.8) | 0.59 |
| Unemployed | 75 (85.2) | 38 (84.4) | 24 (75.0) | 0.34 |
| African—Caribbean | 18 (20.5) | 18 (40.0) | 3 (9.4) | 0.17 |
| History of aggressive incidents (n (%)) | ||||
| Prior to illness onset | 11 (12.5) | 6 (13.3) | 1 (3.1) | 0.29 |
| Diagnostic categories (n (%)) | ||||
| Mental and behavioural disorders due to psychoactive substance use (ICD F10-19) | 9 (10.2) | 2 (4.4) | 2 (6.3) [UNK] | |
| Schizophrenia, schizotypal and delusional disorders (ICD F20-29) | 56 (63.6) | 35 (77.8) | 21 (65.6) [UNK] | 0.54 |
| Mood (affective) disorders (ICD F30-19) | 23 (26.1) | 8 (17.8) | 9 (28.1) [UNK] | |
| Substance misuse (n (%)) | ||||
| Drug misuse | 21 (23.9) | 5 (11.1) | 4 (12.5) | 0.16 |
| Alcohol misuse | 9 (10.2) | 5 (11.1) | 4 (12.5) | 0.94 |
| Psychopathology (n (%)) | ||||
| Manic symptoms | 34 (38.6) | 12 (26.7) | 4 (12.5) | 0.02 |
| Negative symptoms | 9 (10.2) | 18 (40.0) | 4 (12.5) | <0.01 |
| Depressive symptoms | 27 (30.7) | 10 (22.2) | 11 (34.4) | 0.46 |
| Core psychotic symptoms | 35 (39.8) | 17 (37.8) | 12 (37.5) | 0.96 |
| Age at contact, years (median) | 28 | 26 | 29 | 0.36 |
| Duration of untreated illness, days (median) | 44 | 168 | 119 | <0.01 |
| Total in-patient bed-days (median) | 57.5 | 80 | na | 0.08 |
| GAF measures at 3-year follow-up (n=160) (median) | ||||
| GAF score: disability | 71 | 60.5 | 77.5 | 0.06 |
| GAF score: symptoms | 70 | 62.5 | 65 | 0.22 |
Factors associated with risk of rapid admission
In univariable analyses manic symptoms (odds ratio 2.44, 95% CI 1.21-4.90) and drug misuse (odds ratio 2.41, 95% CI 1.02-5.69) were associated with an increased risk of rapid admission. Negative symptoms (odds ratio 0.29, 95% CI 0.12-0.68) and duration of untreated illness of more than 6 months (odds ratio 0.32, 95% CI 0.16-0.63) were associated with a reduced likelihood of rapid admission. In the multivariable analysis manic symptoms (odds ratio 2.16, 95% CI 1.02-4.60) remained independently associated with increased risk, and negative symptoms (odds ratio 0.37, 95% CI 0.15-0.94) with decreased risk of rapid admission. Associations with drug misuse (odds ratio 2.16, 95% CI 0.86-5.42) and duration of untreated illness longer than 6 months (odds ratio 0.53, 95% CI 0.25-1.14) were attenuated.
Factors associated with overall risk of admission
In the univariable analyses manic symptoms at first presentation were associated with over a three-fold increased likelihood of admission (odds ratio 3.70, 95% CI 1.22-11.20). This effect remained significant (odds ratio 3.67, 95% CI 1.19-11.32) after controlling for gender, marital status and ethnicity in multivariable analysis.
DISCUSSION
Main findings
We have assessed patterns of admission in a consecutive series of first-episode psychoses from a geographically defined population during the first 3 years following their initial contact with services.
The Kaplan-Meier survival curve for the risk of admission for patients from the time of their first contact with services (Fig. 1) suggests that patient admissions to hospital occurred in two phases. Just over half of all patients (53.0%) were admitted within the first week of contact with services and a further 27.1% were admitted at a slower rate over the next 3 years.
The comparison of characteristics of patients with rapid, late and no admissions revealed important differences. Patients admitted late were more likely to have presented with negative symptoms and a longer duration of untreated illness. Other findings in this group only approached conventional levels of statistical significance, but viewed together could be pointing towards a clinically important patient group characterised by higher proportions of males, lower GAF scores (indicating a worse functional outcome at 3 years) and higher numbers of total inpatient bed-days over the 3-year follow-up (see Table 2).
Multivariable logistic regression analyses showed that manic symptoms at presentation were associated with an increased overall risk of admission and an increased risk of rapid admission while negative symptoms were associated with a lower risk of rapid admission.
Strengths and weaknesses of the study
A clear strength of this study is the high quality of data obtained on the studied sample: case ascertainment and assessment of the inception cohort was almost complete and comprehensive. A high proportion of face-to-face interviews at baseline and follow-up was achieved; standardised assessment tools with high interrater reliability and operationalised criteria for diagnosis were used throughout.
The relatively small sample size, however, limited the statistical power of this analysis and clinically important associations may not have been detected.
In addition, these data are based upon only one particular service model (albeit a homogeneous and by the time of this study already well-established model) limiting external validity. However, these data could form the basis of a meaningful comparison of patterns of hospitalisation across different models of service delivery.
Comparison of findings with other research
Previous studies reported high admission rates for patients with psychotic disorders at first contact with psychiatric services. Eighty per cent of patients with a diagnosis of schizophrenia on the Camberwell Diagnostic Register were admitted at first contact (Reference Castle, Phelan and WesselyCastle et al, 1994) and 73% within 90 days of first contact (compared with 65.1% in our sample) in a sample in Edinburgh (Reference Geddes and KendellGeddes et al, 1995). The low admission rate at first contact of 53.0% in this Nottingham cohort of first-episode psychoses is in keeping with the substantial decline of first-admission rates from around 80% in 1975 to under 50% by 1986, as reported by Harrison et al (Reference Harrison, Cooper and Gancarczyk1991). This low rate reflects a shift towards more community-oriented treatment strategies for patients with psychosis in Nottingham. However, in the present study, at the end of the 3-year follow-up period, the proportion of patients admitted to hospital had risen to 80.7%, with only 32 patients avoiding admission completely. Overall admission rates remained high therefore, and it is clear that in-patient admission remains a key component of care for the majority of first-episode cases, at least in a community service based upon conventional community mental health teams.
Castle et al (Reference Castle, Phelan and Wessely1994) found ‘bizarre behaviour’ and ‘grandiose delusions’ to be predictors of admission in their sample and these concepts probably capture similar psychopathological features as our manic symptoms variable. In contrast to our findings Castle et al (Reference Castle, Phelan and Wessely1994) reported a history of juvenile delinquency or adult criminality to be less common among those admitted to hospital. Geddes & Kendell (Reference Geddes and Kendell1995), however, described a significant association between aggression or violence and admission.
Future research
Further studies of patterns of in-patient service utilisation in different service settings are required. These studies should especially focus on the potential association between late initial admission and less favourable functional outcome at follow-up. Randomised controlled trials are required to investigate whether earlier admission of this vulnerable group of patients affects outcome.
Clinical Implications and Limitations
CLINICAL IMPLICATIONS
-
▪ Manic symptoms are associated with rapid admission and negative symptoms with late admission during the early course of psychosis.
-
▪ Community-oriented psychiatric services might only delay, rather than prevent, admission of patients with predominantly negative symptoms and a longer duration of untreated illness.
-
▪ First-episode studies based upon admissions close to first contact with psychiatric services are likely to be subject to selection biases, thus limiting their representativeness.
LIMITATIONS
-
▪ The relatively small sample size limited the statistical power of this analysis. Clinically important associations may not have been detected.
-
▪ These data are based upon only one service model and may have limited generalisability.
-
▪ Data on psychopathology were only collected at initial contact with services; changes in psychopathology during follow-up were not documented.
ACKNOWLEDGEMENT
We thank John Milton for providing the data on the history of aggressive incidents in this cohort.


eLetters
No eLetters have been published for this article.