


Food environments digitalisation is creating new forms to acquire foods using digital technology(Reference Granheim, Løvhaug and Terragni1). The influences of the digital food environment in conjunction with those from the physical food environments model individuals’ food choices(Reference Granheim, Løvhaug and Terragni1,2) . Therefore, the digital food environments should also be considered as an important topic in the public health field, specially in food policy formulation and research(Reference Duthie, Pocock and Curl3).
Meal delivery apps (MDA) are popular meal-shopping channels within the digital food environments that connect consumers with food retailers(4). By downloading the app or accessing the company’s website, consumers can choose a meal, place their order, follow its preparation and receive it without travelling(4). It is a convenient and practical way to eat, which allows access to a wide variety of establishments and types of food using a device connected to the Internet(4).
When using an MDA, consumers can search using keywords that define the type of cuisine (e.g. ‘Brazilian’), the type of meal (e.g. ‘Meat and fish’) and the occasion for consumption (e.g. ‘Breakfast’)(Reference Poelman, Thornton and Zenk5). The user can also access a list of the most popular or nearest establishments and choose their meal by the terms that characterise each establishment. Marketing strategies, such as illustrative photos and advertisements of meals with discounts or without delivery charges, are frequent in MDA(Reference Jia, Raeside and Redfern6–Reference Botelho, Freitas and Camara11) and improve the user experience on the platform and influence the user’s decision to purchase(2). Due to the characteristics of convenience and practicality, the use of MDA has grown. Worldwide, the projected revenue for this sector is US$ 130·2 billion in 2022(12). In Latin America (LA), in 2020 and 2021, the online food delivery market grew by over 20·0 %, reaching US$ 5·4 billion(13).
The frequent use of MDA is critical from a public health perspective due to the widespread promotional supply of foods and meals of poor nutritional quality(Reference Halloran, Faiz and Chatterjee14). This evidence comes primarily from developed countries, such as Australia, New Zealand, Canada, the USA and the Netherlands(Reference Poelman, Thornton and Zenk5,Reference Mahawar, Jia and Korai7,Reference Wang, Korai and Jia15–Reference Brar and Minaker17) , and such evidence from undeveloped or developing countries is scarce. In LA, for example, data on food offerings on MDA are available from only one city in Brazil, with approximately 70 % of online menus advertising sandwiches, fried snacks and pizza. In contrast, offerings of traditional meals and dishes predominantly composed of vegetables account for only 30 % of ads(Reference Horta, Souza and Rocha8).
The minimal availability of scientific evidence on the online meal market in the LA region is an obstacle to understanding how the digital food environments can influence health and nutrition outcomes in this population. Obesity prevalence in LA adults is estimated at 24 %, higher than the world average of 13·1 %(18). Therefore, the objective of the present study was to characterise the food establishments in an MDA operating in LA cities according to the keywords used for their description and marketing strategies.
Methods
Presentation of the study
This is an exploratory study that characterised the profile of establishments registered in an MDA in the nine LA cities in which the company operated in October 2020: Buenos Aires (Argentina), São Paulo (Brazil), Santiago de Chile (Chile), Bogotá (Colombia), San José (Costa Rica), Quito (Ecuador), Mexico City (Mexico), Lima (Peru) and Montevideo (Uruguay). These cities were also described based on the number of inhabitants according to data present on the most recent census of each country: Bogotá (2005), Lima (2007), Buenos Aires (2010), São Paulo (2010), Quito (2010), Mexico City (2010), Montevideo (2011), San José (2011) and Santiago de Chile (2017) (https://celade.cepal.org/bdcelade/depualc/).
The MDA investigated here is a Colombian startup founded in August 2015. In July 2021, the company was valued at US$5·2 billion and showed 420 % growth in its market value from 2018 to 2021(19). Ready-to-eat meal delivery services represent the leading order option for this MDA, although the platform also offers e-commerce services for supermarkets and pharmacies.
Data collection
The list of establishments registered with the MDA in each city was obtained by checking whether it was possible to place a meal order at an address pre-established by the platform. This consultation was performed on 1 October 2020 between 19.00 and 21.00 h. All establishments that had the status ‘available’ for delivery, regardless of whether they were open at the time of data collection, were selected. Only the establishments with ‘unavailable’ status, that is, those that were not available for purchase at any time, were excluded. The sample consisted of 3339 establishments in the nine cities evaluated.
The establishments were characterised based on the keywords they used to introduce themselves to consumers according to the methodology adopted by Poelman et al. (Reference Poelman, Thornton and Zenk5) The most frequent terms were included in the study (80 % of the sample), later grouped into six categories: ‘Typical cuisine’, ‘Meats and fish’, ‘Snacks’, ‘Breakfast’, ‘Desserts’ and ‘Healthy’. This grouping was performed without distinguishing plural and singular (e.g. the keywords ‘Pizzas’ and ‘Pizza’ were grouped in the same way) and by joining keywords with the same meaning in different languages (e.g. ‘Helados’ and ‘Sorbets’ were grouped in the same category; Table 1). Examples of establishments that were classified in each group of keywords in the nine cities can be accessed in the online Supplementary Material.
Table 1. Grouping of the keywords that characterise the establishments in the meal delivery app (MDA), 2020
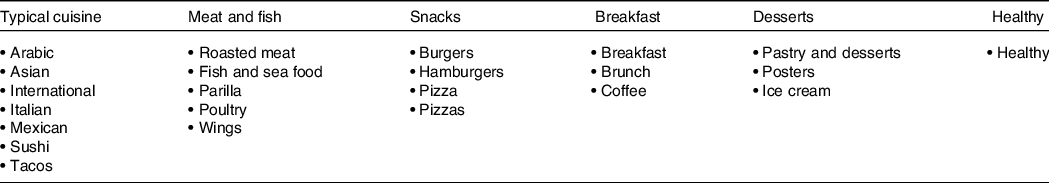
Grouping was made only with the keywords representing 80 % of the terms most used by the establishments to characterise themselves. All the terms were originally written in Portuguese or Spanish in the app and were translated to English.
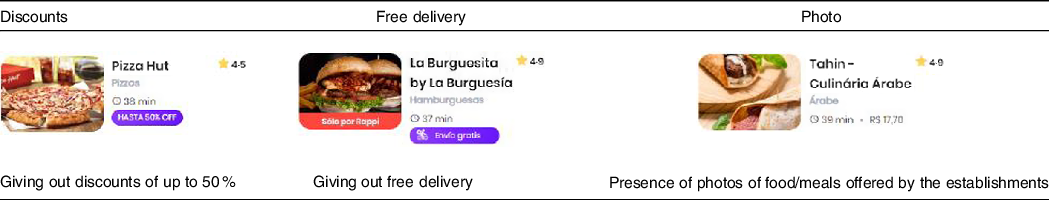
We also collected the marketing strategies discounts, free delivery and the presence of food/meal photos used by establishments to attract consumers (Table 2). These strategies are the most commonly investigated in studies that evaluated MDA(Reference Horta, Souza and Rocha8–Reference Horta, Souza and Mendes10,Reference Wang, Korai and Jia15) .
Table 2. Marketing strategies used to promote food/meal by the establishments in the meal delivery app, 2020
Statistical analysis
Descriptive analyses (absolute and relative frequency) were used to estimate the distribution of establishments by cities, keyword categories and marketing strategies. In addition, Pearson’s correlation test was used to correlate the number of establishments and the number of inhabitants in the cities. Data were tabulated in a Microsoft Excel spreadsheet and statistically analysed in Stata software version 14.0.
Results
The number of establishments available for meal delivery during data collection varied between cities. Mexico City had the highest number of establishments (n 773), followed by Bogotá (n 655), Buenos Aires (n 567) and São Paulo (n 454). San Jose (n 94) and Montevideo (n 80) were the cities that presented the lowest availability of establishments on the platform. The most populated city in the sample is São Paulo (11 152 968), followed by Mexico City (8 743 871), Lima (7 624 568) and Bogotá (7 276 320). A moderate correlation (r = 0·6288) was observed between the number of establishments and inhabitants in LA cities (Table 3).
Table 3. Availability of establishments in the meal delivery app and number of inhabitants in Latin American cities, 2020
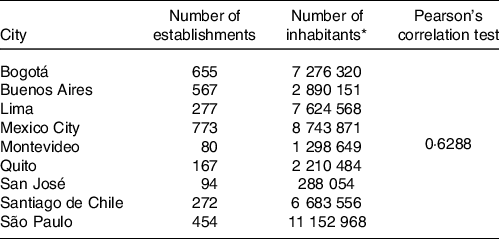
* Number of inhabitants based on the most recent census of each country: Bogotá (2005), Lima (2007), Buenos Aires (2010), São Paulo (2010), Quito (2010), Mexico City (2010), Montevideo (2011), San José (2011) and Santiago de Chile (2017). This information can be accessed in https://celade.cepal.org/bdcelade/depualc/.
Keywords referring to ‘Snacks’ were the most used by establishments in five cities: Montevideo (45·0 %), Sao Paulo (32·6 %), Buenos Aires (31·8 %), Lima (26·7 %) and Bogota (24·9 %). Terms related to ‘Typical cuisine’ were the most frequent in the characterisation of establishments in Mexico City (51·0 %) and Santiago de Chile (36·0 %). Only the establishments in the cities of Quito (38·3 %) and San Jose (26·6 %) had ‘Meat and fish’ as the most frequent group of keywords in their description, while no establishment in the city of São Paulo presented itself this way. The keywords ‘Desserts’, ‘Breakfast’ and ‘Healthy’ were used by less than 20 % of the establishments in the evaluated cities, and the last two groups were the least frequent in the samples of four of the nine cities evaluated: Buenos Aires (2·7 %; 4·8 %), San Jose (1·1 %; 7·5 %), Santiago de Chile (5·5 %; 4·4 %) and Quito (4·2 %; 2·4 %), respectively (Fig. 1).
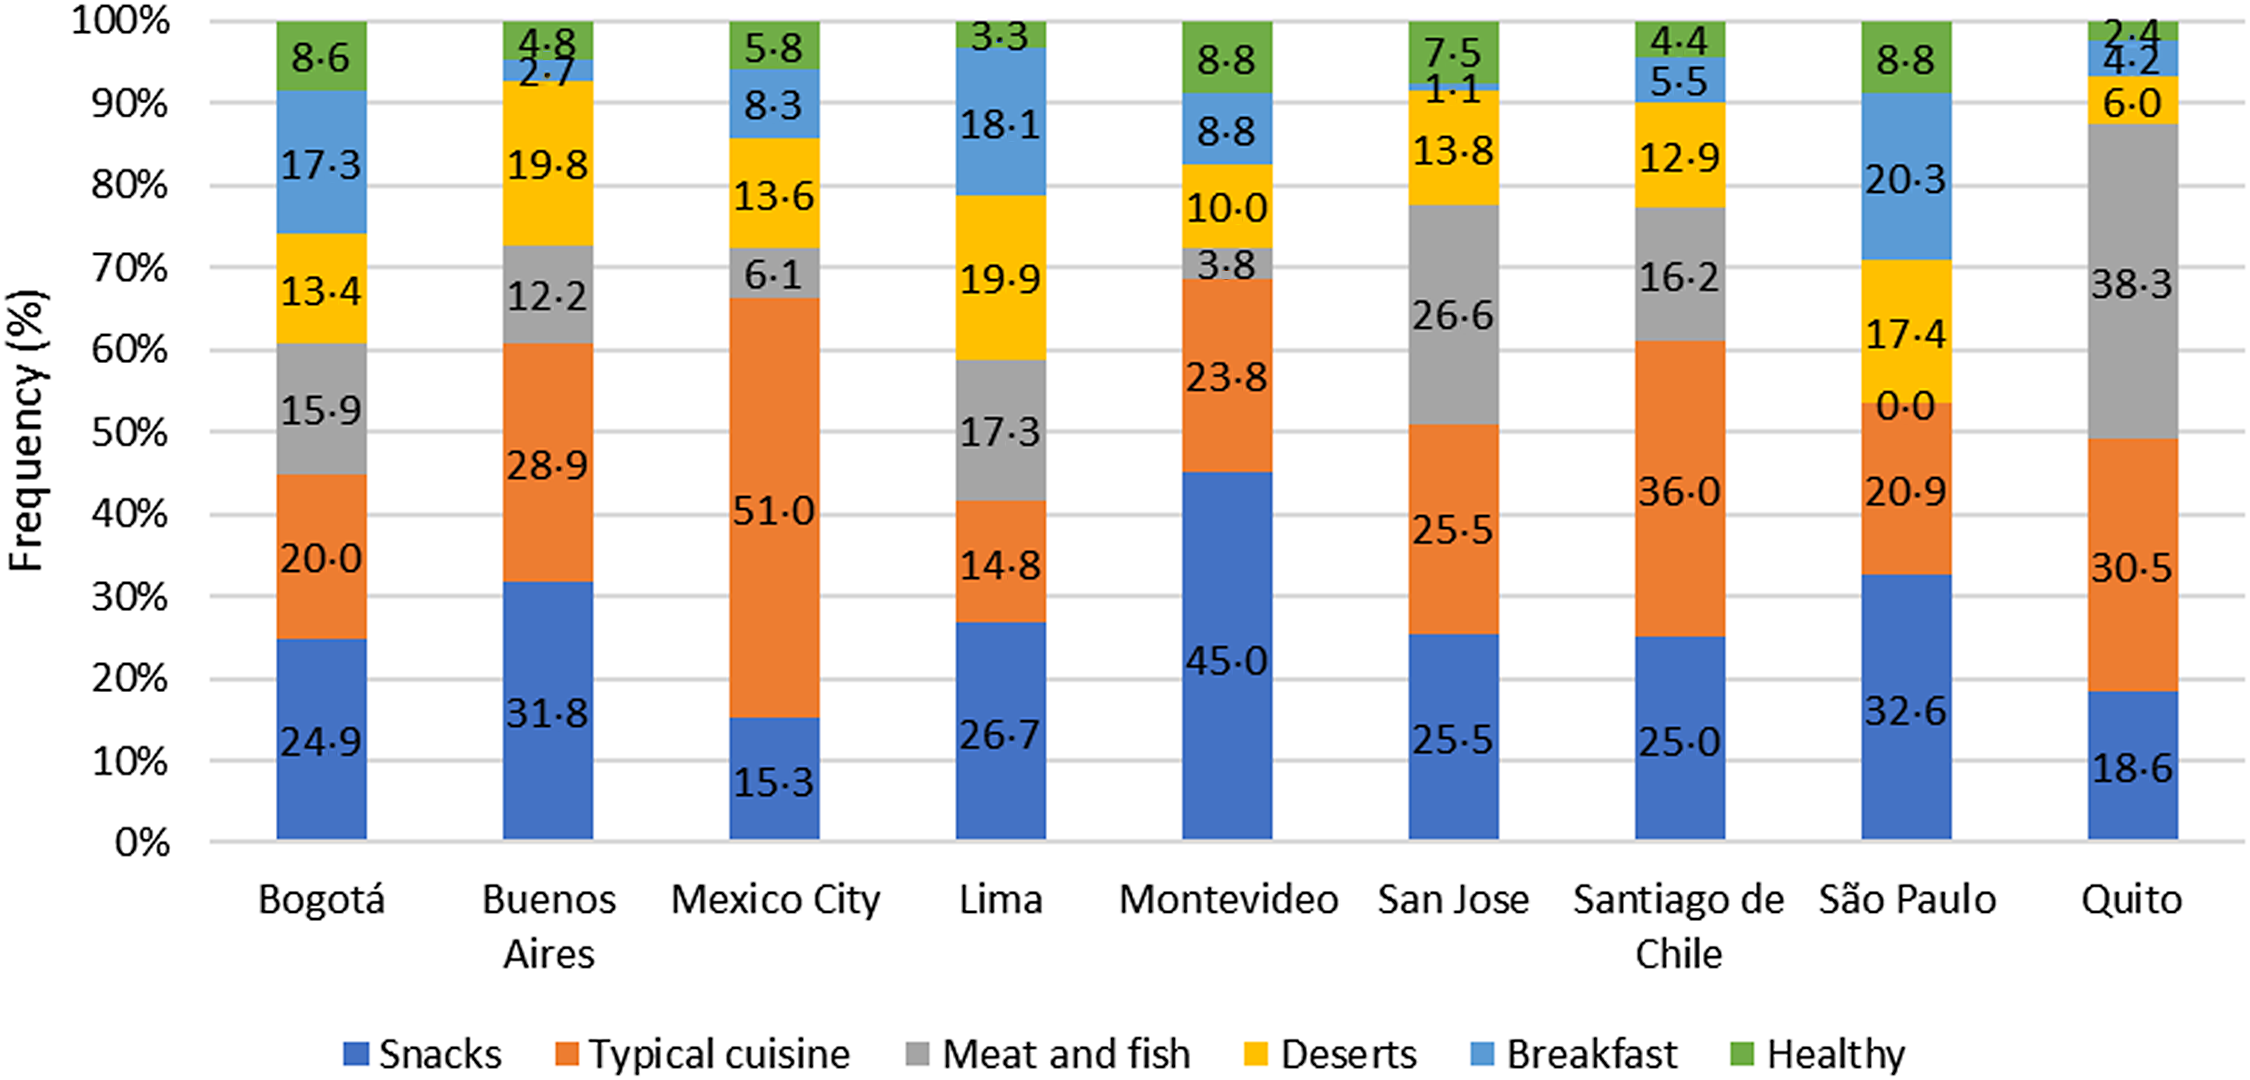
Fig. 1. Frequency of keywords used by establishments in the meal delivery app (MDA) in Latin American cities, 2020.
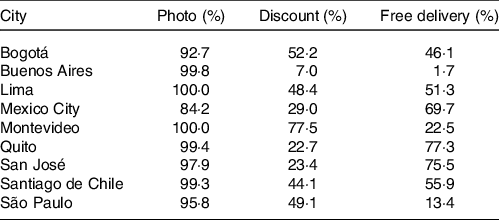
As for the marketing strategies used in the presentation of the establishments, photos were the most frequent, assuming values equal to 84·2 % in the Mexico City sample and higher than 90 % in the other cities. Discounts were noted in the presentation of 77·5 % of establishments in Montevideo, followed by establishments in Bogotá (52·2 %), São Paulo (49·1 %), Lima (48·4 %) and Santiago de Chile (44·1 %). For the other cities, the frequency of the use of discounts by establishments was less than 30·0 %. The frequency of establishments offering free delivery was highest in Quito (77·3 %), San José (75·5 %) and Mexico City (69·7 %), followed by establishments in Santiago de Chile (55·9 %), Lima (51·3 %) and Bogotá (46·1 %). Less than 20·0 % of establishments in the remaining cities advertised this strategy (Table 4).
Table 4. Frequency of marketing strategies offered by establishments in the meal delivery app in Latin American cities, 2020
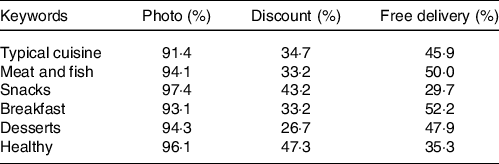
Keywords were also described in terms of the marketing strategies. Photos were used by at least 90 % of the establishments independently of the keywords. Discounts were used similarly among the establishments classified by the keywords ‘Breakfast’ (33·2 %), ‘Meat and fish’ (33·2 %) and ‘Typical cuisine’ (34·7 %). However, establishments defined as ‘Desserts’ (26·7 %) had lower percentage of discounts while those classified as ‘Snacks’ (43·2 %) and ‘Healthy’ (47·3 %) had higher percentages. Establishments classified as ‘Snacks’ (29·7 %) and ‘Healthy’ (35·3 %) also varied among the others (above 45 %) in terms of the use of free delivery (Table 5).
Table 5. Frequency of marketing strategies offered by establishments in the meal delivery app in Latin American cities stratified by groups of keywords, 2020
Discussion
Wide availability of establishments registered with the MDA was found in Mexico City, Bogotá, Buenos Aires and São Paulo, as opposed to San Jose and Montevideo. The use of keywords characterising the establishments also differed among the cities evaluated. While terms related to ‘Snacks’ were the most common in most establishments and those related to ‘Desserts’, ‘Breakfast’ and ‘Healthy’ were the least common, establishments in two of the nine cities more prevalently used the keyword groups ‘Typical cuisine’ and ‘Meats and fish’. Regarding the marketing strategies, photos of foods/meals offered by the establishments were the most common in all cities and in all groups of keywords. Some differences were found on the use of the strategies of free delivery and discounts among the cities and the groups of keywords.
MDA can be considered a dimension of the retail food environment within the digital landscape. Descriptive studies of the community food environment in LA consistently showed higher availability of healthy foods in more affluent neighbourhoods although there were mixed results regarding the availability of unhealthy foods in more disadvantaged areas. However, evidence comes mainly by studies carried out in Brazil and Mexico and do not represent the entire region(Reference Pérez-Ferrer, Auchincloss and Menezes20). Given the particularities between the physical and the digital food environments and the lack of evidence of the retail food environment characteristics in the region, our discussion is limited to an initial reflection on the environment of the MDA in LA and is not intended to explain the reasons for the differences noted between cities. In other words, the study aims to take the first step in analysing this issue and to support and stimulate new investigations.
It is assumed that the wide availability of MDA facilities found in some cities to the detriment of others may be due to their different level of urbanisation. A previous study has found different profiles for the urban landscape and street design of 370 cities in LA(Reference Sarmiento, Useche and Rodriguez21). These profiles can be useful to describe current urban environments and assess their association with MDA coverage and to develop interventions. In China, for example, the coverage of MDA services is supposed to be higher in more urbanised areas since the food delivery service requires a wide availability of establishments and an accessible road network(Reference Zhou, He and Wu22). In our study, we have added information on the number of inhabitants of the studied cities and found a correlation between this variable and the number of establishments registered in the MDA.
The technological development in large urban centres also favours adherence to MDA and the expansion of this service. Thus, the differences found in the availability of establishments on the MDA may also be a reflection of this phenomenon. For example, some cities with a greater availability of establishments also have good coverage of Internet and telephone services. In Mexico City, 33·1 % of the population has Internet access, and 74·4 % has mobile phone access, while, in Buenos Aires, 89·51 % of residents have mobile phone access. In São Paulo, 55·8 % of the population has Internet access, and 90·3 % has mobile phone access. These data refer to the year 2010, when the last demographic census took place in these cities, and were available up to the date of completion of this study(23).
We found a high frequency of terms related to ‘snacks’, which denotes the wide offering of prepared foods such as hamburgers, pizza and other ultra-processed snacks among the establishments of the cities assessed. Studies from developed countries have evidenced the high prevalence of unhealthy meals on MDA. An investigation in Chicago (USA), Amsterdam (Netherlands) and Melbourne (Australia) showed that the keywords ‘burger’ and ‘pizza’ were among the 10 most used by establishments registered with a large international MDA(Reference Poelman, Thornton and Zenk5). In Australia and New Zealand, over 80 % of the food items on menus on MDA were of low nutritional quality and not in line with national dietary recommendations(Reference Wang, Korai and Jia15,Reference Partridge, Gibson and Roy16) . In Canada, menus from MDA-registered establishments received low scores in the Healthy Eating Index-2015 (Reference Brar and Minaker17).
In the LA region, studies on MDA are concentrated only in Brazil(Reference Horta, Souza and Rocha8–Reference Horta, Souza and Mendes10). The results indicate a high prevalence of items that mark an unhealthy diet (e.g. pizza and hamburgers) on the menu of establishments and in promotional ads. Nevertheless, these authors also recorded relevant participation in advertisements of meal dishes composed predominantly of rice, beans, vegetables and meats, typical ingredients of the Brazilian food culture(Reference Horta, Souza and Rocha8–Reference Horta, Souza and Mendes10). This is a characteristic that can be explained by Brazilians maintaining the habit of consuming culinary preparations based on fresh or minimally processed foods and culinary ingredients in their main meals (lunch and dinner)(Reference Levy, Andrade and Cruz24).
The keywords ‘Typical cuisine’ and ‘Meat and fish’ were frequent in the self-presentation establishments in four cities, which points to the possibility that MDA reproduces patterns of the local food culture. For example, keywords that demarcate traditional meals of the LA region, such as tacos, burritos, parrilla, pollo and alitas, were frequently used. Although the preservation of the food culture is a feature highly recommended for food services(Reference Mingay, Hart and Yoong25), cautious should be placed when analysing this result. Establishments can define themselves as traditional even though no commitment is made to produce a real typical dish according to traditional recipes. It is questionable whether the typical cuisine offered by the out-of-home food sector in foreign countries is comparable to homemade food in the country of origin since typical meals usually suffer modifications in order to increase acceptance in different cultures.
Other keywords such as ‘Desserts’, ‘Breakfast’ and ‘Healthy’ occurred at a low frequency across cities. A possible reason may be the less complex food preparation required for desserts and breakfast, leading to less dependence on the convenience of MDA. Moreover, the low frequency of the keyword ‘Healthy’ denotes the low availability of meals with more healthiness-related characteristics available through MDA establishments. These meals may require more complex operationalisation due to the high degree of perishability of the ingredients and special care for transportation. Thus, they may be unattractive to establishments registered with MDA. As done in the discussion of typical cuisine keywords, it is also important to reflect on the use of keywords related to healthy eating when there is no oversight of the nutritional quality of meals. In some circumstances, establishments can define themselves as healthy for self-promotion, which can mislead consumers.
Regarding the use of marketing strategies, photos, free delivery and discounts were prevalent in the establishments’ advertisements, with differences among the nine cities. Similarly, some differences have been noted in the occurrence of these marketing strategies among the groups of keywords. Despite this, all of the strategies were considered frequent in the sample denoting they are a common feature of MDA. The difference in the use of marketing strategies among establishments in the cities and according to the keywords can be attributed to the level of establishments’ relationship with the MDA and may reflect significant social, economic and societal differences in the cities in question.
The use of photos of food or meals is among the most used marketing strategies by establishments in the analysed MDA. This resource is highly recommended by the platforms and is an important factor in purchasing food in this medium. To produce photos with quality, the platforms’ guidelines for registered establishments involve care with ambient light, the definition of the best angle for the photographic record, the use of editing applications and the composition of the scenario, among others(26). The strategies of free delivery and discounts provide consumers with economic advantages, which influence the intention and behaviour of the use of MDA by generating in consumers a good perception of cost–benefit in the use of technology(Reference Christino, Cardozo and Petrin27). Among twenty-two adults living in the UK who had used online food delivery services on at least a monthly basis over 2020, online food delivery services were not used to purchase healthy food and participants valued price promotions and concluded that receiving them justified their online food delivery service use(Reference Keeble, Adams and Burgoine28). Since the majority of food promoted in MDA are not considered healthy, the highly presence of marketing strategies with great persuasive potential, including those that confer economic benefits, is a concern for public health. Our study generates initial evidence that can support actions encouraging a health-promoting MDA in LA.
Recently, the WHO Europe Regional Office has developed guidance on actions that can be taken to improve the food environments of MDA. The office recommends that researchers conduct studies investigating the impact of MDA on public health in addition to monitoring the evolution of their services and the quality of meals provided(2). Therefore, the methodology adopted by the present study can be a first step to achieve these actions, primarily because a more detailed analysis of the theme, such as the complete evaluation of the menus of the establishments, can be costly in addition to requiring ample human capital for execution. However, some actions can be taken to improve this methodology. One is the conduction of studies that evaluate the concordance between the keywords used by the establishments and what is offered on the menus.
As the food environment of MDA is largely unregulated(Reference Granheim, Løvhaug and Terragni1,2) , its characterisation is critical to advancing this agenda in LA. Among the countries of the cities evaluated, in at least seven (Brazil, Chile, Colombia, Mexico, Peru, Uruguay and Ecuador), there are state regulations that seek to place limits on the availability and marketing of unhealthy foods. However, these regulations are weakly applied to the digital environment(29–31).
Therefore, to improve regulatory aspects of the MDA environment, we suggest imposing limits on marketing resources for establishments characterised by keywords that denote poor healthiness of the meals offered and requiring transparency in the nutritional description and composition of the items offered by establishments. In addition, MDA can work to promote a healthier digital food environment by providing conditions that favour the registration of establishments that offer meals of better nutritional quality. Also, the MDA can give more prominence to healthy meals in their layout, such as prioritising the display of healthy establishments over unhealthy ones and favouring the identification of such establishments on their main pages. Establishments identified by traditional cuisine keywords should also be committed to the original recipes and not to add ultra-processed ingredients in their meals.
Finally, despite the strength of the study, some limitations must be highlighted. First, only the keywords used by the establishments were analysed. Therefore, these keywords may not represent all the items offered on their’ menus. However, it is assumed that the keyword used by the establishments for their characterisation is strategically planned to represent the main meals offered. Second, the main mealtimes may vary in different countries according to cultural and time zone issues. Thus, using a standard time for data collection (19.00–21.00) may not reflect the time of greatest availability of the establishments on the MDA. However, we attempted to overcome this issue by including establishments that were in closed status at the time of data collection but were active on the platform. Third, since we used a central location to run data collection, it is possible that establishments attending different locations in the city did not compose our sample. However, we have chosen the central area which has the highest urban development and probably the greatest establishments’ coverage. Finally, due to the unavailability of updated databases containing socio-economic indicators for the cities evaluated, it was not possible to compare the keywords and marketing strategies based on these characteristics.
Conclusion
A wide availability of establishments registered with the MDA was found in the Latin American region. However, this availability differed between cities, and greater availability was noted in Mexico City, Bogota, Buenos Aires and Sao Paulo. The use of keywords in characterising the establishments differed among the cities evaluated. However, a pattern of similarity was evidenced in the frequent use of the keyword ‘Snacks’ for five of the nine cities. Moreover, in at least four cities, the frequency of keywords that mark traditional meals, such as ‘Typical cuisine’ surpassed that of the other keywords, evaluated. Finally, marketing strategies such as photos of foods/meals, discounts and free delivery were frequent among MDA establishments, although some differences were noted among the cities and the groups of keywords.
Acknowledgements
None.
This research did not receive any specific grant from funding agencies in the public commercial or not-for-profit sectors.
J. P. M. participated in project preparation, data analysis and manuscript writing. K. C. M. J participated in database construction, data analysis and manuscript writing. P. M. H. participated in project preparation and critically revised the manuscript. All authors approved the final manuscript.
The authors declare that there are no conflicts of interest.
Supplementary material
For supplementary material referred to in this article, please visit https://doi.org/10.1017/S0007114523001368


