1 Introduction
What predicts U.S. Supreme Court rulings? What predicts whether a country will suffer a civil war? How might we forecast U.S. presidential election outcomes at the local level? These are important questions. For example, dozens of papers and hundreds of journalists have sought to predict Supreme Court rulings (e.g., Ruger et al. Reference Ruger, Kim, Martin and Quinn2004; Epstein, Landes and Posner Reference Epstein, Landes and Posner2010; Black et al. Reference Black, Treul, Johnson and Goldman2011), which are delivered only after months of closed-door deliberation but nonetheless involve key issues in American politics—including civil rights, voting rights, presidential powers, and national security. In the ten months that the Supreme Court was privately deliberating a prominent same-sex marriage case, for example, thousands of couples married without assurances that the federal government would recognize their marriages.Footnote 1
In this paper, we introduce one tool that, though underused in political science, offers attractive properties for social science prediction problems: AdaBoosted decision trees (ADTs). ADTs capture gains in prediction when there are many variables, most of which add only limited predictive value. We illustrate their utility by predicting Supreme Court rulings using a novel dataset that includes case-level information alongside textual data from oral arguments. Using this approach, we predict more than 75% of all case outcomes accurately, with even higher accuracy among politically important cases. Substantively, we are able to accurately predict approximately seven more cases per year (out of around 80) compared to the baseline of predicting that the petitioner will always win, which yields 68% accuracy. To illustrate the broad applicability of ADTs, we provide two additional examples: (1) predicting whether civil war occurs in a country in a given year (which we predict with 99.0% accuracy) and (2) predicting county-level U.S. presidential election outcomes (which we predict with 96.7% accuracy, using the 2016 election as our example).
2 AdaBoosted Decision Trees and their Applicability to Social Science Questions
With exceptions (e.g., Green and Kern Reference Green and Kern2012; Montgomery and Olivella Reference Montgomery and Olivella2016; Muchlinski et al. Reference Muchlinski, Siroky, He and Kocher2016; Bansak et al. Reference Bansak, Ferwerda, Hainmueller, Dillon, Hangartner, Lawrence and Weinstein2018), tree-based models are rarely used in political science, which tends to focus on substantive and/or causal interpretation of covariates.Footnote 2 Tree-based models—which are designed to incorporate flexible functional forms, avoid parametric assumptions, perform vigorous variable selection, and prevent overfitting—are common, however, in machine learning. These approaches are well suited for identifying variables important for forecasting, which could include variables that are not causal in nature per se but that are nonetheless predictive and for analyses involving large numbers of variables of potential (but uncertain) substantive importance.
The simplest tree-based models partition a dataset into “leaves” according to covariates and predict the value of each leaf. For example, a decision tree predicting Supreme Court rulings might start by splitting cases by whether the government is the respondent. If so, the algorithm may predict that the government wins. If not, the algorithm may examine the provenance of the case and, if there is a circuit split, predict that the petitioner wins. If it is not a circuit split, then it may examine whether Anthony Kennedy spoke frequently at oral arguments. If he did, the algorithm may predict that the respondent wins.
Our analysis relies on boosted decision trees, discussed in Montgomery and Olivella (Reference Montgomery and Olivella2016) and which are newer to political science. (For an application of boosted regression trees to refugee allocation, see Bansak et al. Reference Bansak, Ferwerda, Hainmueller, Dillon, Hangartner, Lawrence and Weinstein2018.) Boosting creates trees sequentially, and as Montgomery and Olivella (Reference Montgomery and Olivella2016, p. 11) explain, each new tree then “improves upon the predictive power of the existing ensemble.” The base classifier relies on “weak learners,” decision rubrics that perform only slightly better than chance.
We use one of the most widely used boosting algorithms, AdaBoost. (See Appendix G, Section 8.4 for a discussion of other boosting approaches and why we chose AdaBoost.) AdaBoosting initializes by giving each observation equal weight. In the second iteration, AdaBoost will assign more weight to those units that were incorrectly classified in the first iteration. Focusing on those units that are hard to classify makes this approach well suited to social science problems, many of which involve heterogeneity and outliers.Footnote 3
2.1 Pros and Cons of ADTs
ADTs’ properties make it attractive for social science research. First, it has desirable asymptotics in improving predictive accuracy, especially when there are many features that each only contribute a small predictive gain. In predicting Court outcomes, although baseline accuracy is high, the predictive capacity of any one variable is small, leaving little room for improvement. This is common in the social sciences. Predicting the advent of civil wars has high baseline accuracy since there are few wars, but each additional predictor adds little information (Ward, Greenhill and Bakke Reference Ward, Greenhill and Bakke2010). Changes in which party controls the U.S. Presidency are often summarized by the “bread and peace” model: the incumbent party wins when the economy is growing, except during unpopular wars (Hibbs Jr Reference Hibbs2000). This produces high baseline accuracy, with other variables adding little (Gelman and King Reference Gelman and King1993). Second, AdaBoost provides a useful theoretical guarantee: for any given iteration, as long as that model’s predictions are consistently better than random chance, the overall model’s training error is guaranteed to decrease (Mukherjee, Rudin and Schapire Reference Mukherjee, Rudin and Schapire2011).Footnote 4 Lastly, AdaBoost is agnostic to predictor or outcome data types, be they binary, continuous, or categorical (Elith, Leathwick and Hastie Reference Elith, Leathwick and Hastie2008), simplifying its implementation in dealing with mixed datasets of many predictors.
We also note drawbacks. First, ADTs sacrifice some interpretability of estimates for flexibility of functional form. By avoiding assumptions about the relationship between Court rulings and covariates, for example, ADTs provide more robust predictive capacity. However, they preclude discussions of statistical significance or effect sizes; rather than interpreting coefficients on covariates, ADTs rely on “feature importance.” (Appendix C discusses how feature importance could nonetheless provide substantively important information that models like OLS miss.) Second, ADTs are computationally expensive without being parallelizable. Third, ADTs have many tuning parameters inherited from decision trees, and a few added from AdaBoost. Fourth, ADTs tend to overfit easily, especially compared to random forests (Elith et al. Reference Elith, Leathwick and Hastie2008). This can be controlled by limiting the learning rate (see Appendix G) at the cost of computation time. Lastly, there exist important problems for which AdaBoost fails. With insufficient sample sizes, primarily unpredictive covariates, or unsuitable base models, AdaBoost will show no improvement over more naive methods. Despite this, AdaBoost has been shown to work well in a wide variety of experimental settings among benchmark problems in computer science (Freund and Schapire Reference Freund and Schapire1996).
3 Application of AdaBoosting to the Supreme Court
We illustrate ADTs by predicting rulings by the U.S. Supreme Court. Because the Court decides cases of magnitude—including cases on presidential power, states’ rights, and national security—even small predictive gains translate into significant policy importance. The simplest predictive algorithm for Court rulings is that the petitioner (party appealing the case) wins roughly two thirds of the time (Epstein et al.
Reference Epstein, Landes and Posner2010).Footnote
5
In practice, guessing that the petitioner wins every time predicts 67.98% of cases since 2000 accurately (Appendix A1), though several studies have surpassed this baseline (Martin et al.
Reference Martin, Quinn, Ruger and Kim2004; Katz, Bommarito and Blackman Reference Katz, Bommarito and Blackman2014; Katz, Bommarito II and Blackman Reference Katz, Bommarito and Blackman2017). In this paper, we compare our approach to two prominent Court forecasting models,
![]() $\{\text{Marshall}\}+$
and CourtCast.Footnote
6
$\{\text{Marshall}\}+$
and CourtCast.Footnote
6
We implement ADTs using the scikit-learn Python library.Footnote 7 We train our model (and comparison models) using two data sources from 2005 to 2015. First, we use case-level covariates from the Supreme Court Database (Spaeth et al. Reference Spaeth, Epstein, Martin, Segal, Ruger and Benesh2015). These include the procedural posture of the case, the issues involved, the parties’ identities, and other case-level factors, detailed in Appendix C.Footnote 8 Second, we incorporate statements made by the Justices during oral arguments. Scholarship suggests that Justices use oral arguments to gather information and stake out positions (Johnson, Wahlbeck and Spriggs Reference Johnson, Wahlbeck and Spriggs2006). We draw on textual data from the Court’s oral argument transcripts provided by the Oyez Project (Goldman Reference Goldman2002), which we operationalize into 55 variables, detailed in Appendix C. Finally, we optimize our model’s tuning parameters using grid search (see Appendix G).
4 Results and Comparisons to Other Approaches
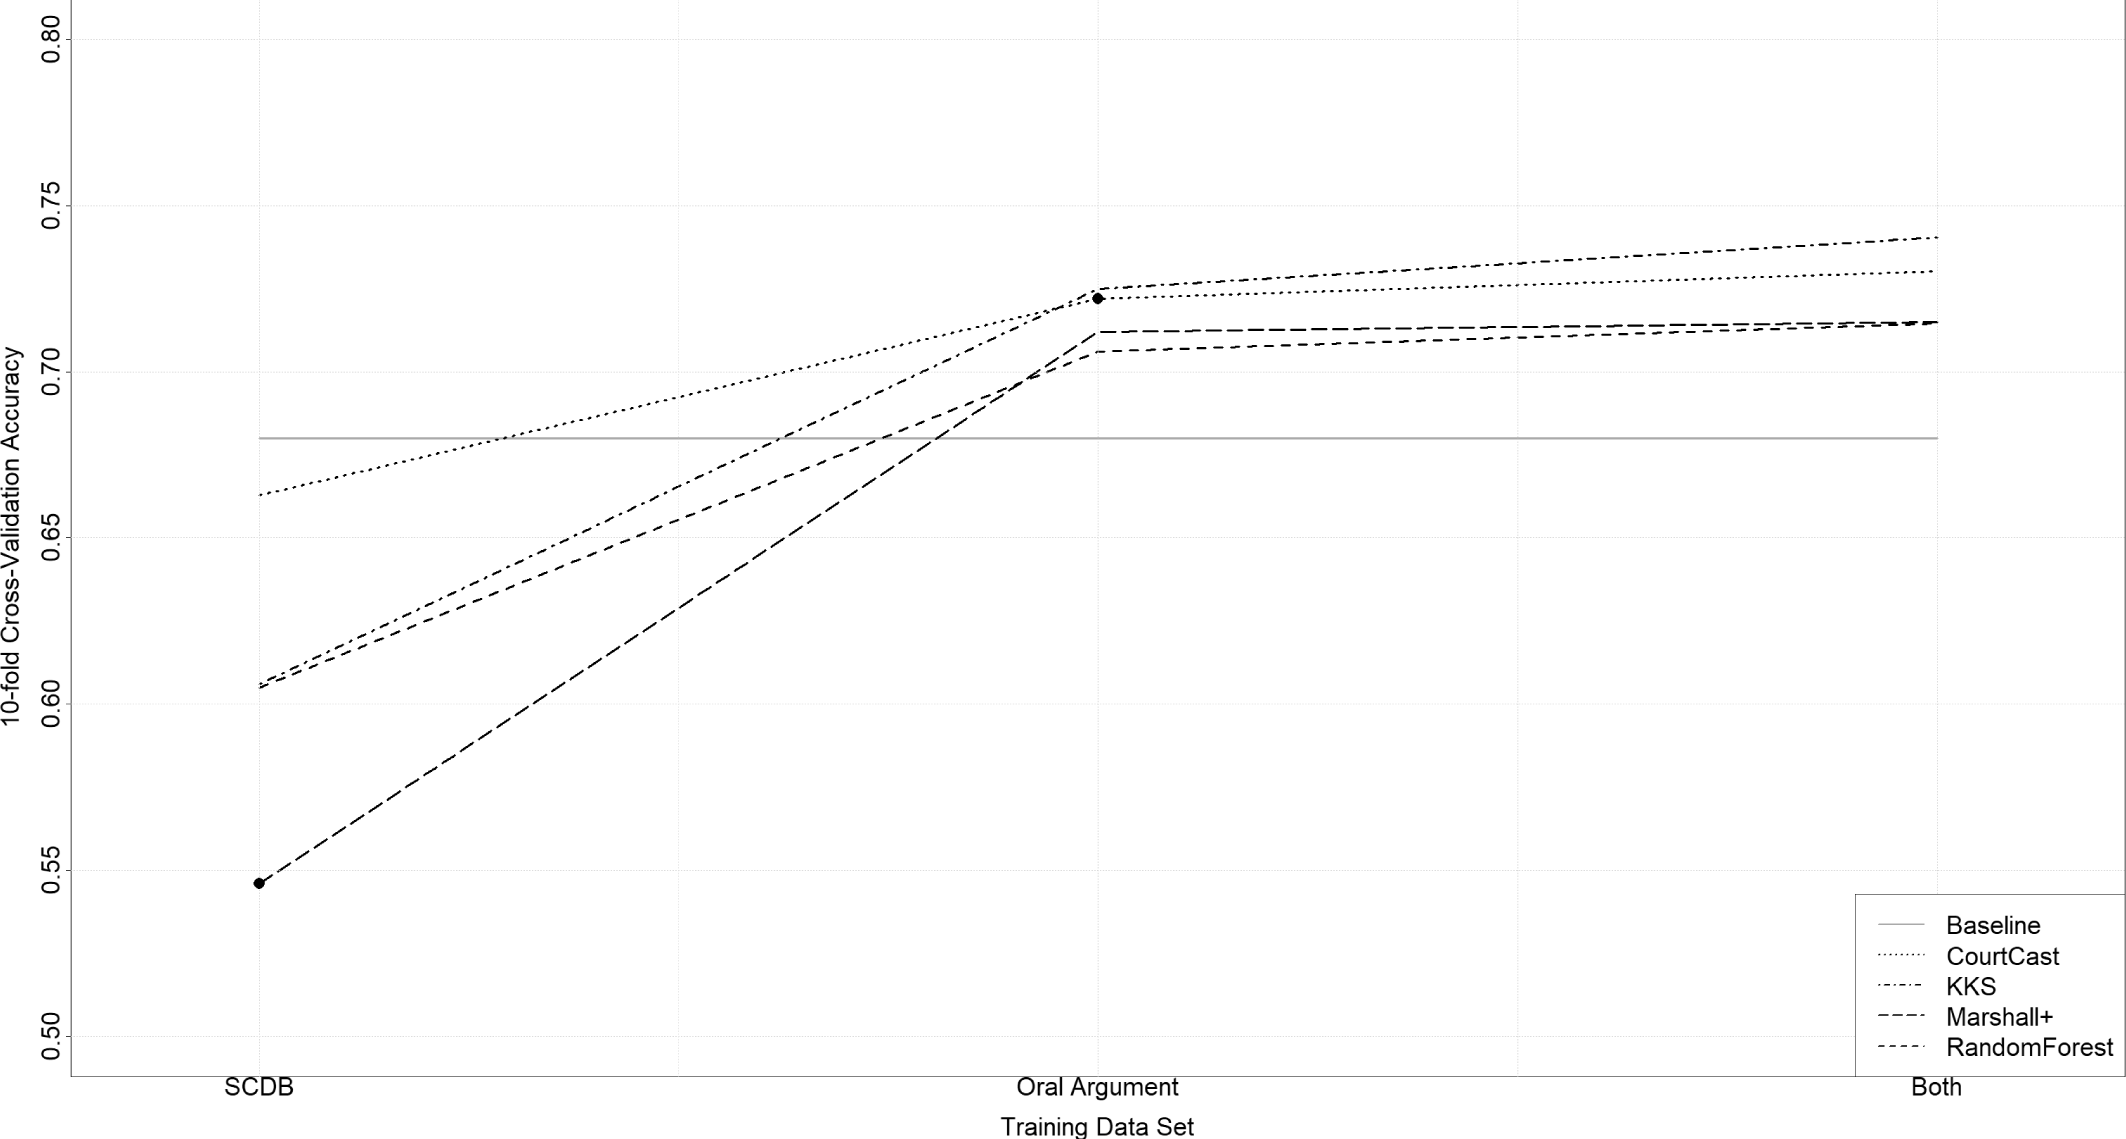
In Figure 1 below, we compare predictions based on (1) our model (referred to as “KKS”) to (2) the “petitioner always wins” baseline rule, (3) CourtCast, (4)
![]() $\{\text{Marshall}\}+$
, and (5) a generic random forest distinct from Katz et al. (Reference Katz, Bommarito and Blackman2017). We evaluate all models using tenfold cross-validation (Efron and Tibshirani Reference Efron and Tibshirani1997), which captures a model’s ability to predict withheld samples of the observed data (see Appendix D).
$\{\text{Marshall}\}+$
, and (5) a generic random forest distinct from Katz et al. (Reference Katz, Bommarito and Blackman2017). We evaluate all models using tenfold cross-validation (Efron and Tibshirani Reference Efron and Tibshirani1997), which captures a model’s ability to predict withheld samples of the observed data (see Appendix D).

Figure 1. Cross-Validation Accuracy for KKS compared to the “petitioner always wins” baseline, CourtCast,
![]() $\{\text{Marshall}\}+$
, and a generic random forest. We compare these across three datasets: Supreme Court Database (“SCDB”), oral argument data, and both datasets jointly. For
$\{\text{Marshall}\}+$
, and a generic random forest. We compare these across three datasets: Supreme Court Database (“SCDB”), oral argument data, and both datasets jointly. For
![]() $\{\text{Marshall}\}+$
and CourtCast, black dots indicate the original dataset on which those models were trained.
$\{\text{Marshall}\}+$
and CourtCast, black dots indicate the original dataset on which those models were trained.
In Table 1, we present each model’s accuracy as reported by their authors in the original papers. For
![]() $\{\text{Marshall}\}+$
, the original self-reported accuracy is much higher than we achieve (Figure 1), since it includes covariates we purposely excluded.Footnote
9
For CourtCast, self-reported accuracy is lower than we achieve: the original CourtCast model uses fewer training years and less accurate data than in our replications and measures accuracy using a single train-test split rather than 10-fold cross-validation.
$\{\text{Marshall}\}+$
, the original self-reported accuracy is much higher than we achieve (Figure 1), since it includes covariates we purposely excluded.Footnote
9
For CourtCast, self-reported accuracy is lower than we achieve: the original CourtCast model uses fewer training years and less accurate data than in our replications and measures accuracy using a single train-test split rather than 10-fold cross-validation.
Table 1. Accuracy (self-reported) for (1) the “petitioner always wins” baseline, (2) Katz et al. (Reference Katz, Bommarito and Blackman2017)’s Random Forest, (3)
![]() $\{\text{Marshall}\}+$
, (4) CourtCast, and (5) KKS. “Data” indicates the training dataset: case-level covariates from the Supreme Court Database (“SCDB”), transcript data from the oral arguments (“oral argument”), or both. The KKS model using all covariates almost triples the added accuracy of the next best model.
$\{\text{Marshall}\}+$
, (4) CourtCast, and (5) KKS. “Data” indicates the training dataset: case-level covariates from the Supreme Court Database (“SCDB”), transcript data from the oral arguments (“oral argument”), or both. The KKS model using all covariates almost triples the added accuracy of the next best model.

Figure 1 indicates for each model the dataset (Supreme Court Database, oral arguments data, or both), cross-validation accuracy, and comparison to baseline accuracy. We generate these accuracy statistics by training the respective models on data from 2005 to 2015. We find that all models perform best using the joint dataset; all perform second best with the oral argument dataset. The KKS model using only case covariates performs less well, achieving an accuracy of more than 7 points below baseline. Using oral argument data, however, it exceeds baseline by more than 5 points with an accuracy of 72.5%. With joint data, it achieves an accuracy of 74.04%. Its added accuracy of 6.06 points over baseline is almost triple the added accuracy originally reported by Katz et al. Reference Katz, Bommarito and Blackman2017. Substantively, this means our model correctly predicts about seven more cases (out of 80) per term than baseline—a meaningful improvement.
Interestingly, no model using only case covariates surpasses baseline accuracy; it is unsurprising that oral argument data, collected much closer to the decision, are more predictive than case covariates determined years prior to a ruling. We also note that by introducing the joint dataset to
![]() $\{\text{Marshall}\}+$
and CourtCast, both outperform their originally reported results, though neither perform as well as KKS on either the oral argument or the joint datasets.
$\{\text{Marshall}\}+$
and CourtCast, both outperform their originally reported results, though neither perform as well as KKS on either the oral argument or the joint datasets.
5 Predictive Accuracy Conditional on Covariates
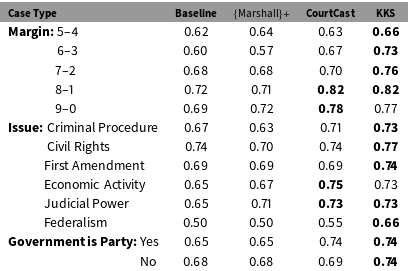
Our model enjoys an overall gain of approximately six percentage points over baseline, but this often increases when we examine subsets of cases. Close 5–4 decisions go to the petitioner 61% of the time on average, and our accuracy for 5–4 cases is 66%, five points above that baseline. We correctly predict 73% of 6–3 cases, 76% of 7–2 cases, 82% of 8–1 cases, and 77% of 9–0 cases; our model provides the biggest accuracy boost, 13 points, for 6–3 decisions.
Our model also outperforms the baseline in cases related to judicial power (nine points) and federalism (16 points) and where a state or federal government is a party (nine points). We see weaker gains in criminal procedure, civil rights, and First Amendment cases (Table 2). Our model outperforms
![]() $\{\text{Marshall}\}+$
and CourtCast in all subgroups except two: CourtCast performs one point better in unanimous cases and two points better in economic activity cases. However, both previous models often fail to exceed the baseline:
$\{\text{Marshall}\}+$
and CourtCast in all subgroups except two: CourtCast performs one point better in unanimous cases and two points better in economic activity cases. However, both previous models often fail to exceed the baseline:
![]() $\{\text{Marshall}\}+$
in eight subgroups and CourtCast in two.
$\{\text{Marshall}\}+$
in eight subgroups and CourtCast in two.
Table 2. KKS model accuracy by decision margin.

5.1 Additional applications: county-level U.S. presidential vote share & civil wars
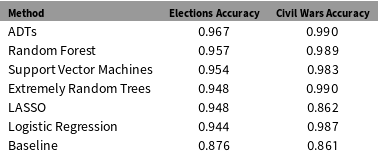
ADTs are promising for other political science applications and may outperform even other tree-based methods. To demonstrate, we examine two applications. First, we look at U.S. presidential elections. For this, we analyze data from the 2010 U.S. Census that includes county-level age, income, education, and gender. The outcome variable is whether the Democratic Party’s two-party county-level vote share in the 2016 presidential election is greater than 50%. The baseline is calculated by predicting that the Republican Party’s two-party county-level vote share is greater than 50%. To assess accuracy, we use 10-fold cross-validation for the proportion of counties correctly predicted.
Second, we look at civil war incidence, examining a dataset indicating which country-years were engaged in civil wars, alongside country-level covariates derived from Collier and Hoeffler (Reference Collier and Hoeffler2002) and Fearon and Laitin (Reference Fearon and Laitin2003), including population, GDP, Polity score, ethnolinguistic fractionalization, and oil reserves. The baseline accuracy is 86.1%, achieved by predicting “no civil war” in all cases. To assess accuracy, we use 10-fold cross-validation on the proportion of country-years correctly predicted as having a civil war or not.
Table 3. ADTs outperform other methods in predicting both county-level vote share in the 2016 U.S. Presidential Election and civil war incidence.

Table 3 presents these results. ADTs outperform competing linear, nonlinear, and tree-based methods. These improvements, even when small, are substantively meaningful. As the example of 2016 shows, presidential elections are consequential and hard to predict. In our dataset of 3,082 counties, being able to predict the likely vote of 308 more counties than baseline (and 31 more counties than the next best model), may impact how campaigns distribute resources. Predicting civil wars is likewise hugely important; accurately forecasting them holds great promise for allocating scarce peacekeeping resources. Across 6,610 country-years since 1945, our model correctly predicts 853 more cases than baseline (and seven more cases than the next best model), corresponding to 11.8 additional countries each year; it also predicts around 20 more cases than a logistic regression (0.36 more per year). Both are substantively meaningful differences that would be useful for policy experts and analysts.
6 Discussion and Conclusion
Our contributions are twofold. First, we provide an overview of ADTs, a technique frequently used in machine learning but one more novel within the social sciences. The approach is promising for many social science questions owing to its robustness to small sample sizes and its treatment of weakly predictive (though not unpredictive) covariates. As our examples show, this approach performs favorably compared to other commonly used methods across several applications. We include technical overviews and best practices guides in the Appendix.
Second, we contribute to a growing literature on Supreme Court prediction. The Court is the most reclusive branch of the U.S. government, yet it rules on some of the most important and contentious policy issues of the day. Increasing the predictive accuracy of forecasting models not only improves our understanding of how this important branch of government operates, but also, we believe, allows researchers to more credibly assess which way these influential rulings may go.
Acknowledgements
Many thanks to Matthew Blackwell, Peter Dilworth, Finale Doshi-Velez, Phillipa Gill, Gary King, Brian Libgober, Chris Lucas, Luke Miratrix, Kevin Quinn, Jeff Segal, Robert Ward, and participants at the Computational Social Science Institute Seminar at University of Massachusetts, Amherst for helpful conversations and valuable feedback. We also thank Josh Blackman, Michael Bommarito, and Dan Katz for comments during early stages of this project.
Supplementary material
For supplementary material accompanying this paper, please visit https://doi.org/10.1017/pan.2018.59.


