Adequate consumption of n-3 PUFA derived from marine oily fish, specifically EPA and DHA, is important for development(Reference Lauritzen, Brambilla and Mazzocchi1) and for maintaining health across the life course(Reference Calder2). Consequently, governments and advisory organisations have published recommendations for EPA and DHA intakes(Reference Kuratko, Salem and McNamara3). The UK government recommends that all adults should consume at least 450 mg/d of EPA + DHA(4). However, the effectiveness of such recommendations is limited by the dietary choices of the population. In the UK, only 27 % of adult fish consumers eat oily fish(Reference Givens and Gibbs5,Reference Givens and Gibbs6) and most UK adults are considered to consume less than 200 mg EPA + DHA daily, while intakes in children are about 10 % of those in adults(Reference Givens and Gibbs6). Low oily fish consumption appears to reflect, at least in part, economic cost, perceived unpalatability(Reference Givens and Gibbs6) and adoption of dietary choices that exclude all meat, dairy foods and fish, which are important sources of EPA and DHA in the diet(Reference Rosell, Lloyd-Wright and Appleby7,Reference Burdge, Tan and Henry8) . Furthermore, the potential effectiveness of recommendations for EPA + DHA intakes is constrained further by the size of marine sources of these fatty acids. For example, Salem & Eggersdorfer(Reference Salem and Eggersdorfer9) estimate that if the world population consumed 500 mg EPA + DHA per day, this could not be met from current marine fish stocks and would incur an annual shortfall of 1·1 million metric tons of EPA + DHA for human consumption.
There is, therefore, a need for alternative sources of EPA and DHA which are sufficiently sustainable and scalable to meet global requirements. EPA and DHA can be synthesised by humans from α-linolenic acid which is present in some plant oils(Reference Baker, Miles and Burdge10). However, studies involving stable isotope tracers show that capacity for synthesis of EPA and, especially DHA, is very limited in humans(Reference Burdge11), although greater in women than men(Reference Burdge, Wright and Jones12,Reference Burdge and Wootton13) . These findings are supported by those from dietary supplementation trials which show that increased α-linolenic acid intake can increase EPA, but not DHA, concentration in blood and cell lipids in men and postmenopausal women(Reference Baker, Miles and Burdge10). However, women of reproductive age can maintain higher blood DHA concentration than men(Reference Lohner, Fekete and Marosvolgyi14). Vegetarians and vegans who exclude meat and oily fish from their diet have approximately 50 % lower EPA and DHA status than omnivores(Reference Burdge, Tan and Henry8). Thus, at least in some population groups, α-linolenic acid intake does not provide an adequate alternative source of EPA and DHA to consuming these fatty acids preformed(Reference Burdge and Wootton13,Reference Burdge, Jones and Wootton15) . Krill oil has been proposed as an alternative source of EPA + DHA to oily fish. However, the estimated yield from the total krill catch in 2013 was approximately 0·3 % of the global EPA + DHA requirement(Reference Kwantas and Grundman16) and claims for greater bioavailability of n-3 PUFA from krill oil compared with fish oil appear to be unfounded(Reference Salem and Kuratko17). Algal oils have been proposed as an alternative source of EPA and DHA(Reference Salem and Kuratko17) and currently account for 2 % of human EPA + DHA consumption(Reference Salem and Eggersdorfer9). However, the cost of fermentation and refining processes limit the extent to which production of algal sources of EPA and DHA can be scaled to meet demands(Reference Salem and Eggersdorfer9). Overall, there is a need to identify or develop novel sources of EPA and DHA that can replace fish oil to offset the global deficit in EPA and DHA supply.
Vegetable oils derived from genetically modified plants represent one potential means of providing EPA and DHA for the human population which is both sustainable and amenable to changes in scale(Reference Kraic, Mihalik and Klcova18). Such oils may potentially overcome the concerns about the palatability, sustainability and contamination with environmental pollutants that are associated with fish oil(Reference Givens and Gibbs5), and the limited intakes of EPA + DHA by those who exclude oily fish and/or other animal-derived foods from their diet(Reference Burdge, Tan and Henry8). Two strains of the oil seed crop Camelina sativa have been genetically modified to produce oil containing EPA or EPA + DHA(Reference Ruiz-Lopez, Haslam and Napier19,Reference Petrie, Shrestha and Zhou20) . These seed oils are potential candidates for replacement of fish oil and oily fish as sources of EPA + DHA in the human diet. However, the EPA and DHA content of the oils differs markedly between the strains. One strain contained 15 % DHA, but only 1·8 % EPA(Reference Petrie, Shrestha and Zhou20), while the other contained approximately 11 % EPA and 6 % DHA(Reference Ruiz-Lopez, Haslam and Napier19) which approximates the proportions of these fatty acids in marine fish oil(Reference Napier, Usher and Haslam21). Oil from a strain of C. sativa containing 20 % EPA has been shown to be bioavailable and well tolerated in mice(Reference Tejera, Vauzour and Betancor22) and salmon(Reference Betancor, Sprague and Usher23). However, humans are unable to convert EPA to DHA(Reference James, Ursin and Cleland24) and so oils from transgenic plants that only contain EPA have limited application to meeting demands for both EPA and DHA. Importantly, the bioavailability, tolerance and biological effects of oils containing EPA and DHA from transgenic plants have not yet been tested in humans.
To address this, we tested the hypothesis that EPA and DHA consumed as oil from transgenic C. sativa (CSO) are incorporated after a meal into blood lipids at least as well as when consumed as fish oil. In the present study, men and women in two age groups took part in a double-blind, postprandial trial. The study compared the appearance of EPA and DHA in blood lipids over 8 h following consumption of a single meal containing 450 mg EPA + DHA provided as either CSO or commercial blended fish oil (BFO). Moreover, because we have shown that acute consumption of fish oil can alter the pattern of postprandial changes in lipoprotein size(Reference Burdge, Powell and Dadd25), we investigated whether the postprandial changes in lipoprotein profiles differed between test meals containing either CSO or BFO. The postprandial period has been associated with an acute increase in specific circulating inflammatory cytokines; namely TNFα, IL-6, IL-10 and soluble intercellular cell adhesion molecule (sICAM)-1 which appear to reflect the lipid content of a meal(Reference Burdge and Calder26). We tested whether the postprandial changes in these cytokines differed between test meals containing CSO or BFO.
Materials and methods
Preparation of Camelina sativa oil
Transgenic C. sativa plants producing EPA and DHA in their seed oil were generated according to previously described methods(Reference Ruiz-Lopez, Haslam and Napier19). Homozygous T3 generation transgenic C. sativa plants were grown in a controlled environment containment glasshouse under long-day conditions (16 h light and 8 h dark), 50–60 % relative humidity, with temperature 23°C d/18°C night, and light intensity of 400 μmol/m2 per s. Seeds were harvested and threshed, and the oil was extracted by cold pressing and solvent extraction. The oil was further processed by refining, bleaching and deodorizing (POS Bio-Sciences).
Human postprandial study
The study was reviewed and approved by the South Central – Hampshire B Research Ethics Committee (REC reference 15/SC/0627), and the trial is registered at ClinicalTrials.gov (identifier: NCT03477045). All participants gave written informed consent.
The trial had a double-blind cross-over design. Blinding was achieved by labelling of the aliquoted oils by a researcher who was not part of the project team and was maintained until after the statistical analyses were completed. Randomisation of the order of the test meals was assigned using a random number generator (www.Random.org). Participants were healthy men and women aged either 18–30 years or 50–65 years, who did not consume oily fish more than once per week, take fish oil or other dietary supplements, did not smoke tobacco, whose BMI was between 18·5 and 30 kg/m2, who were not diagnosed as hypertensive and whose non-fasting blood glucose and total cholesterol concentrations were within normal ranges (glucose <11 mmol/l; cholesterol ≤7·5 mmol/l). Volunteers were excluded if they did not meet these criteria or if they had diagnosed chronic illness, had been prescribed medicines to lower blood lipids or control hypertension, had gastrointestinal disease, were pregnant or intending to become pregnant within the duration of the trial or who were participating in another trial. The characteristics of the participants in the trial are summarised in Table 1 and their progress through recruitment and participation in the trial is summarised in online Supplementary Fig. S1.
Table 1. Characteristics of the participants at the start of the study*
(Mean values with their standard errors)

BP, blood pressure; PC, phosphatidylcholine.
a,b Mean values with unlike superscript letters were significantly different (P < 0·05).
* Statistical comparisons were by one-way ANOVA with Bonferroni’s post hoc correction.
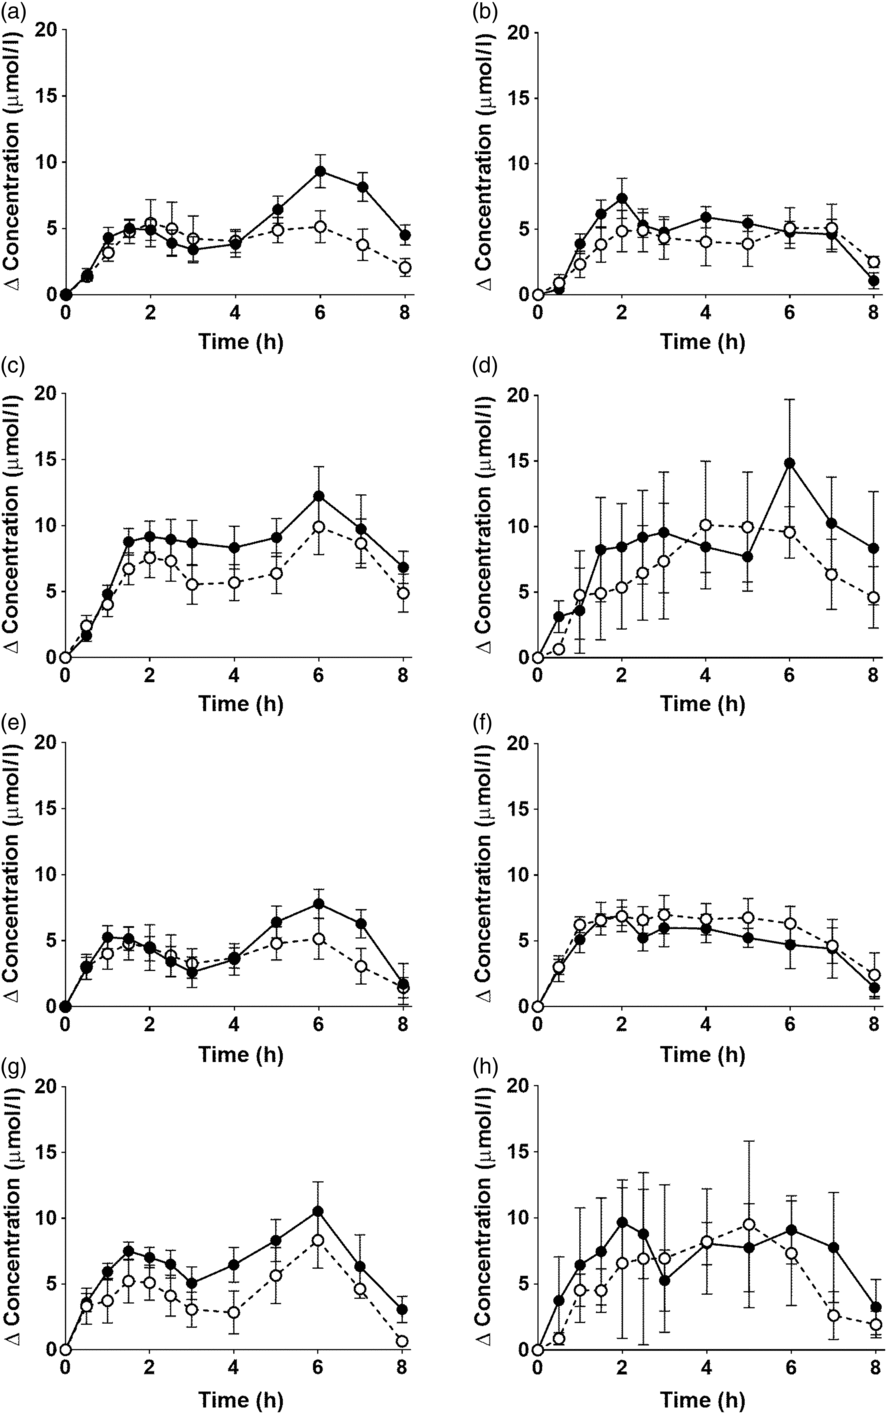
Fig. 1. Postprandial incorporation of EPA and DHA into plasma TAG. Values are changes in concentration from baseline of EPA (a–d) and DHA (e–h) in plasma TAG following consumption of test meals containing either Camelina sativa seed oil (-•-) or blended fish oil (--○--) (n 10/group). (a) and (e), younger females (n 10); (b) and (f), younger males (n 10); (c) and (g), older females (n 10); (d) and (h), older males (n 6). Data are means, with standard errors represented by vertical bars. The results of statistical analysis by ANOVA with Bonferroni’s post hoc correction are described in online Supplementary Table S1.
Following health screening, participants attended the Wellcome Trust Clinical Research Facility (University Hospital Trust, Southampton, UK) after an overnight fast (approximately 12 h) during which they were only allowed to consume water. A cannula was placed in a forearm vein and a baseline (10 ml) blood sample was collected into an evacuated tube containing heparan sulphate anticoagulant. On each of two occasions, at least 14 d apart, subjects then consumed in random order breakfasts with almost identical nutrient contents and fatty acid compositions which consisted of a milkshake drink, and toast and jam( Reference Burdge, Powell and Calder27 ) (Table 2). This provided approximately 450 mg EPA + DHA, equivalent to the daily intake recommended by the UK government( 4 ), either from commercially prepared BFO (452 mg) (Simply Timeless®, Omega-3 fish oil plus cod liver oil; Seven Seas) or CSO (455 mg) (Table 2). Venous blood samples were collected at baseline and at 0·5, 1, 1·5, 2, 2·5, 3, 4, 5, 6, 7 and 8 h after the meal. Participants were allowed to consume water freely throughout, but no further food was provided until the end of the 8-h period. The blood samples were separated into plasma and cell fractions by centrifugation( Reference West, Burdge and Calder28 ), and the plasma was stored at –80°C.
Table 2. Compositions of the test oils and test meals*
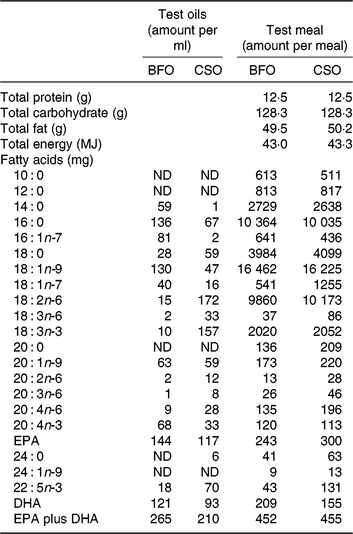
BFO, blended fish oil; CSO, Camelina sativa seed oil; ND, not detected.
* The ingredients used to prepare the test meals were sunflower oil (13 g), double cream (42 g), linseed oil (2·5 g), olive oil (9 g), bread (120 g), marmalade (60 g), Nesquick (25 g), casein (1 g), sucrose (15 g) and test oil BFO (1·7 ml) or CSO (2·4 ml).
Analysis of the fatty acid composition of blood lipids
The fatty acid composition of plasma phosphatidylcholine (PC), TAG and NEFA was determined by gas chromatography essentially as described( Reference Burdge, Wright and Jones12 , Reference West, Burdge and Calder28 ). Briefly, the internal standards dipentadecanoyl PC (100 μg), tripentadecanoin (100 μg) and heneicosanoic acid (50 μg) were added to 0·8 ml plasma and total lipids were then extracted with chloroform–methanol (2:1, v/v). The extracted lipids were dried under a stream of nitrogen, dissolved in chloroform and applied under gravity to a 100 mg aminopropyl silica solid phase extraction column (BondElut; Agilent Technologies) and PC, TAG and NEFA eluted under vacuum as described( Reference Burdge, Wright and Jones12 ). Purified lipid classes were dried under nitrogen and then converted to fatty acid methyl esters (FAME) by reaction with methanol containing 2 % (v/v) sulphuric acid at 50°C for 2 h. The reaction mixture was cooled, neutralised with a solution containing KHCO3 (0·25 m) and K2CO3 (0·5 m), and FAME isolated by extraction with hexane. FAME were resolved on a BPX-70 fused silica capillary column (30 m × 0·25 mm × 25 µm) using an Agilent 6890 gas chromatograph equipped with flame ionisation detection. Running conditions were as follows: FAME (1 μl) were injected into the inlet at 300°C in split mode using He as the carrier gas (1 ml/min). The oven temperature was held at 115°C for 2 min after injection, then increased at 10°C/min to 200°C and held at this temperature for 16 min. The oven temperature was then raised at 60°C/min to 240°C and held at this temperature for 2 min to remove any residual material from the column. The flame ionisation detector was maintained at 300°C( Reference Browning, Walker and Mander29 ). Chromatograms were integrated manually using ChemStation software (version B.03.01, Agilent Technologies). Fatty acid concentrations (μg/ml) were calculated by comparison of the peak area of a fatty acid of interest with that of the internal standard and adjusting for the volume of plasma that was extracted( Reference Burdge, Wright and Jones12 ).
Measurement of lipoprotein concentration and size
Determination of the concentration and diameter of VLDL-chylomicron (VLDL-CM), LDL, IDL and HDL particles was carried out in samples collected at baseline, 1·5 and 6 h as described previously( Reference Burdge, Powell and Dadd25 ) using NMR spectroscopy by LipoScience Incorporated. This technique is unable to resolve VLDL and CM particles in postprandial samples, and hence these are reported as a combined VLDL-CM fraction.
Measurement of cytokines in plasma
The concentrations of sICAM-1, TNFα, IL-6 and IL-10 were measured in plasma samples collected from the younger participants only because of a concern that the lower number of participants in the older male group (n 6) may not have provided sufficient statistical power to compare any effects of the oils. Retrospective power analysis of the current data confirmed this (a sample size of 10 provided 85 % statistical power to detect a 15 % difference between groups in IL-6 concentration with α = 0·05). The assays were conducted using human magnetic Luminex multiplex kits (premixed high sensitivity cytokine kit (product number FCSTM09-06) and a premixed multi-analyte kits (product numbers LXSAHM-02 and LXSAHM-05) in accordance with the manufacturer’s instructions (R&D Systems). The plates were read on a Bio-Plex 200 System (Bio-Rad). The assay sensitivity for each analyte was sICAM-1 87·9 pg/ml, TNFα 0·54 pg/ml, IL-6 0·31 pg/ml and IL-10 0·24 pg/ml.
Statistical analysis
Based on our previous findings( Reference Burdge, Powell and Calder27 ), ten participants per group were calculated to provide 85 % power for detecting a 10 % difference in peak postprandial concentrations of EPA or DHA in plasma TAG at α = 5 % in a two-tailed analysis. For measurements of change over time, statistical comparisons between groups were by ANOVA with age, sex and test oil as fixed factors and time as a repeated measure with Bonferroni’s post hoc correction for multiple testing. For single time point and summary measurements, statistical comparisons between groups were by ANOVA with age, sex and test oil as fixed factors with Bonferroni’s post hoc correction for multiple testing. Where there were fewer than three groups, pairwise comparisons were by calculation of marginal means. The normality of the distribution of the data sets was tested by analysis of residuals by the Shapiro–Wilk test. Sphericity was not assumed for any outcome and so the Greenhouse–Geisser correction was applied to all ANOVA analyses. Data are presented as means with their standard errors and statistical significance was assumed at P < 0·05. Detailed single factor and interaction effects are reported in the online Supplementary Tables S1–S8.
Results
Participant recruitment and tolerance of the trial
A total of 179 individuals enquired about the study, of which 112 did not complete the screening questionnaire for undisclosed reasons (online Supplementary Fig. S1). Twenty-three of the remaining sixty-seven volunteers who were assessed for eligibility against the study inclusion criteria were either found to be ineligible or decided not to participate. Eight of the forty-four of remaining volunteers who gave written consent to take part in the study withdrew before randomisation, primarily because of the time commitment required for the postprandial studies. This was also the main reason why it was not possible to recruit all ten participants in the older male group. The remaining thirty-six participants completed both postprandial sessions.
There were two cases of minor upper respiratory tract infections (a cold and tonsillitis) out of the seventy-two postprandial sessions. One participant experienced a minor nose bleed some hours after one postprandial session, but disclosed that they had a pre-existing non-clinical tendency towards this. One participant developed pyelonephritis between postprandial sessions which was fully resolved. Three participants reported headaches during both postprandial sessions. None of these minor illnesses was associated with consuming a specific oil and all were considered unlikely to be caused by consuming a particular test oil. No major adverse symptoms or health effects were reported by the participants. The four groups of participants did not differ significantly in BMI, systolic or diastolic blood pressure or random glucose concentration (Table 1). Total cholesterol concentration did not differ significantly between younger males and females, and older males, but was significantly higher in the older female group compared with the other three groups (Table 1). EPA and DHA concentrations at baseline in plasma TAG, PC and NEFA were significantly greater in older compared with younger subjects irrespective of sex (Table 1). The rank order of baseline EPA and DHA concentrations was plasma PC > TAG > NEFA (Table 1).
The effect of the test oils on postprandial plasma EPA and DHA concentrations in TAG, phosphatidylcholine and NEFA
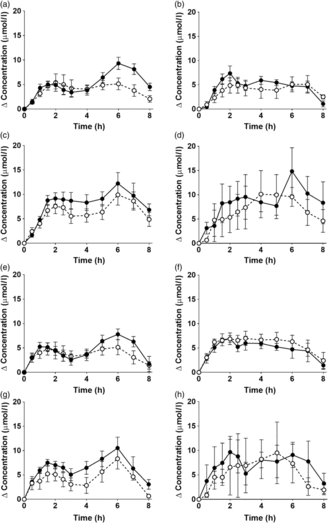
EPA and DHA concentrations in plasma TAG changed (both P < 0·0001) as expected during the postprandial period in all participant groups (Fig. 1, the results of statistical analyses are shown in online Supplementary Table S1). There were no significant single factor or interaction effects of the type of oil, or the sex or age of the participants on the postprandial changes in EPA and DHA concentration (Fig. 1, online Supplementary Table S1). The postprandial changes in EPA and DHA concentrations and in the combined concentrations of EPA + DHA in plasma TAG were summarised by calculating the incremental area under the time × concentration curve (iAUC) (Table 3). There were no significant single-factor effects of the type of oil or the sex of the participants on the iAUC of EPA concentration in plasma TAG, however there was a significant (P < 0·0001) effect of age (Table 3, the results of statistical analyses are shown in online Supplementary Table S2). Calculation of the marginal means for age showed that the TAG EPA iAUC was approximately 60 % greater (P < 0·0001) in older participants (60·9 (sem 4·6) μmol/l over 8 h) compared with younger participants (38·6 (sem 3·9) μmol/l over 8 h). There were no significant single-factor effects of the type of oil or the sex of the participants or significant interaction effects of age, sex and type of oil on the iAUC of DHA in plasma TAG (Table 3, online Supplementary Table S2). However, there was a significant single-factor effect of age on the iAUC of DHA concentration in plasma TAG (P = 0·03) (online Supplementary Table S2). Calculation of the marginal means for age showed that the TAG DHA iAUC was approximately 40 % greater (P = 0·03) in older participants (54·9 (sem 5·3) μmol/l over 8 h) compared with younger participants (39·1 (sem 4·6) μmol/l over 8 h). There was no significant difference between test oils in the iAUC for EPA + DHA in plasma TAG (Table 3, online Supplementary Table S2). There were no significant differences between sexes in the iAUC for EPA + DHA in plasma TAG, while the iAUC for EPA + DHA was greater in older compared with younger participants (Table 3, online Supplementary Table S2). These data are exemplified in the time versus concentration graph for EPA + DHA in plasma TAG (online Supplementary Fig. S2, the results of statistical analyses are shown in online Supplementary Table S1).
Table 3. Incremental area under the time × concentration curves (iAUC) of the incorporation of EPA and DHA into plasma TAG, phosphatidylcholine (PC) and NEFA*
(Mean values with their standard errors)

CSO, Camelina sativa seed oil; BFO, blended fish oil.
EPA and DHA concentrations in plasma PC changed as expected during the postprandial period (Fig. 2, online Supplementary Table S3; both P < 0·0001). There were no significant interaction effects between time after the meal and the type of oil, and the sex or age of the participants on postprandial EPA or DNA concentrations (Fig. 2, online Supplementary Table S3).
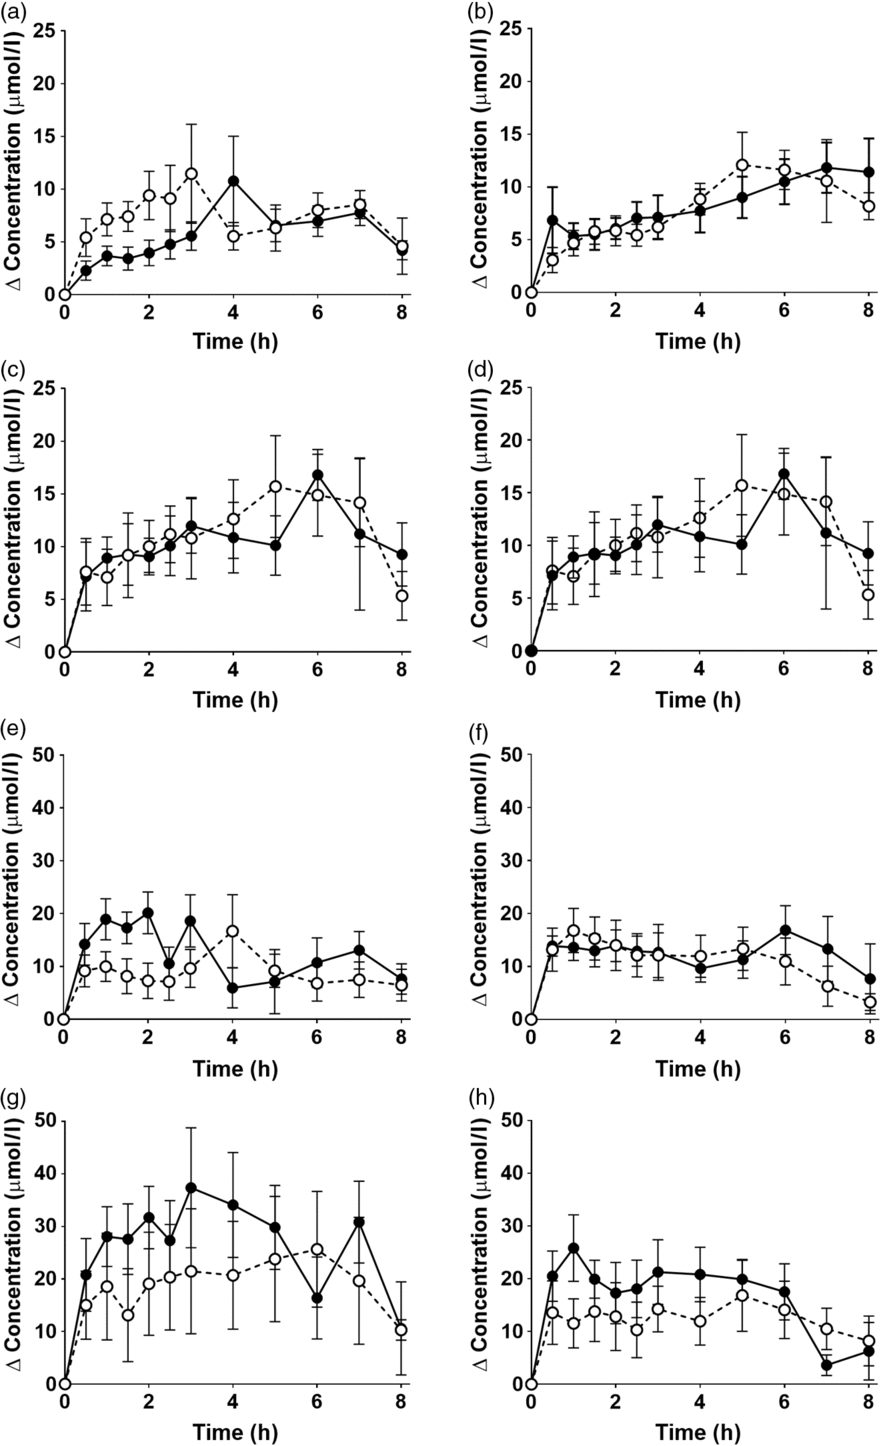
Fig. 2. Postprandial incorporation of EPA and DHA into plasma phosphatidylcholine. Values are changes in concentration from baseline of EPA (a–d) and DHA (e–h) in plasma phosphatidylcholine following consumption of test meals containing either Camelina sativa seed oil (-•-) or blended fish oil (--○--). (a) and (e), younger females (n 10); (b) and (f), younger males (n 10); (c) and (g), older females (n 10); (d) and (h), older males (n 6). Data are means, with standard errors represented by vertical bars. The results of statistical analysis by ANOVA with Bonferroni’s post hoc correction are described in online Supplementary Table S3.
There were no significant single-factor effects of the type of oil or the sex of the participants on the iAUC of EPA or DHA in plasma PC (Table 3, online Supplementary Table S4). There was a significant single factor significant effect of age on the iAUC of EPA (P = 0·01) and DHA (P = 0·005) in plasma PC (Table 3, online Supplementary Table S4). There were no significant interaction effects on plasma PC EPA or DHA iAUC (online Supplementary Table S4). Calculation of marginal means for age showed that the iAUC for EPA in plasma PC was 60 % greater in older participants (11 (SEM 1) μmol/l over 8 h) compared with younger participants (7 (SEM 1) μmol/l over 8 h). The marginal means for age also showed that the iAUC for DHA in plasma PC was 65 % greater in older participants (158 (SEM 16) μmol/l over 8 h) compared with younger participants (96 (SEM 14) μmol/l over 8 h). There was no significant difference between test oils in the iAUC for EPA + DHA in plasma PC (Table 3, online Supplementary Table S2). There were no significant differences between sexes in the iAUC for EPA + DHA in plasma TAG, while the iAUC for EPA + DHA was greater in older compared with younger participants (Table 3, online Supplementary Table S2).
Table 4. Lipoprotein concentrations and diameters
(Mean values with their standard errors)
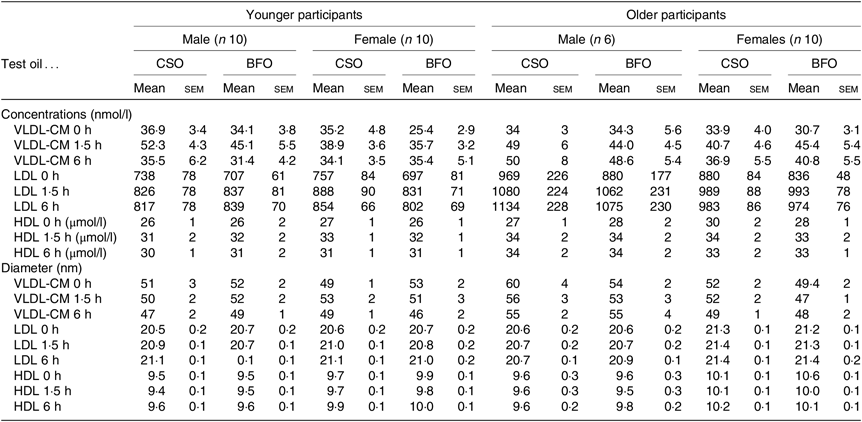
CSO, Camelina sativa seed oil; BFO, blended fish oil; CM, chylomicron.
* Values are concentrations and diameters of individual lipoprotein classes at baseline, and at 1·5 and 6 h after consuming a test meal containing either the CSO or BFO. The results of ANOVA with type of oil, sex and age as fixed factors, and time as a repeated measure with post hoc correction by Bonferroni’s method are provided in online Supplementary Table S7.
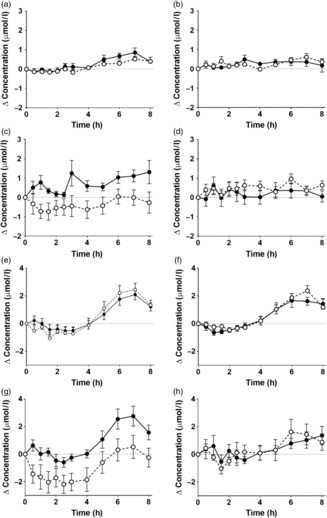
There was a significant effect of time on the concentrations of EPA and DHA in plasma NEFA (Fig. 3, online Supplementary Table S5; both P < 0·0001). However, there were no significant single-factor effects of the type of oil, nor the sex or age of the participants on the concentrations of EPA and DHA in plasma NEFA during the postprandial period (online Supplementary Table S5). There were no significant single-factor effects of the type of oil, nor the sex or age of the participants, nor any interaction effects between these factors on the iAUC of EPA or DHA concentrations in plasma NEFA (Table 3, online Supplementary Table S6). There was no significant difference between test oils in the iAUC for EPA + DHA in plasma NEFA (Table 3, online Supplementary Table S2). There were no significant differences between sexes in the iAUC for EPA + DHA in plasma TAG, while the iAUC for EPA + DHA was greater in older compared with younger participants (Table 3, online Supplementary Table S2).
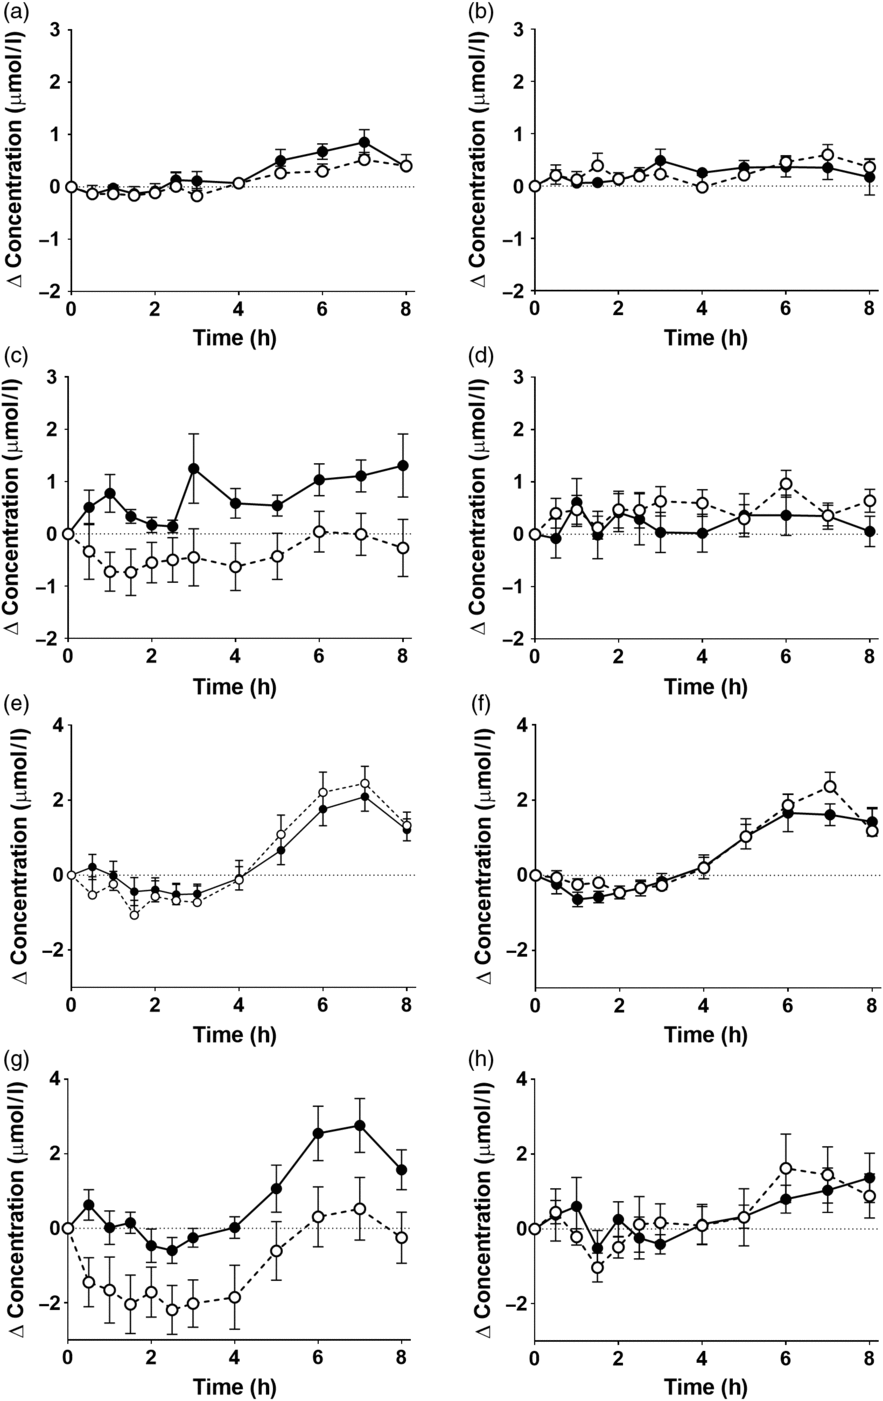
Fig. 3. Postprandial incorporation of EPA and DHA into plasma NEFA. Values are changes in concentration from baseline of EPA (a–d) and DHA (e–h) in plasma NEFA following consumption of test meals containing either Camelina sativa seed oil (-•-) or blended fish oil (--○--). (a) and (e), younger females (n 10); (b) and (f), younger males (n 10); (c) and (g), older females (n 10); (d) and (h), older male (n 6). Data are means, with standard errors represented by vertical bars. The results of statistical analysis by ANOVA with Bonferroni’s post hoc correction are described in online Supplementary Table S5.
The effect of the test oils on postprandial lipoprotein concentrations and diameters
VLDL-CM concentration changed significantly after consuming the test meals (both P < 0·0001) such that VLDL-CM concentration was greater at 1·5 h than at baseline (Table 4, online Supplementary Table S7). The change in VLDL-CM concentration was greater in older compared with younger participants (time × age P = 0·02) related to sex (P < 0·01), but not the type of oil consumed (time × oil × age × sex, P = 0·9) (Table 4, online Supplementary Table S7).
LDL concentration changed significantly after the test meals (both P < 0·0001) such that LDL concentration was greater at 1·5 h and at 6 h compared with baseline. However, there were no significant effects of the type of oil consumed, nor of the age or sex of the participants on the postprandial changes in LDL concentration (Table 4, online Supplementary Table S7).
There was a significant effect of time after the test meals (both P < 0·0001) on HDL concentration such that the levels at 1·5 and 6 h were greater than at baseline (Table 4, online Supplementary Table S7). There was no significant effect of the type of oil consumed, nor of the age or sex of the participants HDL concentration (Table 4, online Supplementary Table S7).
There was a significant effect of time after the meal (P = 0·001) on VLDL-CM (P = 0·001), LDL (P < 0·0001) and HDL (P < 0·0001) diameter (Table 4, online Supplementary Table S7). However, there was no significant effect the type of oil, nor of the type of oil nor the age and sex of the participants on postprandial VLDL-CM, LDL or HDL diameter (Table 4, online Supplementary Table S7).
The effect of the test oils on the postprandial inflammatory response
There were significant postprandial changes in the concentrations of TNFα, IL-6 and IL-10 (time × concentration all P < 0·0001), but not in the level of sICAM-1 (Fig. 4, online Supplementary Table S8). There were no significant effects of the type of oil nor of the sex of the participants in the postprandial changes in TNFα, IL-6 and IL-10 or sICAM-1 concentrations (online Supplementary Table S8).

Fig. 4. Concentrations of (a, b) TNFα, (c, d) IL-6, (e, f) soluble intercellular adhesion molecule-1 and (g, h) IL-10 in plasma following consumption of test meals containing either Camelina sativa seed oil (-•-) or blended fish oil (--○--) from younger male (b, d, f, h) or female (a, c, e, g) participants aged 18–35 years (n 10/group). Data are means, with standard errors represented by vertical bars. The results of statistical analysis by repeated-measures ANOVA with Bonferroni’s post hoc correction are described in online Supplementary Table S8.
Discussion
The findings of this study showed that EPA and DHA, when measured either as individual fatty acids or when combined, have equivalent incorporation into blood lipids when consumed as CSO as when consumed as BFO. Although the amount of EPA in the CSO test meal was greater than in the BFO meal, and conversely for DHA, the magnitude of this difference was not sufficiently great to result in statistically differences between oils in the postprandial incorporation of these fatty acids into plasma lipids. EPA and DHA were incorporated into plasma TAG and PC during the postprandial period, which primarily represents secretion into the circulation of fatty acids derived from a meal. The baseline concentrations of EPA and DHA and the iAUC for postprandial EPA and DHA concentrations in PC were consistently greater than in TAG (iAUC EPA, approximately 1·6-fold; iAUC DHA, approximately 3-fold). This is consistent with previous reports that showed EPA and DHA incorporation into plasma PC was greater than TAG after fasting and during the postprandial period( Reference West, Burdge and Calder28 , Reference Schuchardt, Schneider and Meyer30 , Reference Nordoy, Barstad and Connor31 ) and suggests that EPA and DHA are preferentially incorporated into PC during chylomicron and VLDL assembly. One alternative possibility is that EPA and DHA esterified to TAG may be turned over faster than when esterified to PC. Nevertheless, there was no significant effect of the type of oil consumed on incorporation of EPA and DHA in plasma TAG or PC. In fish oil, almost all of the DHA and 44 % of EPA are esterified at the sn-2 position( Reference Bottino32 ). By contrast, in CSO, EPA and DHA are esterified predominately at the sn-1 or 3 positions (sn-1 plus sn-3:sn-2; EPA 3:2, DHA 3:1)( Reference Ruiz-Lopez, Haslam and Napier19 ). Fatty acids that are esterified at the sn-1 or -3 positions can have greater incorporation into plasma TAG, than those at the sn-2 position due to the lower accessibility of the sn-2 position to pancreatic and lipoprotein lipases( Reference Nilsson-Ehle, Egelrud and Belfrage33 , Reference Yang and Kuksis34 ). Thus, it may be anticipated that EPA and DHA from CSO may be greater than from BFO. Moreover, the BFO contained substantially more 14 : 0 and 18 : 0, and less 18 : 2n-6 and less 18 : 3n-3 than the CSO. Such differences in the composition of the TAG between oils could alter the access of lipases to the glycerol to EPA or DHA bonds. However, based on the incorporation of EPA and DHA into plasma TAG and PC, any differences in the composition and structure of the test oils did not significantly alter their digestion, absorption or transport in blood of EPA and DHA.
Incorporation of EPA and DHA into the plasma NEFA pool during the postprandial period reflects incomplete entrapment of fatty acids released by lipoprotein lipase activity, particularly that associated with adipose tissue( Reference Evans, Burdge and Wootton35 ). Incorporation of DHA into the NEFA pool during the postprandial period has been shown to be greater than EPA( Reference Burdge, Sala-Vila and West36 , Reference Heath, Karpe and Milne37 ), which has been suggested to explain the higher incorporation of DHA than EPA into VLDL TAG after a meal( Reference Heath, Karpe and Milne37 ). The present findings are consistent with the observation that DHA is incorporated preferentially into the plasma NEFA pool after a meal, but there appeared to be no selective incorporation of EPA or DHA into plasma TAG, which may be because chylomicrons and VLDL particles were not analysed separately in the present study. There was no significant difference between the test oils in the incorporation of EPA and DHA into plasma NEFA. If it assumed that this reflects the product of lipoprotein lipase activity and the efficiency of cellular entrapment, then these findings suggest equivalent uptake and partitioning of EPA and DHA by peripheral tissues when consumed as CSO or BFO.
The participants showed similar tolerance of the test meals irrespective of whether they contained CSO or BFO. Moreover, few health events were noted, none of which was likely to be related to participation in the study per se. We measured two outcomes that, if altered by the test meals could indicate an adverse effect on health. Consumption of a meal containing fish oil can reduce VLDL particle size and increase VLDL concentration during the postprandial period( Reference Burdge, Powell and Dadd25 ). Our findings show expected changes in VLDL-CM, LDL and HDL concentrations and sizes after the test meals, but there were no significant differences between the test oils. This suggests that the effect on lipoprotein size and concentration of consuming a meal containing CSO was equivalent to consuming a meal containing BFO. Moreover, there were no changes in lipoprotein size or concentration that would indicate a potentially harmful effect of consuming CSO.
Consuming a test meal has been associated with an increase in the concentrations in blood of specific inflammatory markers, in particular TNFα, IL-6, ICAM-1 and IL-10( Reference Burdge and Calder26 , Reference Telle-Hansen, Christensen and Ulven38 ). This inflammatory response has been suggested to be due to the lipid component of a meal, possibly reflecting the level of lipid peroxidation( Reference Esposito, Nappo and Giugliano39 , Reference Nappo, Esposito and Cioffi40 ), although the underlying mechanism and the consequences for health are uncertain. The present findings in the younger age group showed that consuming the test meal induced an increase in the concentrations of TNFα, IL-6 and IL-10, but not sICAM-1 which was consistently below the detection limit of the assay. However, the magnitude of the change in the concentrations of these inflammatory markers did not differ between meals containing different test oils. This suggests that the postprandial inflammatory response that is induced by a meal containing CSO was no greater than a meal containing BFO.
There was no effect of the sex of the participants on any of the outcomes that were measured, which implies that the present findings may be of general relevance to the population. However, the baseline and postprandial (iAUC) EPA and DHA concentrations in plasma TAG and PC were greater in older participants than in the younger age group. This is in agreement with previous findings that showed EPA and DHA incorporation into plasma PC following 12 weeks dietary supplementation with fish oil was greater in men aged 53–70 years than those aged 18–42 years( Reference Rees, Miles and Banerjee41 ). This has been suggested to be due to slower turnover of EPA and DHA in plasma in older compared with younger participants( Reference Rees, Miles and Banerjee41 ). By contrast, there was no significant effect of age on the iAUC of EPA and DHA in plasma NEFA. One possible interpretation is that entrapment of EPA and DHA by tissues may be greater in older compared with younger participants. This suggestion is supported by the observation that the proportions of 22 : 5n-3 and DHA in adipose tissue increase with age in men and women consuming their habitual diets( Reference Bolton-Smith, Woodward and Tavendale42 ) and by the present observation that baseline EPA and DHA concentration in plasma NEFA was higher in older compared with younger participants.
These findings show that, despite differences between test oils in fatty acid composition and the positional distribution of EPA and DHA( Reference Ruiz-Lopez, Haslam and Napier19 , Reference Bottino32 ), the postprandial metabolism of these fatty acids when consumed as CSO in an amount comparable with the UK recommended intake for EPA + DHA( 4 ) was equivalent that to when consumed as BFO. Hence, the present findings are of direct relevance to current UK and other nutritional guidelines. Since humans require an adequate supply of dietary EPA and DHA for health, one important implication of these findings is that they provide direct evidence to support the view that consuming this oil from transgenic C. sativa could provide a sustainable, scalable and apparently safe solution to meeting global demands for EPA and DHA. If so, a further implication is that oils containing EPA and DHA from transgenic plants could reduce demands on limited marine resources and the negative effects of specific restrictive dietary choices and concerns about environmental pollutants on EPA and DHA status.
Supplementary material
For supplementary materials referred to in this article, please visit https://doi.org/10.1017/S0007114519000825
Acknowledgement
The authors wish to thank the people who participated in this study for their time and commitment.
This work was supported by grants from the Biotechnology and Biological Sciences Research Council BB/N014081/1 and BB/N01412X/1.
G. C. B. has received research funding from Nestle, Abbott Nutrition and Danone. He has served as a member of the Scientific Advisory Board of BASF and is a member of the BASF Asia-Pacific Grant Award Panel. P. C. C. acts as a consultant to BASF AS, Smartfish, DSM, Danone and Fresenius-Kabi. J. A. N. has provided ad hoc consultancy services to BASF.
G. C. B., P. C. C., E. A. M. and J. A. N. designed the study. A. L. W. carried out the dietary intervention and the laboratory analysis. O. S. designed the genetic construct used to engineer C. sativa, L. H. was responsible for transformation, selection and husbandry of the transgenic plants. G. C. B. analysed the data and wrote the first draft of the manuscript. All authors contributed to the final version of the manuscript.
The authors declare that they have no conflicts of interest with the research reported in this article.


