INTRODUCTION
Tuberculosis (TB) is still a major health problem at a global scale, being the 11th cause of death worldwide in 2011 [1]. In 1993, due to an increasing trend of TB infections, a global emergency was declared by the World Health Organization (WHO). Since then, progress has been observed towards the reduction of new cases and consequent deaths [2]. The current key goal of the strategy for TB prevention and control after 2015 is to end the global TB endemic, reducing 95% of TB deaths and 90% of TB incidence by 2035 relative to 2015. These targets can only be achieved with a very ambitious global trend of at least −10% per year, considering the current global trend of −1·5% [3–5]. Transmission between individuals is mainly dependent on sputum-positive pulmonary cases (either smear or culture positive), hence to control the endemic it is mandatory to reduce pulmonary TB (PTB) [Reference Rieder6, Reference Briz7].
Western Europe is not a region with a high burden of TB. In the last decade, Portugal has been showing a slow but consistent reduction in notified incidences, and treatment success rates of ⩾85% for culture-positive cases. However, it still has one of the highest incidences in the European Union, and is classified as a medium- to low-level endemic country [Reference Duarte and Diniz8]. The Portuguese control programme is supported by a nationwide information surveillance system, and, since 2000, evaluated on a yearly basis according to WHO guidelines. According to the most recent report, in 2012 the decreasing Portuguese TB incidence rate was 21·6/100 000 population and the treatment success rate was 81·4% [Reference Duarte and Diniz8].
TB risk is frequently associated with characteristics such as HIV infection, overcrowding, immigrant flow from higher prevalence regions, and poor living conditions, and is typically present in urban areas [Reference De Vries9–Reference Geng11]. This may explain why cases are not evenly distributed in geographical and time units, and tend to concentrate in cities [Reference Menzies12]. From a health management viewpoint, this heterogeneity plays an important role in the decision process, meaning that different geographical areas may need distinctly tailored control programmes, depending on the endemic degree and its evolution, and on the prevalence of risk factors, among other specificities [Reference Rangan, Gupte and Bandiwadekar13].
Spatial epidemiology describes and analyses geo-referenced data, and includes three main inter-related approaches: the mapping of diseases and their determinants; the study of geographical correlations; and clustering analyses [Reference Elliott and Wartenberg14]. Spatial and space–time clustering analysis detects events clusters, highlighting areas with a number of events significantly distinct from what would be expected. These methods have been used in a vast spectrum of sciences, such as ecology [Reference Tonini, Tuia and Ratle15] and criminology [Reference Assunção, Marinho and Reis16], identifying areas that differ in some dimension, in a non-random way [Reference Nunes17]. During the last decade, studies using spatio-temporal clustering techniques applied to the health domain have been intensely developed leading to encouraging achievements [Reference Sheehan and Dechello18, Reference McNally, Ducker and James19]. Within this methodological research area, the relatively new approach ‘spatial variation in temporal trends' is now maturing, allowing the identification of the clustering of geographical units according to a common trend that is significantly different from trends in outside areas (the null hypothesis assumes that trends are all equal) [Reference Kulldorff20, Reference Moraga and Kulldorff21]. This method allows the identification of distinct temporal trends in a global geographical area, being a very useful tool for epidemiological surveillance and disease control; it reveals, for example, areas where health programmes are being more successfully implemented, or where new problems are emerging [Reference Moraga and Kulldorff21].
Space–time clustering and spatial variation in temporal trends have different objectives, but are quite complementary. In countries with a relatively good TB surveillance system, these space–time analyses may play an important role in identifying areas with meaningful epidemiological phenomena, not explained by randomness, promoting a richer knowledge to aid public health decision-makers, who may support strategic interventions more appropriately [Reference Buehler22].
Portugal is thought to have a good such system, with a high detection rate, as mentioned [2]. In a previous study, critical spatio-temporal area clusters of higher TB incidence in mainland Portugal, in 2000–2004, identified in the Lisbon and Oporto metropolitan regions, were the most relevant [Reference Nunes23]. This study intended to verify if these previously identified areas remained as critical; if there were new critical areas; and, more importantly, to describe their time evolution. Spatio-temporal clustering allows the identification of critical areas in a space–time context but it does not allow characterization of their evolution in time. This issue is very important in the assessment of critical areas but also in other non-critical areas, allowing the identification of different patterns other than the national pattern. The use of these two methods together constitutes a very powerful tool in terms of public health knowledge. Therefore, this study adds more knowledge, describing how critical incidence areas evolve and characterizing distinct regional time trends, compared to the national pattern.
This study aimed to contribute to health management improvement and focused on PTB only, as a proxy for contagious tuberculosis. Objectives were: to identify spatio-temporal municipality-years notified incidence rate clusters in 2000–2010; to find possible spatial clusters of incidence trends in the same period; and to demonstrate and discuss the potential of these two methods, when applied in close conjunction, as an epidemiological aid to public health management.
MATERIALS AND METHODS
The variable used in this study was the annual rate of reported PTB cases/100 000 population, between 2000 and 2010, as a proxy of the PTB incidence rate. The rate of reported PTB cases was calculated considering:
-
• As numerator: the annual number of reported cases of PTB, by municipality of residence of each patient, obtained from the National Tuberculosis Surveillance System, General Directorate of Health, Ministry of Health.
-
• As denominator: the population of each municipality according to the 2001 Census or estimations for the other years, obtained from the database of Statistics Portugal.
Geographical time units were mainland Portugal municipality-years (n = 278 × 11 years).
After a descriptive exploration, two different clustering models were used: the first was classical space–time clustering of incidences, updating and narrowing the focus of previous information [23, 24]; the second was spatial variation in temporal trends clustering, both based on Kulldorff's statistical methodology, and adjusting for sex [Reference Moraga and Kulldorff21, Reference Kulldorff25]. Adjustments for age were not feasible, due to the low number of cases notified in many municipalities annually, globally and per age group. SaTScan™ software was used and circular window shapes were applied [Reference Kulldorff26].
Conventional analyses of spatial variation in temporal trends use linear trend functions, but other methods are being developed [Reference Moraga and Kulldorff21]. As a first approach and based on previous descriptive studies [Reference Duarte and Diniz8], such linearity was assumed here. Using SatScan, mean annual percentage changes for clusters of municipalities were calculated and their significance compared to their neighbours was tested.
Particular attention was given to spatial clusters of temporal trends involving municipalities belonging to critical areas, as previously identified [Reference Nunes23], because they might make a greater contribution to the evolution of the national PTB endemic.
A first clustering analysis was performed for the whole period 2000–2010. Then, this period was split into two smaller periods, in order to discover the consistency of clusters found and the respective short trends. The cut-off point was chosen according to the prior space–time clustering analysis experience. It was assumed that PTB detection was stable in space and time. Results were mapped with the Epi Info™ software [27].
Ethical considerations
Ethics committee approval and informed consent were not required, as data was based on an Official National Surveillance System and was previously anonymized and grouped at municipality level.
RESULTS
Table 1 shows some descriptive statistics of incidence rates: municipalities with the highest or the lowest PTB rates, as well as averages, medians and standard deviations from 2000 until 2010, yearly and globally. The municipality with the highest PTB rate each year varied throughout time. Each year, a proportion of between 17·6% and 28·4% of the 278 municipalities had 0 cases of PTB. Moreover, higher PTB rates are concentrated in a few municipalities and this concentration of cases seems to become more evident with time.
Table 1. Description of pulmonary tuberculosis (PTB) rates/100 000 population in the 278 municipalities of continental Portugal, globally and yearly
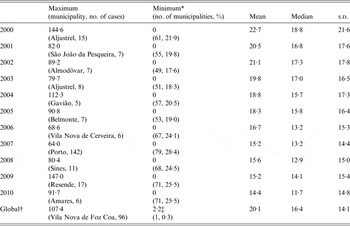
s.d., Standard deviation.
* The names of the municipalities are not presented due to the high number of municipalities with the minimum PTB rate.
† All municipalities, across all years.
‡ The global minimum of PTB rate is not 0, as none of the municipalities had 0 PTB cases during the whole 10-year period.
Figure 1 shows the space–time clusters of higher rates of notified PTB, in three periods: 2000–2010, 2000–2004 and 2005–2010 (cut-off point: 2004/2005).
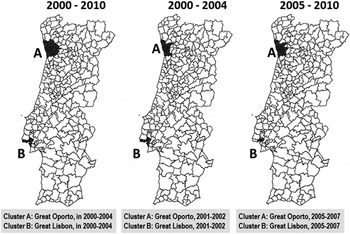
Fig. 1. Space–time clusters of higher rates of notified pulmonary tuberculosis cases, adjusted for sex, in three time periods (2000–2010, 2000–2004 and 2005–2010).
When space–time clustering is applied to the whole period of 2000–2010, Oporto (cluster A) and Lisbon (cluster B) metropolitan areas were identified as critical in 2000–2004 (P < 0·001), with an observed/expected ratio of 1·91 and 1·92, respectively. Applying the same analysis to the first half of 2000–2004, similar critical areas were found to cluster in 2001–2002 (P < 0·001), with observed/expected ratios of 1·83 (Oporto) and 1·69 (Lisbon). In 2005–2010, the similar two critical areas clustered in 2005–2007, with an observed/expected ratio of 1·84 for Oporto and 1·96 for Lisbon (P < 0·001) regions.
Regarding the spatial variation in temporal trends of PTB, Table 2 gives results for the three periods studied. Figures 2, 3 and 4 show incidence rate trends and their spatial distribution, adjusted for sex, in the three periods.
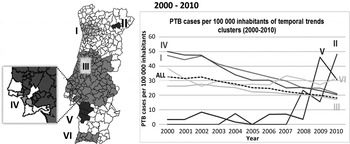
Fig. 2. Spatial variation in temporal trends of pulmonary tuberculosis (PTB) incidence rates, adjusted for sex, in 2000–2010.
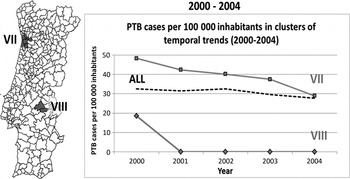
Fig. 3. Spatial variation in temporal trends of pulmonary tuberculosis (PTB) incidence rates, adjusted for sex, in 2000–2004.
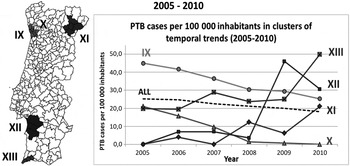
Fig. 4. Spatial variation in temporal trends pulmonary tuberculosis (PTB) incidence rates, adjusted for sex, in 2005–2010.
Table 2. Space clusters of temporal trends of pulmonary tuberculosis (PTB) incidence rates found in 2000–2010, 2000–2004 and 2005–2010, adjusted for sex. Negative and positive percentages correspond to decreasing or increasing trends, respectively
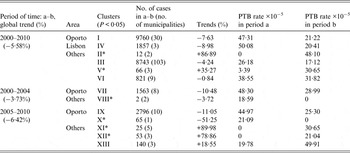
* ‘Small’ clusters (annual average of PTB cases <10).
During 2000–2010, a −5·58% mean annual percentage change in rate was observed. Only two clusters of increasing trends were found: cluster II (86·89%), and cluster V (35·27%) (Fig. 2); but due to the small numbers of cases, these results must be interpreted with caution.
Clusters I, III, IV, and VI showed significant decreasing trends of PTB incidence. Clusters III and VI showed a slower decreasing average annual trend, when compared to the country global average annual trend, with rates of −4·24% and −0·84%, respectively (Fig. 2). Clusters I and IV were decreasing faster than the rest of the country, achieving rates with values of −7·63% and −8·98%, respectively.
In 2000–2004, the entire country showed a mean annual percentage change in rate of −3·73%. There were two significant clusters with decreasing annual percentages: cluster VII (−10·48%), and cluster VIII (−3·72%). Cluster VII reached the global country's incidence rate, while cluster VIII showed a decrease in rates from 20 to 0 cases/100 000 population (based on two PTB cases only) (Fig. 3).
In 2005–2010 (Fig. 4), the whole country showed a mean annual percentage change in rate of −6·42% and five clusters were identified: two of decreasing trends and three of increasing trends. Clusters IX and X showed decreasing annual average trends of 11·05% and 51·25%, respectively. Clusters XI, XII and XIII showed increasing trends of 89·98%, 78·86% and 18·55%, respectively. Non-adjusted clustering analyses was also performed, which led to identical results.
DISCUSSION
Although presenting deceasing trends, Oporto and Lisbon urban areas continue to be the most critical regions for PTB, in agreement with a previous study [Reference Nunes23]. Additionally this paper points out two more important results: temporal evolutions of these critical areas and other regions (non-critical areas) that have non-compliant trends compared to the rest of the country.
Critical areas, identified through space–time clustering, were not totally consistent with the municipalities with the maximum rates obtained in the descriptive approach, except for Oporto in 2007. It was observed that some municipalities with high PTB rates had few cases and small populations, producing inconstant variations over time. Space–time clustering is preferred for identifying critical areas, as it uses appropriate distribution models to deal with small numbers [Reference Moraga and Kulldorff21]. Space–time clustering findings regarding 2000–2010 were consistent with those from previous national studies [Reference Couceiro, Santana and Nunes10, Reference Nunes23, Reference Nunes28], identifying Oporto and Lisbon metropolitan regions as the most critical areas.
Globally, there was a mean annual percentage change in rate of −5·58%, although in 2005–2010 a better evolution towards TB control seems to have occurred compared to 2000–2004. Cluster I (2000–2010) presented a mean annual percentage change in rate of −7·6%. This cluster included all municipalities belonging to the Oporto metropolitan region, previously identified as a critical area; moreover, most of its municipalities presented significant declines when the 11-year period was split. Clusters IX and X, also belonging to the Oporto area, are neighbouring areas, but did not behave like a single cluster, because they showed different patterns over time (Fig. 4). This deserves further investigation, because it may be explained by either a growing under-detection or an effective control in cluster X. In any case, the Oporto region demonstrated a remarkable success in reducing its endemic state. In Lisbon, three of the municipalities previously identified in this critical incidence cluster presented a steep decline of incidence (cluster IV) while the other half was identified in cluster III, which had a decreasing trend more similar to the country trend. Such facts suggest some heterogeneity inside the critical area of Lisbon region, regarding control evolution, which warrants a closer look. The Lisbon cluster was identified as having the best decreasing trend in 2000–2010; but, when the period was split up, this cluster disappeared. Meanwhile, the Oporto cluster had a gentler decline in 2000–2010, but was consistent in all periods, suggesting a more robust decreasing trend.
Trends in non-critical areas must also be discussed, because they experienced a large variation in their incidence rates, mainly concentrated in 2008–2010. Although on a national scale their numeric impact would be unimportant, these increases might be due to some occasional active screenings or detection issues and should be explored. Likewise, the impact of small numbers in spatial variations of temporal trends, as evidenced by these methods, is not negligible, due to the fact that they compare municipality-year rates throughout the period studied [Reference Kulldorff26]. Although this method is designed to meet the problem of small numbers (using Poisson distribution), a careful interpretation and future studies must be considered [Reference Moraga and Kulldorff21].
Detection biases may be present, as this study relies on compulsory TB notification by health professionals. According to WHO estimates, the global detection rate in Portugal was high (87–91%, in 2000–2010) [2, 29]; however, some internal heterogeneity in space and time was possible, thus limiting the evidence interpretation to an unknown extent. But space–time incidence variations found will be mostly due to heterogeneous levels of success in implementing national control guidelines, or different local exposures to relevant risk factors, namely immigration [Reference Lillebaek30, Reference Dias31]. Major validity and precision issues possibly coming from the surveillance system itself deserve a specific study and improvement. Assuming that areas with more steeply decreasing PTB trends are actually the regions with better programme implementation and not simply due to relevant differences in risk-factor pressures, the programmes of Oporto and a part of the Lisbon metropolitan regions should be included in the design of future strategies.
The methodological components applied in this study, combining space–time clustering and spatial variation in temporal trends, allow the identification of areas (space or space–time) where major problems are (and to quantify them), and of areas with temporal trends different from the rest of the country. It is also important to highlight the capacity of the second method to detect potential new TB outbreaks and these areas should receive special surveillance in the near future, to understand the causes and/or to distinguish them from situations arising from the better performance of health services in notification or the problem of small numbers (mathematically unstable). Viewing the Portuguese setting as a specific case study, some general methodological evidences were obtained. The appropriate, integrated application of these clustering methods (whose internal validity was duly discussed by Moraga and Kulldorff [Reference Moraga and Kulldorff21, Reference Kuldorff24]) revealed a competent and useful discrimination in contrasting regions regarding endemic states and disease evolutions in the population, as illustrated here. This feature empowers a more detailed knowledge, a smaller risk of artefact evidences and, therefore, more precise and sounder management decisions.
CONCLUSIONS
The two PTB critical areas in mainland Portugal in 2000–2004, the Lisbon and Oporto metropolitan regions, identified in a previous study [Reference Nunes23], were confirmed in this 2000–2010 study. The 2000–2010 global incidence trend declined at a mean annual percentage change in rate of −5·81%, with a high heterogeneity in time and space: such decline was steeper during 2005–2010 and municipalities clustered rather differently as to their time trends, not due to chance. Municipalities with incidences declining more rapidly belonged to critical areas; in particular, the Oporto region, with a more severe situation, had a consistent, significant decrease in 2000–2010 (8·98%), strongly suggesting that local control measures had achieved good results.
Clusters with increasing trends comprised a small number of municipalities, with little contribution to the global trend. Such clusters should be analysed more closely, as their trends may be explained by small number artefacts, an improving detection rate, administrative issues or real outbreaks. Two other trend clusters followed the global one quite closely. Health services in all these clusters should review their practices, with the aim of achieving better control.
The joint analysis of results from these two approaches raises very promising prospects for the design of future interventions. The integrated application of both clustering approaches demonstrated their interesting complementarity, yielding synergic information from their specific perspectives of the same phenomena. In fact, together, they provide improved knowledge for programme effectiveness evaluation and geographical priority setting, through: (1) the identification and discrimination of space–time clusters of events, allowing for randomness and free of graphic representation artefacts; (2) the discrimination of time trend clusters of geographical units differing significantly, thus breaking down global trends when these hide geographical heterogeneity. Their major potential resides in their joint interpretation and it can usefully be extended to other public health areas when resources optimization is at stake.
ACKNOWLEDGEMENTS
The authors are grateful to the coordinators of the National Programme for Tuberculosis Control for access to Tuberculosis Surveillance Database. This study was supported by Fundação para Ciência e Tecnologia (Project PTDC/SAU-SAP/116950/2010).
DECLARATION OF INTEREST
None.


