The use of dietary patterns as measures of exposure in studies of diet and disease is proving a valuable alternative to the measurement of single nutrients or foods(Reference Jacques and Tucker1, Reference Hu2). Patterns are defined either a priori, commonly based on current concepts of desirable eating habits such as the Healthy Diet Indicator(Reference Huijbregts, Feskens, Räsänen, Fidanza, Nissinen, Menotti and Kromhout3) or a Mediterranean diet score(Reference Trichopoulou, Costacou, Bamia and Trichopoulos4), or a posteriori from patterns of foods identified using data-reduction methods. These include principal component analysis (PCA) and cluster analysis, and more recently advanced methods such as reduced rank regression(Reference Hoffman, Boeing, Boffetta, Nagal, Orfanos, Ferrari and Bamia5) and the conditional Gaussian mixture model(Reference Fahey, Thane, Bramwell and Coward6).
Dietary patterns analyses are considered a useful tool in nutritional epidemiology for several reasons. Specific relationships between diseases and individual foods or nutrients are hard to identify due to the high correlations between nutrients and foods; the possibility of synergistic actions of nutrients or foods when combined in meals(Reference Jacobs and Steffen7) may be even more difficult to identify with conventional analyses. Techniques such as PCA and cluster analysis instead use the correlations between foods and nutrients to advantage. They allow us to consider the complete diet. Perhaps the most useful aspect of dietary patterns analysis is that the observed patterns represent real dietary habits and patterns of food choice, and are therefore of direct relevance to the formulation of future public health messages. Furthermore, dietary patterns have been shown to be predictive of mortality, morbidity and disease-related biomarkers, although the magnitude of risk reduction is relatively modest and may be attenuated somewhat after controlling for confounders(Reference Kant8).
To date, most dietary patterns analyses have used FFQ data; few comparisons have been made with dietary patterns derived using other methods of dietary assessment. FFQ have become the principal method of dietary assessment in large population studies, as they are far less labour-intensive than prospective, open-ended dietary methods such as food diaries. Whilst cheaper to administer, FFQ also have the advantage that by summarising data over a longer period of time they may better describe habitual diet than assessments over shorter periods. Additionally they may be more accessible to the wider population. Prospective methods, such as food diaries when completed by motivated and able participants, provide the most accurate assessment of intake but may, in general population studies, be associated with poor return rates(Reference Henderson, Gregory and Swan9).
Clearly the obvious advantages of FFQ must not conceal their limitations. They lack the detail of prospective records and there are concerns that estimates of nutrient intake lack accuracy, to the point that nutrient–disease associations may be obscured(Reference Bingham, Luben, Welch, Wareham, Khaw and Day10, Reference Kipnis, Subar, Midthune, Freedman, Ballard-Barbash, Troiano, Bingham, Schoeller, Schatzkin and Carroll11). It is important to assess whether these characteristics of the FFQ impact on their ability to describe broad dietary patterns. Previously Hu et al. (Reference Hu, Rimm, Smith-Warner, Feskanich, Stampfer, Ascherio, Sampson and Willett12) and Khani et al. (Reference Khani, Ye, Terry and Wolk13) have found uncorrected correlation coefficients ranging between 0·34 and 0·73 in US and Swedish studies of older men and women for dietary patterns identified using FFQ and 1-week diet records, suggesting good agreement. Since both similarities and differences in dietary patterns have been described between countries(Reference Slimani, Fahey and Welch14, Reference Bamia, Orfanos and Ferrari15) we need comparable data on the relative validity of dietary patterns identified in the UK.
We have compared dietary patterns derived from interviewer-administered FFQ and prospective 4 d food diaries collected from a general population sample of 585 pregnant women. We report on the first two dietary patterns identified using PCA and compare the findings from the two dietary assessment methods.
Subjects and methods
Study sample
The study sample was recruited from women aged 16 years or older booked for delivery under two consultants at the Princess Anne Maternity Hospital (Southampton, UK) between October 1991 and October 1992(Reference Robinson, Godfrey, Osmond, Cox and Barker16). A trained research nurse visited the women at home in early pregnancy (median gestation 15·3 weeks). Food intake over the preceding 3 months was assessed using an interviewer-administered 100-item FFQ. Prompt cards were used to ensure standardised responses to the FFQ. Following the visit a diary was kept of all the food and drink consumed for a period of 4 d. Further details of the FFQ and food diaries are given by Robinson et al. (Reference Robinson, Godfrey, Osmond, Cox and Barker16).
Information about health and lifestyle was collected at the early pregnancy interview, including details of the woman's education and smoking. Each woman was asked to estimate her body weight at her last menstrual period and her height was measured with a stadiometer at the antenatal clinic. The woman described any nausea and vomiting she had experienced since conception as ‘none’, ‘mild (nausea only)’, ‘moderate (occasional vomiting)’ or ‘severe (frequent vomiting)’. The food diaries were categorised by the research nurse who collected and reviewed them as ‘excellent’, ‘good’ or ‘poor, probably incomplete’. The study was approved by the local research ethics committee.
Dietary analyses
All foods and drinks recorded in the food diaries were allocated to the 100 FFQ groups to create an equivalent 4 d frequency of consumption of the 100 foods and food groups listed on the FFQ. For some constituents of cooked dishes (for example, flour, herbs, spices) it was not possible to assign them to an equivalent food group as they had been coded as separate items for the diary nutrient analyses. These constituent items were excluded from the analyses described here. A second difference was that fried food in food diaries were coded separately from the frying fat, whereas in the FFQ these constituents were not separated.
For both the diary and FFQ data, the 100 foods and food groups were combined into forty-nine food groups on the basis of similarity of nutrient composition and comparable usage. Skimmed and semi-skimmed milks were combined in one ‘reduced-fat milk’ group, and all ‘low’ and ‘very-low’ fat spreading fats were combined in one ‘reduced-fat spreading fat’ group.
Principal component analysis
PCA is a statistical technique that produces new variables that are uncorrelated linear combinations of the dietary variables that maximise the explained variance(Reference Joliffe and Morgan17). Cluster analysis is an alternative method of dietary patterns analysis to PCA. The continuous nature of PCA has been seen to be advantageous to a two-cluster solution resulting from a cluster analysis of dietary data(Reference Crozier, Robinson, Borland and Inskip18). PCA was therefore used to derive dietary patterns. PCA was performed on the reported frequencies of consumption of the forty-nine foods and food groups, based on the correlation matrix in order to adjust for unequal variances of the original variables. Individual dietary pattern scores were calculated by multiplying the coefficients for the forty-nine food groups by the individual's standardised reported frequencies of consumption. The scores were transformed using Fisher–Yates normal scores(Reference Armitage and Berry19). These have the effect of mapping the scores onto a normal distribution with a mean of 0 and a standard deviation of 1. Statistical analysis was performed using Stata 9·2 (StataCorp, College Station, TX, USA)(20). Two-sided significance tests were used throughout.
Results
Study sample characteristics
A total of 662 women were approached to take part in the study, of whom 655 fulfilled the entry criteria for our previous study of fetal growth(Reference Godfrey, Robinson, Barker, Osmond and Cox21). Of those, 617 agreed to take part and provided full FFQ responses and 588 completed all 4 d of the food diary. There were complete pairs of FFQ and diary data available for 585 women (88 %).
The characteristics of the women studied are shown in Table 1. The mean age of the women was 26·4 (range 16·3–43·3) years and 25 % of them were smokers at the time of the interview. Most women were nauseous in early pregnancy (84 %) although most commonly the nausea was mild (38 %). Of the women, 39 % had A levels (advanced levels) or equivalent qualifications, or higher.
Table 1 Characteristics of 585 women studied in early pregnancy
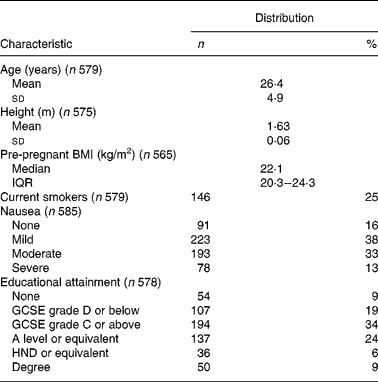
IQR, interquartile range; GCSE, general certificate of secondary education; A level, advanced level; HND, higher national diploma.
Principal component analysis
Table 2 shows the coefficients for the first two principal components of the FFQ and food diary data. The first two FFQ principal components explained 8·7 and 7·2 % of the variation in the FFQ data, substantially more than the third (3·7 %) and subsequent components. The first two diary principal components explained 9·6 and 4·7 % of the variation in the diary data. Since the third, fourth and fifth components of the diary data explained similar amounts of variation as the second component (4·1, 3·7 and 3·5 % respectively), these were investigated further, but no interpretable dietary patterns were found (data not shown). The first two diary components were retained for comparison with the FFQ data.
Table 2 Principal component analysis coefficients for components 1 and 2 for the food-frequency questionnaire and diary data
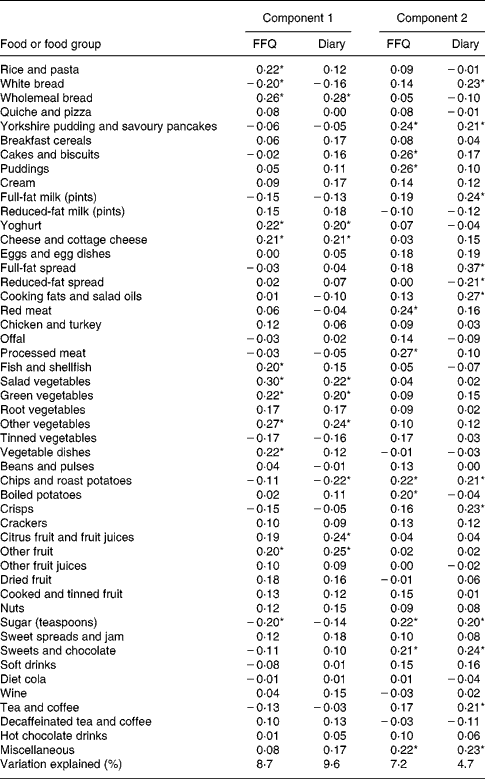
* Coefficients of 0·20 or greater in absolute value.
PCA of the FFQ data yielded a first component that was characterised by large positive coefficients for fruit and vegetables, wholemeal bread, rice and pasta, yoghurt, cheese, fish and reduced-fat milk but large negative coefficients for white bread, added sugar, tinned vegetables, full-fat milk and crisps. This was termed the prudent (FFQ) component. The first component generated from PCA of the diary data displayed a similar pattern with large positive coefficients for wholemeal bread, fruit and vegetables, cheese, yoghurt and reduced-fat milk but large negative coefficients for chips and roast potatoes, white bread and tinned vegetables. This was termed the prudent (diary) component.
The direction and magnitude of the coefficients for the prudent (FFQ) and prudent (diary) components were notably similar; of the ten most important foods for each component, seven were common to both. The close association between the prudent diet coefficients for the diary and FFQ is displayed in Fig. 1. The most important differences were seen for cakes and biscuits, and sweets and chocolate which were negatively associated with the FFQ component, but positively with the diary component.
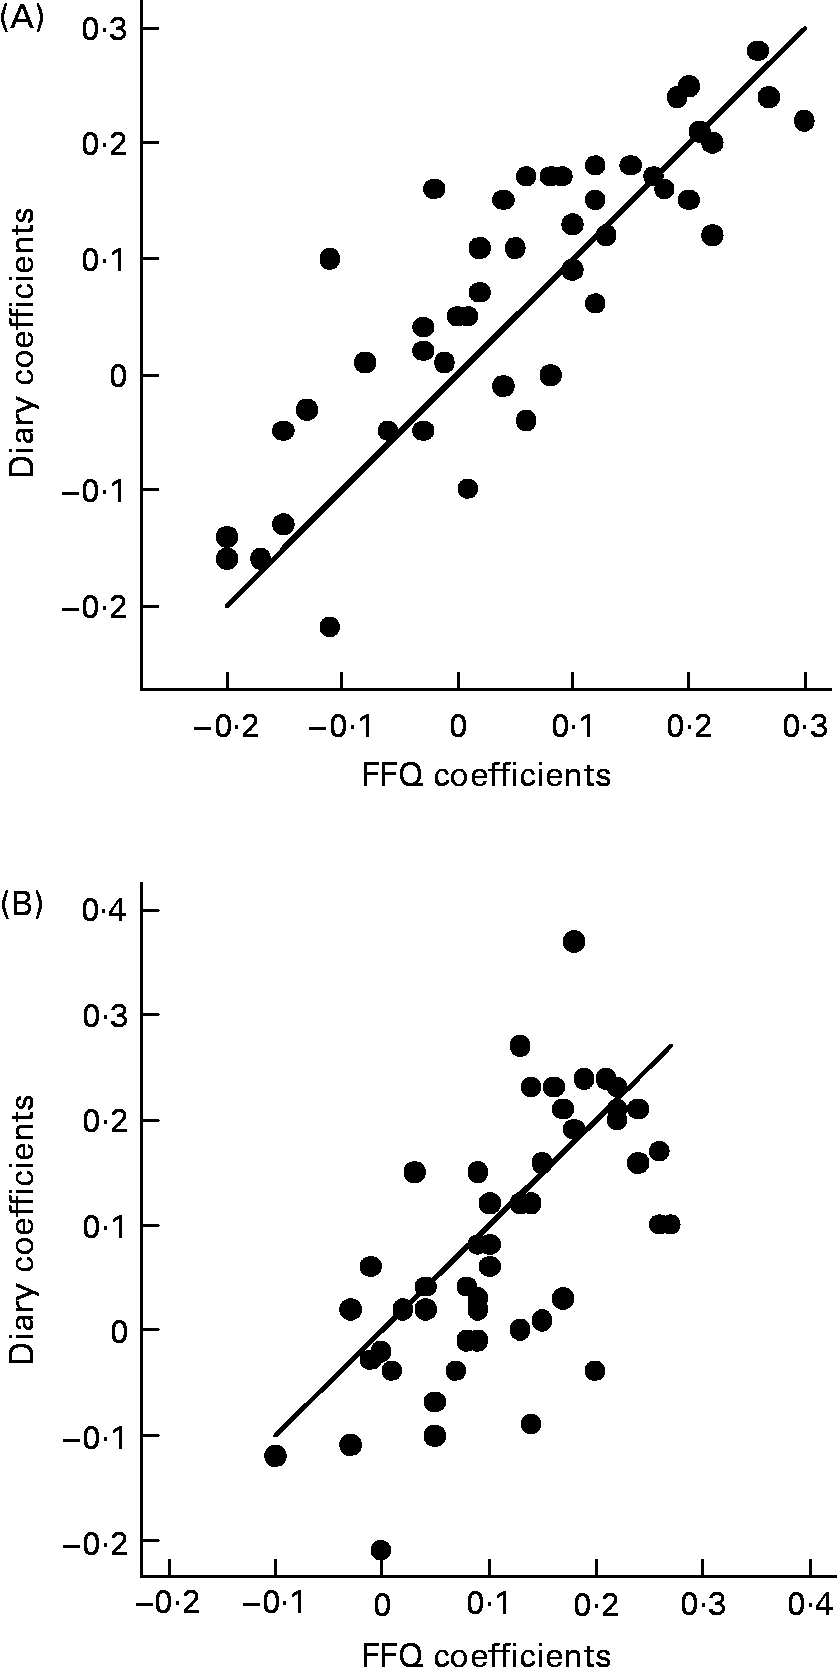
Fig. 1 Scatterplots of principal component analysis coefficients for prudent (A) and Western (B) diet scores, with line of equality.
The second component derived from the FFQ data was characterised by large positive coefficients for red and processed meat, cakes and biscuits, puddings, Yorkshire puddings and savoury pancakes, chips, roast and boiled potatoes, sugar, sweets and chocolate. Most coefficients for the second FFQ component were positive, with only reduced-fat milk having a negative coefficient of notable magnitude. This was termed the Western (FFQ) component. The second component from the diary data had large positive coefficients for full-fat spread, cooking fats and salad oils, full-fat milk, sweets and chocolate, white bread, crisps, tea and coffee, chips and roast potatoes, Yorkshire puddings and savoury pancakes, but large negative coefficients for reduced-fat spread, reduced-fat milk, wholemeal bread, and decaffeinated tea and coffee. It was termed the Western (diary) component.
The association between the Western diet coefficients for the diary and FFQ is shown in Fig. 1. The patterns of foods in the Western components were comparable for the FFQ and diary data, although there were greater differences between the two than for the prudent component. The most important differences were for boiled potatoes, offal and reduced-fat spread, which had higher coefficients for the FFQ than for the diary data. Four of the ten most discriminating foods for the Western component were common to both the FFQ and food diary components.
Individual scores
Individual scores were calculated for each of the dietary patterns (prudent (FFQ), prudent (diary), Western (FFQ) and Western (diary)). For the prudent diet component Pearson's correlation coefficient between the FFQ and diary scores was 0·67 (P < 0·001) and for the Western diet component it was 0·35 (P < 0·001). Since agreement between scores was being assessed, individuals' FFQ and diary scores were compared using Bland–Altman plots(Reference Bland and Altman22) (Fig. 2). Since the scores were standardised to a mean of zero, the average difference between the component scores was zero.
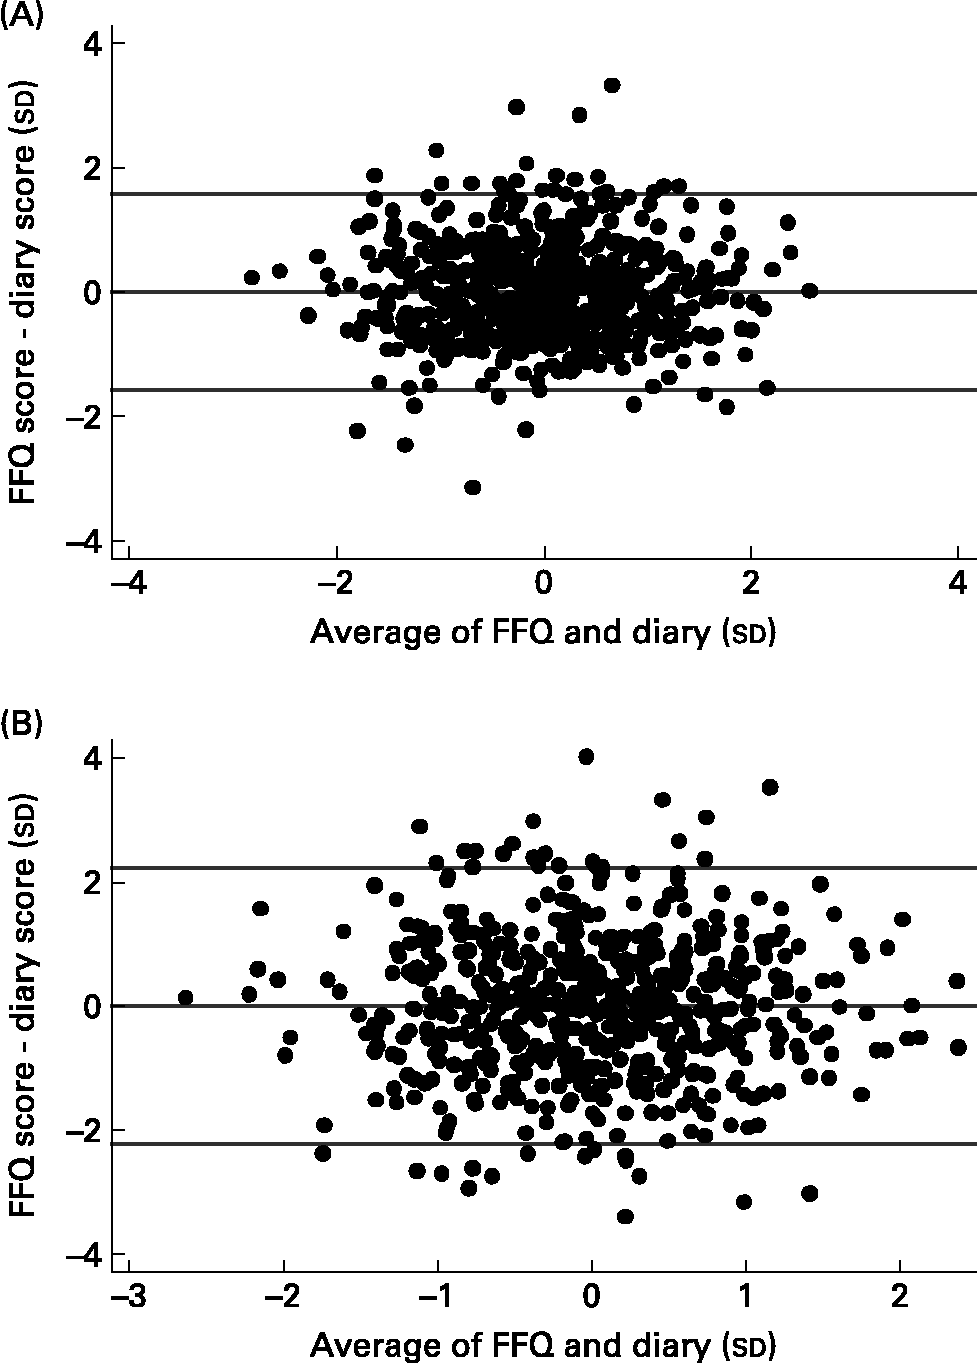
Fig. 2 Bland–Altman plots for agreement between individuals' prudent (A) and Western (B) diet scores.
There was reasonably good agreement between the scores for the prudent (FFQ) and the prudent (diary) scores; 95 % of the differences lay within − 1·58 and +1·58 sd. The agreement between the Western (FFQ) and Western (diary) scores was somewhat less good, with 95 % of the differences lying within − 2·22 and +2·22 sd.
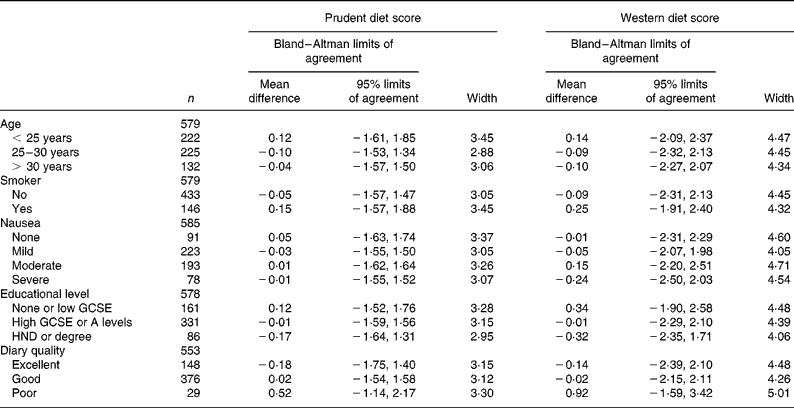
Maternal age, smoking status, nausea, educational attainment and diary quality were considered as predictors of the differences in prudent and Western score variables. Bland–Altman limits of agreement (Table 3) demonstrate how the agreement between diary and FFQ scores differed across the predictor variables, with weaker agreement indicated by wider limits of agreement. The limits are consistently wider for the Western pattern, but variations across characteristics are similar. For both the prudent and Western score the agreement was weakest amongst respondents who were young ( < 25 years), had low educational qualifications (none or low GCSEs (general certificates of education)), or had poor, probably incomplete diaries. Poorer agreement between the prudent diet scores was seen amongst smokers, but the agreement between the Western diet scores was poorer amongst non-smokers. There was no trend in agreement across nausea categories. Generally the differences seen across characteristics were small.
Table 3 Bland–Altman limits of agreement for prudent and Western diet scores Mean differences and 95% limits of agreement
GCSE, general certificate of secondary education; A level, advanced level; HND, higher national diploma.
Discussion
We have described the two most important dietary patterns defined using PCA of FFQ and food diary data collected from 585 women in early pregnancy. The first pattern generated by the PCA on both sets of data is easily interpretable; women with high scores had diets characterised by large positive coefficients for fruit and vegetables, wholemeal bread, rice and pasta, yoghurt, cheese, fish and reduced-fat milk, but large negative coefficients for white bread, added sugar, tinned vegetables, full-fat milk, crisps, chips and roast potatoes. This dietary pattern mirrors recommendations from the UK Department of Health(23, 24) and other agencies. In line with other published data(Reference Kant8) and our previous analysis of similar data from young non-pregnant women(Reference Crozier, Robinson, Borland and Inskip18), we called this a ‘prudent’ dietary pattern. The pattern of foods was strikingly similar in both datasets.
The second pattern generated by PCA on the FFQ was characterised by large positive coefficients for red and processed meat, cakes and biscuits, puddings, Yorkshire puddings and savoury pancakes, chips, roast and boiled potatoes, sugar, sweets and chocolate, but by a relatively large negative coefficient for only reduced-fat milk. This pattern of coefficients was comparable with the second pattern generated from the diary data, although there were more differences between the two sources of data than for the prudent dietary pattern. In line with other published data(Reference Kant8) we called this a ‘Western’ dietary pattern.
The prudent and Western diet scores together explain 15·9 % of the variation in FFQ data and 14·4 % of the variation in the diary data. Direct comparisons of the proportion of variation explained by a set of components cannot be made across the literature because it is highly dependent on the number of variables entered into a PCA and the number of components retained. However, when the results from the study were compared with analyses using similar numbers of variables and components retained, the proportion of variation explained was highly comparable (data not shown).
Pearson's correlation coefficients between the FFQ and diary assessments of the prudent diet score (0·67) and the Western diet score (0·35) compare well with uncorrected correlations ranging between 0·34 and 0·64 presented by Hu et al. (Reference Hu, Rimm, Smith-Warner, Feskanich, Stampfer, Ascherio, Sampson and Willett12) for prudent and Western dietary patterns identified using an FFQ and 1-week diet records. Khani et al. (Reference Khani, Ye, Terry and Wolk13) provide similar results with uncorrected correlations ranging between 0·41 and 0·73 for healthy, Western and drinker patterns identified using an FFQ and 1-week diet records.
When we examined influences on agreement between diary and FFQ scores the worst agreement was seen amongst young ( < 25 years) respondents with low educational attainment and poor diary quality. However, these effects were small.
Dietary patterns analyses provide a valuable tool in the study of the associations between diet and disease. In particular the diet of a pregnant woman may have an impact not only on her own health, but also that of her unborn child. The prudent diet pattern found in the present study was robust to the method of dietary assessment used. Since this pattern strongly reflects healthy eating messages disseminated by UK public health policy agencies, it will be a useful instrument in analysis of health outcomes. The Western diet pattern was less robust to the method of assessment used, but nevertheless the same broad pattern was found in both FFQ and diary data. Whilst the detection of these dietary patterns amongst pregnant women enables investigations involving the subsequent health of the offspring, the cohort used necessarily limits the population to which results may be generalisable, although being pregnant would not itself be expected to impact on the reporting of food intake using different dietary assessment methods.
The strengths of the present study are that the data were collected from a general population of pregnant women with a high recruitment rate and a high rate of completed food diaries; 88 % took part and provided complete dietary information. The FFQ was administered by trained research nurses using prompt cards to ensure standardised responses.
However, a limitation of the study was that it was not possible to ‘map’ the foods recorded in the food diaries exactly onto equivalent FFQ categories, as composite foods were divided into constituent ingredients, which was not the case for the foods recorded on the FFQ. Also, there was a disparity in the time periods to which the FFQ and food diary refer; the food diaries describe foods consumed over a 4 d period at the end of the first trimester of pregnancy, whereas the FFQ describes ‘average’ intake over a 3-month period corresponding with the first trimester. In pregnancy a particular difference between these two time periods is likely to be the incidence of nausea and vomiting; these would be most common over the period described by the FFQ and less common by the time the food diary was kept(Reference Weigel and Weigel25). However, no trends in agreement between dietary scores were seen across nausea categories (Table 3). Given these difficulties it was striking that such similarity in the patterns was observed, and it is likely that the level of agreement between patterns in the FFQ and food diary is an underestimate.
In attempting to make a statement of the relative validity of the FFQ in its descriptions of dietary patterns we rely on the food diaries as a ‘gold standard’. However, every dietary method has its own limitations from which biases arise. The subjective measure of the quality and completeness of the food diaries, as coded at the point of collection, showed somewhat poorer agreement in the food diaries identified as being ‘poor, probably incomplete’, as compared with the other food diaries. Thus some of the disagreement is likely to be due to misreporting or incomplete data in the food diaries, rather than solely in the FFQ responses, although the effect on the level of agreement was small.
There is also the possibility of problems existing within the FFQ data, including over-reporting by some women, as described previously(Reference Robinson, Godfrey, Osmond, Cox and Barker16). Despite the errors associated with FFQ and the completion of prospective records, the correlation coefficients are high, and generally higher than those we observed for nutrient intake(Reference Robinson, Godfrey, Osmond, Cox and Barker16). Advantages such as requirement of fewer resources for data collection and processing mean that FFQ are often considered the most appropriate method of dietary data collection in large-scale epidemiological studies; we have shown that they preserve information about the broad pattern of diet.
Conclusions
PCA of data from a FFQ administered to pregnant women in the UK gives similar patterns of diet to those derived from diary data. There is reasonable agreement between women's scores derived using the two methods. The agreement is particularly high for the prudent diet score, an interpretable pattern of foods that has been found in other studies. The use of an administered FFQ in large-scale epidemiological studies provides useful information about dietary patterns.
Acknowledgements
We are grateful to the mothers who took part in the study, the research nurses who carried out the fieldwork and the antenatal clinic staff for their assistance. We also thank Vanessa Cox for help with data management and computing, Mr T. Wheeler and Professor E. J. Thomas for allowing us to include their patients, and Julia Hammond, the senior research nurse. The study was funded by the Medical Research Council and the Dunhill Trust.


