Introduction
The regulation of road transport supply chains has recently become the subject of international public debate. A significant body of research shows that ensuring minimum rates of pay for truck drivers is important, not only to workers’ health and safety but also to achieving improved road safety outcomes and other policy objectives related to the viability of the road transport industry. Based on this recognition, several countries have introduced systems which set minimum standards for pay and related working conditions for truck drivers in recent years. For example, Canada first introduced minimum rates of pay for port truckers tied to a licensing system for trucking companies operating at Vancouver Port in 2005 and has continued to strengthen the system by establishing the Office of the British Columbia Container Trucking Commissioner (OBCCTC) as an independent supervisory body in 2014. Australia enacted the Road Safety Remuneration Act in 2012. This law was repealed in 2016, but recently replaced by a similar system with broad industry support through revision of the Fair Work Act (2009). Brazil introduced the Minimum Freight Floors system following a mega-strike by autonomous (contractor) truck drivers in 2018. The precise content of each of these systems and the process through which each was introduced is different. However, the fact that governments and industry stakeholders in all these countries have recognised the need to regulate road transport supply chains to improve working conditions and occupational and public safety is significant (Baek Reference Baek2023). The International Labour Organization (ILO) has also acknowledged the potential negative impact of fragmentation and complex contracting chains on drivers’ working conditions and road safety, as well as recognising regulatory systems that set minimum standards for pay and ‘encourage predictable cost recovery’ as best practice solutions (ILO 2019).Footnote 1
This South Korean Safe Rates System, which established minimum rates of pay for certain categories of owner truck drivers between 2020 and 2022, follows this trend. The introduction of the Safe Rates System was the result of a strategic choice made by the labour movement in the face of the neoliberal restructuring of the road freight transport industry during the late 1980s and 1990s. This restructuring transformed truck drivers from employees into dependent contractor owner drivers in a matter of years. In July 1999, deregulation of the road transport industry led to abolition of the requirement to possess a minimum number of registered trucks as a precondition for entering the general freight transport market, encouraging the proliferation of small trucking companies. As a result, the gap between the percentage increase in registered trucks and the volume of goods requiring transport by road widened and truck drivers’ pay and conditions deteriorated. Union membership also decreased, weakening workers’ capacity for strategic action (Baek and Yun Reference Baek and Yun2003).
In 2002, dependent contractor owner truck drivers, supported by labour activists, established the Cargo Truckers’ Solidarity Union (TruckSol) to organise a collective response to this situation. In 2003, TruckSol launched a nation-wide strike calling for the introduction of a standard freight rates system to set fair pay standards for truck drivers. A trial standard freight rates system, which established minimum rates of pay for container and steel transport on specified routes, was introduced and operated from October 2010 to September 2011. The system was evaluated positively by the Korea Transport Institute (KOTI), which found that it improved drivers’ well-being and industry structure (KOTI, 2022). The programme was not renewed, however. Following years of campaigning by TruckSol and a change in government, a partial amendment of the Trucking Transport Business Act introducing a three-year pilot Safe Rates System passed the National Assembly in March 2018. Minimum safe rates were published for the first time in 2020. After three years of operation, the system ended on 31 December 2022 amidst widespread debate about the need for its continuation, with TruckSol and trucking industry representatives for, and big business and the government against it.Footnote 2
In 2022, the last year of the pilot, a debate broke out among the government, client companies, and trade unions about the effectiveness of the Safe Rates System. As is explained in more detail later, the government-sponsored evaluation of the system, while demonstrating positive improvements in drivers’ well-being and industry structure, failed to assess road safety impact adequately because the government did not collect sufficient data on vehicles covered by the system. Given the brief period of implementation, developing a reliable methodology for evaluating the Safe Rates System was extremely difficult. Our research aims to fill this gap.
Our research focuses on the Korean Safe Rates System’s impact on truck drivers’ work environment and driver behaviour. We used survey data from the Safe Rates Research Group to conduct an empirical analysis to quantitatively demonstrate the linkage between the Safe Rates System and the work environment, focusing on factors of the work environment that impact road safety. Specifically, we looked at the impact of the system on market structure, truck drivers’ income, and crash risk resulting from long working hours and dangerous driver behaviours. Within the category of market structure, we looked at the number of contracting steps involved in the supply of road transport services, the level of market transparency, and the level of price competition. Truck drivers’ income refers to drivers’ net monthly income after deducting costs associated with the purchase, maintenance, and operation of their vehicles. Finally, dangerous behaviours that increase the likelihood a driver will crash (identified as crash risks) include overloading, speeding, drowsiness while driving, drivers’ total working time, and time spent on vehicle maintenance.
Our results indicate that overall, the implementation of the Safe Rates System improved the work environment in the Korean road freight transport industry, particularly by decreasing the number of contracting steps, improving market transparency, increasing drivers’ net income, reducing overloading, speeding, drowsiness while driving and total working time, and increasing the time that truck drivers spend on vehicle maintenance. By demonstrating this correlation, our study contributes to the existing literature on the relationship between truck driver pay and road safety and provides empirical grounds for the implementation of a new Safe Rates System in Korea.
The remainder of this article is divided into five sections. Following this introduction, the next section provides a review of the relevant literature. In subsequent sections, we describe the data used and our empirical methodology. Then, the results are explained and discussed, while the final section explains the study’s limitations and provides concluding remarks.
Literature review
Australia has led the debate on safe rates and regulation of road transport supply chains (Quinlan Reference Quinlan2001; Mayhew and Quinlan Reference Mayhew and Quinlan2006; Johnstone et al Reference Johnstone, Nossar and Rawling2015; Commonwealth of Australia 2010). Australia’s National Transport Commission (NTC) posited a relationship between economic pressures and road safety outcomes in its 2008 report, Safe Payments: Addressing the underlying causes of unsafe practices in the road transport industry. This report identifies factors influencing truck drivers’ on-road behaviour including low pay, performance-based pay systems, unpaid wages, unreasonable demands on workers, waiting time, and imbalance in market power. These factors increase economic pressure and are thus root causes of frequent heavy vehicle crashes (NTC 2008). Following deregulation, parties at the top of supply chains attempted to secure efficiency and competitiveness by externalising costs and risks. These costs and risks are passed down through the supply chain, with transport companies lower down the chain often unable to negotiate higher freight rates. At the bottom of the chain, truck drivers are likely to be exposed to low income and other pressures to engage in risky driving behaviours.
One research project in the United States used multiple proprietary and public data sets to analyse the correlation between driver pay and crash rates (Belzer et al Reference Belzer, Daniel and Stanley2002; Rodríguez et al Reference Rodríguez, Rocha, Khattak and Belzer2003, Rodríguez et al Reference Rodríguez, Targa and Belzer2006). Particularly, utilising Cox proportional hazards event history analysis, Rodríguez et al (Reference Rodríguez, Rocha, Khattak and Belzer2003) suggest that the increment of drivers’ pay reduces the probability of driver crashes by 6% for each 10% increase in pay rate. Rodríguez et al (Reference Rodríguez, Targa and Belzer2006) also suggest the role of higher wages in reducing turnover and crash rates.
Additionally, a cross-sectional analysis using data from 102 transportation companies in the United States found that the likelihood of a crash decreased by 9.2% for every 10% higher wages (Belzer et al Reference Belzer, Daniel and Stanley2002) In 1997, every 10 cents more in pay was associated with 1.76% lower crash probability. (Monaco and Williams Reference Monaco and Williams2000). Rodríguez et al (Reference Rodríguez, Rocha, Khattak and Belzer2003) and Rodríguez et al (Reference Rodríguez, Targa and Belzer2006) confirm that factors such as wages, length of service, total mileage, and human capital characteristics are more strongly related to the frequency of truck crashes than demographic factors. They also found that higher wage levels diminished the number and probability of truck crashes. Belzer and Sedo (Reference Belzer and Sedo2018) show that higher truck driver pay led to shorter working hours, contributing to driver safety. Estimating the labour supply elasticity for long-distance truck drivers in the United States, they demonstrate that the labour supply curve has a backward bending shape with drivers’ reducing their working time once they meet their target income. As well, Kudo and Belzer (Reference Kudo and Belzer2019) demonstrate that compensation for non-driving labour time leads to shorter work time because drivers reach their target income with fewer work hours. This means drivers refrain from working extremely long hours and are more likely to comply with working time regulations. Faulkiner and Belzer (Reference Faulkiner and Belzer2019) identify a link between higher wages experience, and significantly higher productivity and firm profits. They showed that introduction of a pay scheme with higher wages for skilled drivers leads to higher retention rates and, as a result, higher profits.
Furthermore, economic rewards such as commercial incentives to speed or otherwise violate road safety rules have been found to be a significant cause of risky on-road behaviour (Hensher and Battellino Reference Hensher and Battellino1990; Nossar and Amoresano Reference Nossar and Amoresano2019). Pressure to achieve economic rewards increases truck drivers’ physical and emotional fatigue. These conditions lead to negative attitudes toward occupational safety compliance and ultimately increase the risk of crashes (Kemp et al Reference Kemp, Steven and Kemp2013; Belzer Reference Belzer2018).
All these studies demonstrate a strong correlation between the amount and way in which drivers are paid, on the one hand, and road safety on the other. They do not, however, specifically analyse the impact of government regulation of drivers’ rates of pay. In contrast, two attempts have been made to assess regulatory impact in Australia. First, a government-commissioned report by PricewaterhouseCoopers (PwC) evaluated the efficiency of Road Safety Remuneration System (RSRS) (PwC 2016). PwC used a cost-benefit analysis to argue that the costs associated with continued operation of the system would outweigh the road safety benefits. Belzer (Reference Belzer2016) argues that PwC’s evaluation of expected regulatory costs was exaggerated and point’s the study’s failure to scientifically account for safety impact. Nonetheless, the PwC’s report was cited as the main grounds for the system’s repeal in 2016 after a new administration took office in 2015 (Rawling et al Reference Rawling, Jonstone and Nossar2017).
More recently, Peetz (Reference Peetz2022) has analysed the effects of a long-standing system establishing minimum pay standards for contractor drivers (effectively a Safe Rates system) on-road safety in the Australian state of New South Wales (NSW). NSW has implemented legal pay standards for contractor owner drivers since 1979. The scheme is currently regulated under Chapter 6 of the State Industrial Relations Act. Through a comparative analysis of road fatality statistics in NSW and the rest of Australia between 1989 and 2021, Peetz shows that the proportion of fatalities involving articulated trucks (which are covered by Chapter 6) in the total number of road fatalities in NSW decreased overall (–5.0%) during this period, while the proportion of fatalities involving articulated trucks in other parts of Australia that did not regulate driver pay remained almost unchanged over the same period. This research also finds that at the national level, NSW’s share of all fatalities involving articulated trucks declined rapidly. Peetz estimates that the NSW scheme prevented 171 articulated truck fatalities, resulting in 205 lives saved during the period in question.
In comparison to the literature from the United States and Australia, little research has been conducted in South Korea on the relationship between driver pay and road safety. Lee and Kim (Reference Lee and Kim2017) analyse the impact of working conditions on truck crashes on Korean roads. Their research shows that factors related to truck drivers’ efforts to maintain a certain income level including driving time and distance, number of days worked per month, and drops in trip-based pay rate have a significant impact on the likelihood of crashes, and that crash risk increases as the number of contracting steps increases. Crashes decreased by 3.19% when pay rate increased by KRW 10,000 (about US $8.00).
The only study that looks specifically at the impact of the Safe Rates System is the government-sponsored evaluation of the system conducted by KOTI (KOTI 2022). While demonstrating positive improvements in drivers’ well-being and industry structure, this research found limited changes in road safety indicators including speeding, vehicle maintenance, and the number of crashes after the introduction of the system. However, the study has several flaws, which make the validity of its findings highly questionable. First, only a small proportion of commercial trucks were covered by the Safe Rates System (approximately 5.7%). Further, the short period of implementation meant it would have been impossible for KOTI to obtain conclusive results even if they had carried out a sophisticated analysis and adequately corrected for bias. Their research did not even come close to doing this, however. Rather, they were forced to draw conclusions based on imprecise data. As crash statistics for articulated vehicles transporting important/export containers and bulk cement trailers (BCT) – the two freight types covered by the system – were unavailable, KOTI used data for all articulated commercial vehicles, which included a substantial number of trucks that were not covered by the system. Given these limitations, KOTI researchers explicitly acknowledged that they could not make a definitive assessment of the Safe Rates System’s impact on crash probability and recommended that the government take steps to support a longer period of observation and better data collection (KOTI 2021; KOTI 2022).
Our research corrects for the shortcomings of KOTI (2022) and contributes to the existing literature by conducting an empirical analysis of the Korean Safe Rates System using data from a pooled survey of truck drivers covered by system. We adopted elements of the work environment associated with pressure on drivers including market structure, income, and crash risks (overloading, speeding, drowsiness while driving, total working time, and time spent on maintenance) as our dependent variables. These had three possible outcomes: increase, no change, and decrease. We then conducted an ordered probit analysis to account for each category of the dependent variables. We present the marginal effects of the empirical results, as is necessary when conducting empirical analysis using binary or categorical dependent variables. Additionally, we included a variable that captures the level of compliance with the Safe Rates System by industry participants. This allowed us to capture the relationship between level of compliance with the policy and drivers’ work environment.
While most of the existing literature posits a theoretical relationship between industry structure and safety risks or identifies a correlation between truck driver compensation and crash rates, our analysis examines the pay-safety link in the context of a specific example of policy implementation and focuses on changes in the work environment and driver behaviour. By demonstrating a correlation between higher pay resulting from implementation of the Safe Rates System and improvements in factors of the work environment and driver behaviours that affect road safety, our research helps to evaluate this important piece of legislation in Korea, while also contributing a new approach to the wider scholarship on the relationship between driver pay and road safety outcomes by using micro-level survey data from Korean truck drivers and applying an empirical methodology using ordered probit analysis.
Data
As explained above, commercial vehicle crash data in Korea are not sufficiently disaggregated by vehicle type, making it impossible to identify crashes involving vehicles covered by the Safe Rates System. Due to these limitations in the available public data, we chose instead to use data from a survey of truck drivers covered by the Safe Rates System conducted by the Korean Safe Rates Research Group (KSRRG).
The KSRRG surveyed owner truck drivers operating articulated vehicles used to transport import/export containers and bulk cement trailers (BCT), the two freight types covered by the Safe Rates System, during the period when the system was in effect. Regrettably, this period overlapped with the COVID-19 pandemic, which put significant constraints on data collection. In lieu of random sampling, which might have been feasible under normal conditions, survey respondents came from a list of union members covered by the Safe Rates System provided by the Cargo Truckers’ Solidarity Division of the Korean Public Service and Transport Workers’ Union (KPTU-TruckSol), and interviews were conducted by phone rather than in person. Researchers spent between 60 and 90 minutes interviewing each respondent and recording their answers to the survey questions. All drivers surveyed were male.
Two surveys were conducted, one in August 2020 and one in August 2021. A total of 773 respondents cumulative were selected with 392 respondents in the first survey and 381 in the second survey. 261 respondents were the same across the two survey periods. We conduct a pooled probit analysis to account for the variation in respondents between the two groups.
The fact that all respondents were union members may have some impact on the data, especially since TruckSol represented only approximately 24% (6,300) of the roughly 26,000 truck drivers covered by the Safe Rates System. While there may exist some noise in the data, the legal minimum pay rates set by Safe Rates System applied to all drivers irrespective of union membership and were significantly higher than the pay most union members received before the system began, so we do not expect the impact to be significant.
The survey was made up of approximately 90 questions, including 16 basic questions concerning the characteristics of the drivers, six questions related to market structure, 23 questions related to drivers’ quality of life, and 22 questions concerning the expected impact of the Safe Rates System. The basic questions such as the age and experience variables were open-ended. The question about transport type asked respondents to select from nine categories of container and BCT operations. Each of the other questions used a scale that was specific to the nature of the question. From the survey data we extracted information on the structure of the market in which drivers work, drivers’ net income, and crash risks as dependent variables. Within market structure, we looked at the number of contracting steps between client companies who ship goods and the truck drivers who transport them, the level of market transparency, and the level of price competition. Net income covers whether monthly net income increased or not. We took crash risks to be dangerous on-road and work-related practices that increase the likelihood of crashes including overloading, speeding, drowsiness while driving, total working time, and time spent on vehicle maintenance. Questions related to crash risks asked whether drivers had experienced heightened crash risk due to overloading, speeding, drowsiness, lack of vehicle maintenance, and excessive total working time. All dependent variables had three possible outcomes: increase, no change, and decrease. We conducted ordered probit analysis for each dependent variable to minimise the bias stemming from multi-categorical dependent variables.
We extracted information on the change in actual pay rates received by drivers as an indication of the effect of the Safe Rates System. This variable captures whether the actual trip-based pay rate increased, decreased or remained the same after the implementation of the Safe Rates System. As only a handful of observations showed the actual pay rates to remain unchanged, the variable possesses a value of one if there was an increase in the actual pay rates and zero otherwise. We use the term ‘actual’ because despite the implementation of the Safe Rates System, some drivers did not receive the rate published by the government. Specifically, the survey asked drivers how much the rate of pay they received increased or decreased in comparison to the rate they received before the Safe Rates System was implemented. Rather than looking at the difference between average driver pay before the system’s implementation and the safe rates pay standards published by the government, this question looked at how the actual pay drivers received for their work changed. Our study aims to explore the impact of the increase in actual rates following the implementation of the Safe Rates System on driver safety and the possibility of positive effects. We also included a variable that captures the level of compliance with the Safe Rates System by industry participants. The compliance variable shows the relationship between compliance with the Safe Rates System by client and transport companies and the dependent variables.
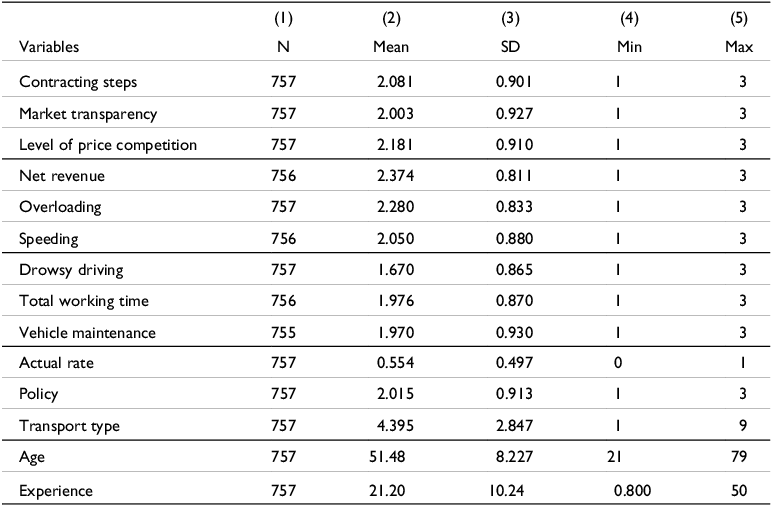
As control variables, we included the characteristics of the transport task and the characteristics of the drivers. Characteristics of the transport task include the type of freight carried (containers or BCT), and specific forms of transport by freight type including long haul, medium haul, short haul, city shuttle, trans-shipment shuttle, city door-to-door transport for container transport and long haul, medium haul, and short haul for BCT transport. For container transport, long haul is when the operating distance is 300 km or greater, middle haul is when the operating distance is between 100 km and 300 km, and short haul is when the operating distance is between 30 km and 100 km. City shuttle, trans-shipment shuttle, and city door-to-door transport are different forms of container transport over short distances. For BCT long, medium, and short haul refer to operating distances of 250 km or greater, between 100 km and 250 km and under 100 km, respectively. We further incorporated the age and experience of the drivers to control for workers’ individual characteristics. Unfortunately, as data on the general population size for each category is unavailable, our research does not weigh the responses for the empirical analysis. Tables 1 and 2 provide summary of the survey data and summary statistics for our variables.
Table 1. Summary of the survey data

Source: Korean Safe Rates Research Group (2022). Panel survey on the impact of the Korean Safe Rates System.
Table 2. Summary statistics
Source: Author’s calculation.
Note: ‘N’ refers to the number of observations. ‘SD’ refers to the standard deviation. ‘Min’ and ‘Max’ refer to the minimum and maximum values of each variable.
One concern is that the survey used includes data collected during the COVID-19 pandemic. Particularly in South Korea, the effects of COVID-19 were mainly felt in 2020–2021. The effects of the pandemic may influence the patterns of actual pay rates received by drivers if freight volumes changed considerably during this time. However, in South Korea, the volume of import/export container and BCT transport did not deviate significantly from the general pattern during the years in question. As shown in Tables 3 and 4, the volume of import/export container and BCT transport decreased by 0.4% and 4.7% in 2020, and increased by 3.2% and 5.1% in 2021, respectively. The average monthly sales from transport of import/export containers and BCT also grew 0.2% and 8.6% in 2020 and 2021, respectively. Sales growth during the pandemic was not substantially different from previous years. These statistics imply that the effect of the COVID-19 pandemic on Korean truck drivers was limited. Therefore, the impact of COVID-19 pandemic may be marginal for our empirical analysis.
Table 3. Transport of safe rates-covered freight types, 2013–2021
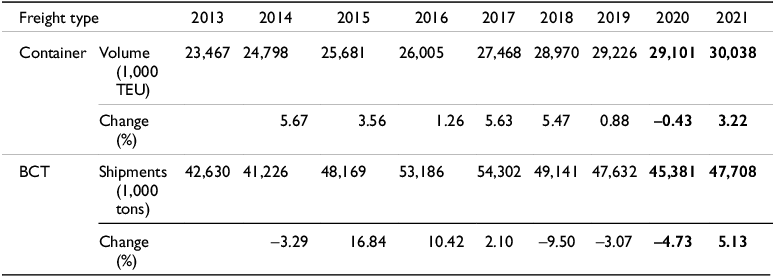
Source: Ministry of Oceans and Fisheries (https://new.portmis.go.kr/) and Korea Cement Association Statistics (http://www.cement.or.kr/).
Table 4. Monthly revenue for transport of safe rates-covered freight types, 2019–2022

Source: Ministry of Land, Infrastructure and Transport (MoLIT) (2022). See Annual Freightt Transport Market Trends Reports, 2019–2022, Korea Transport Institute (https://www.koti.re.kr), under the Ministry of Land, Infrastructure and Transport for more information.
Methodology
In this section, we describe the empirical framework for our analysis. We assume that the income and characteristics of drivers determine their economic status, which is shown as:
where
![]() ${Y_{it}}$
is a vector of the work environment of driver i at time t,
${Y_{it}}$
is a vector of the work environment of driver i at time t,
![]() ${W_{it}}$
is the wage of the driver and
${W_{it}}$
is the wage of the driver and
![]() ${X_{it}}$
is the characteristics of the driver, including the type of transport in which he is engaged and his age. Truck drivers’ wages are often determined by their experience level, the appropriateness of government policy, and how well government policy is implemented. Therefore, we decompose
${X_{it}}$
is the characteristics of the driver, including the type of transport in which he is engaged and his age. Truck drivers’ wages are often determined by their experience level, the appropriateness of government policy, and how well government policy is implemented. Therefore, we decompose
![]() ${W_{it}}$
as:
${W_{it}}$
as:
where
![]() $Ex{p_{it}}$
is the driver’s experience in the industry and
$Ex{p_{it}}$
is the driver’s experience in the industry and
![]() $Rat{e_{it}}$
is the Safe Rates System implemented by the government to ensure appropriate pay for drivers.
$Rat{e_{it}}$
is the Safe Rates System implemented by the government to ensure appropriate pay for drivers.
![]() $Polic{y_{it}}$
is the level of compliance with the system. This variable captures how well industry participants comply with the policy, and truck drivers were asked to rate compliance level as low, average or high. Participants were asked to rate the level of compliance with the Safe Rates System. The variable has a value of one if the participants rated compliance as low and a value of two if they rated it as average. The variable has a value of three if the participants rated the compliance level as high. By expanding equation (1) with equation (2), we get our empirical equation as follows:
$Polic{y_{it}}$
is the level of compliance with the system. This variable captures how well industry participants comply with the policy, and truck drivers were asked to rate compliance level as low, average or high. Participants were asked to rate the level of compliance with the Safe Rates System. The variable has a value of one if the participants rated compliance as low and a value of two if they rated it as average. The variable has a value of three if the participants rated the compliance level as high. By expanding equation (1) with equation (2), we get our empirical equation as follows:
Equation (3) depicts the empirical framework for our analysis.
![]() ${Y_{it}}$
is the vector of the work environment. This vector includes the market structure, drivers’ net income, and crash risks. Market structure includes the number of contracting steps, the level of market transparency, and the level of price competition. Crash risks include overloading, speeding, and drowsiness while driving, along with total working time and time spent on vehicle maintenance. The vector of drivers’ work environment has three possible outcomes: increase, no change, and decrease. To account for the multi-categorical dependent variables, we conducted ordered probit analysis and presented the marginal effects of each category.
${Y_{it}}$
is the vector of the work environment. This vector includes the market structure, drivers’ net income, and crash risks. Market structure includes the number of contracting steps, the level of market transparency, and the level of price competition. Crash risks include overloading, speeding, and drowsiness while driving, along with total working time and time spent on vehicle maintenance. The vector of drivers’ work environment has three possible outcomes: increase, no change, and decrease. To account for the multi-categorical dependent variables, we conducted ordered probit analysis and presented the marginal effects of each category.
![]() $Rat{e_{it}}$
is a dummy variable capturing whether the actual pay rates increased with the implementation of the Safe Rates System. We use this dummy variable as an indication of the effect of the government’s implementation of the Safe Rates System.
$Rat{e_{it}}$
is a dummy variable capturing whether the actual pay rates increased with the implementation of the Safe Rates System. We use this dummy variable as an indication of the effect of the government’s implementation of the Safe Rates System.
![]() $Ex{p_{it}}$
is the driver’s level of experience in the industry.
$Ex{p_{it}}$
is the driver’s level of experience in the industry.
![]() ${X_{it}}$
is a vector for control variables that includes the characteristics of the driver. We typically included the type of freight transported (containers or BCT), and the driver’s age.
${X_{it}}$
is a vector for control variables that includes the characteristics of the driver. We typically included the type of freight transported (containers or BCT), and the driver’s age.
![]() $F{E_t}$
is the corresponding fixed effect for the survey round t to control for unobservable effects each year, particularly the COVID-19 pandemic during these years.
$F{E_t}$
is the corresponding fixed effect for the survey round t to control for unobservable effects each year, particularly the COVID-19 pandemic during these years.
![]() ${\varepsilon _i}$
and
${\varepsilon _i}$
and
![]() ${\varepsilon _t}$
are time-invariant and variant error terms. Correlations among variables are insignificant. The correlation table is available upon request.
${\varepsilon _t}$
are time-invariant and variant error terms. Correlations among variables are insignificant. The correlation table is available upon request.
Results
This section describes the empirical results using equation (3) from the previous section. Our results suggest the impact of the Safe Rates System on three elements of the work environment: market structure, net income, and crash risks. For all tables in this section, the actual rates refer to the increase in the actual rates of pay with the implementation of the Safe Rates System. Experience refers to the duration of the driver’s participation in the road freight transport market. Policy refers to how well clients and transport companies complied with the Safe Rates System. The Cont and BCT variables are the types of freight transported by drivers, where Cont refers to containers and BCT to bulk cement. Age refers to the driver’s age. The coefficients for all tables in this section are the marginal effects from the ordered probit analysis.
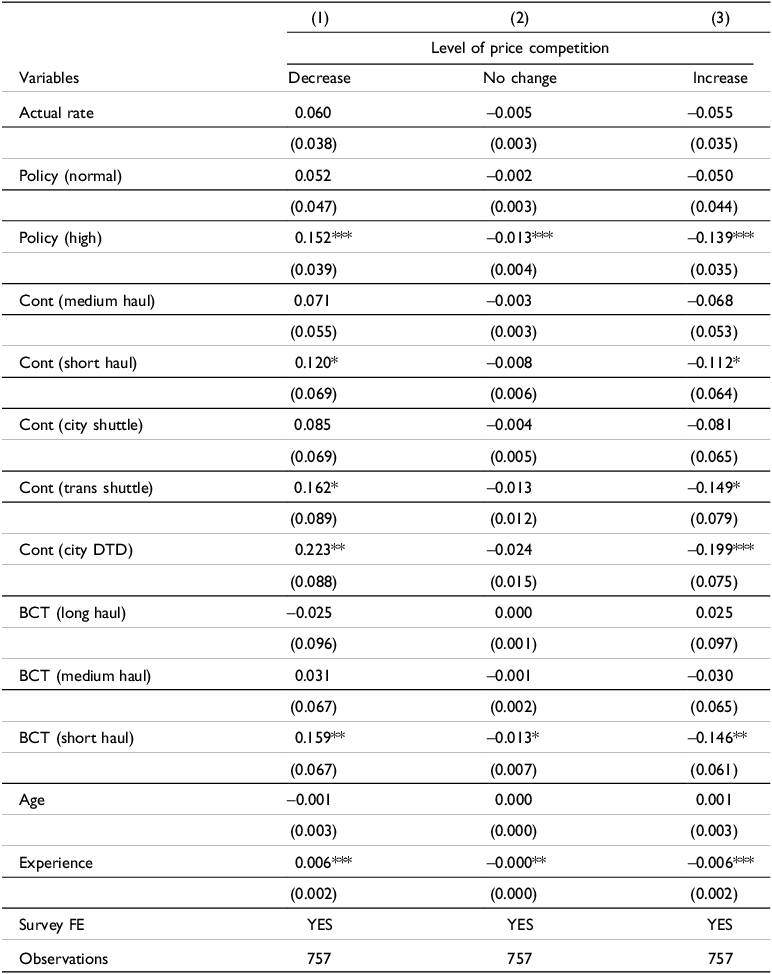
Tables 5 and 6 show the impact of the Safe Rates System on the structure of the market in which drivers work. Increase in actual rates of pay led to a decrease in the number of contracting steps and an increase in market transparency. Specifically, better compliance with the Safe Rates System decreased the number of contracting steps by 6.5%. This suggests that establishing minimum pay rates can contribute to the alleviation of intermediate exploitation, which occurs in the case of multi-level subcontracting.Footnote 3 Furthermore, an increase in the actual rates of pay corresponded to an increase in market transparency by 7%. A lack of market transparency leads to asymmetrical access to information among drivers. It also strengthens the negotiating power of client companies, who have greater access to contract-related information. An increase in market transparency corrects for these market failures and diminishes unnecessary costs that drivers must bear arising from a lack of access to information. However, our results did not show any statistically significant adjustment in the level of price competition as a result of the Safe Rates System.
Table 5. Safe rates system impact on market structure (marginal effect on number of contracting steps and market transparency)
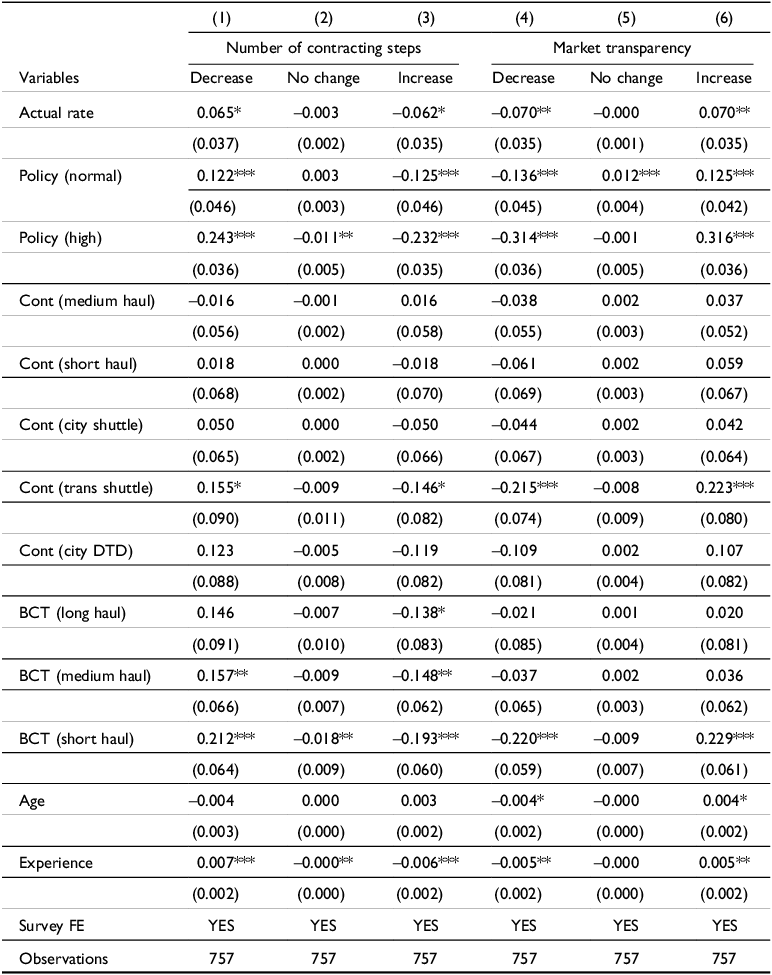
Robust Standard errors in parentheses.
***p < .01, **p < .05, *p < .1.
Table 6. Safe rates system impact on market structure (marginal effect on level of price competition)
Robust Standard errors in parentheses.
***p < .01, **p < .05, *p < .1.
Market efficiency increased the more industry participants complied with the system. Increased compliance with the system corresponded with a decrease in the number of contracting steps by 24%, an increase in market transparency by 32%, and a decrease in price competition by 15%.
These results suggest that higher industry engagement in the Safe Rates System improved market conditions for drivers. In addition, they are highly related to the general economic welfare as multiple layers of subcontracting, poor market transparency and poor market efficiency suggest a deadweight loss. Overall, our results suggest that the Safe Rates System positively influenced the structure of the Korean road freight transport market.
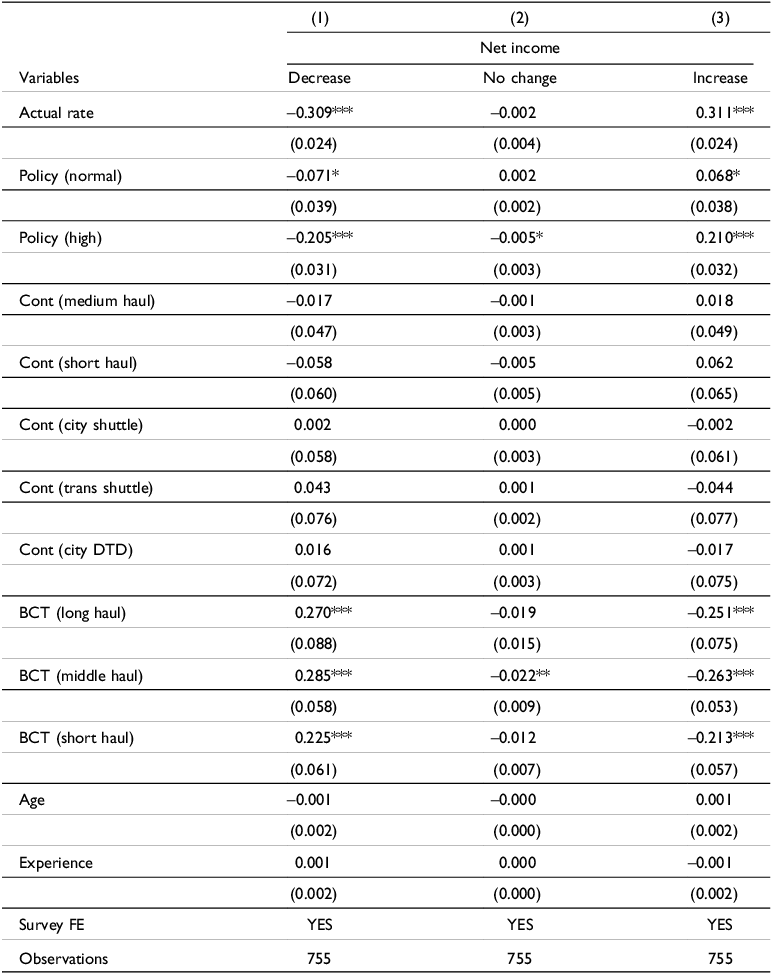
Table 7 describes the impact of the Safe Rates System on drivers’ net income. In addition to having a positive impact on market structure, as shown in Tables 5 and 6, implementation of the Safe Rates System increased drivers’ net income. Drivers’ net income increased on average by 31%. A high level of compliance with the system also contributed to an increase in net income.
Table 7. Safe rates system impact on drivers’ net income (marginal effect)
Robust Standard errors in parentheses.
***p < .01, **p < .05, *p < .1.
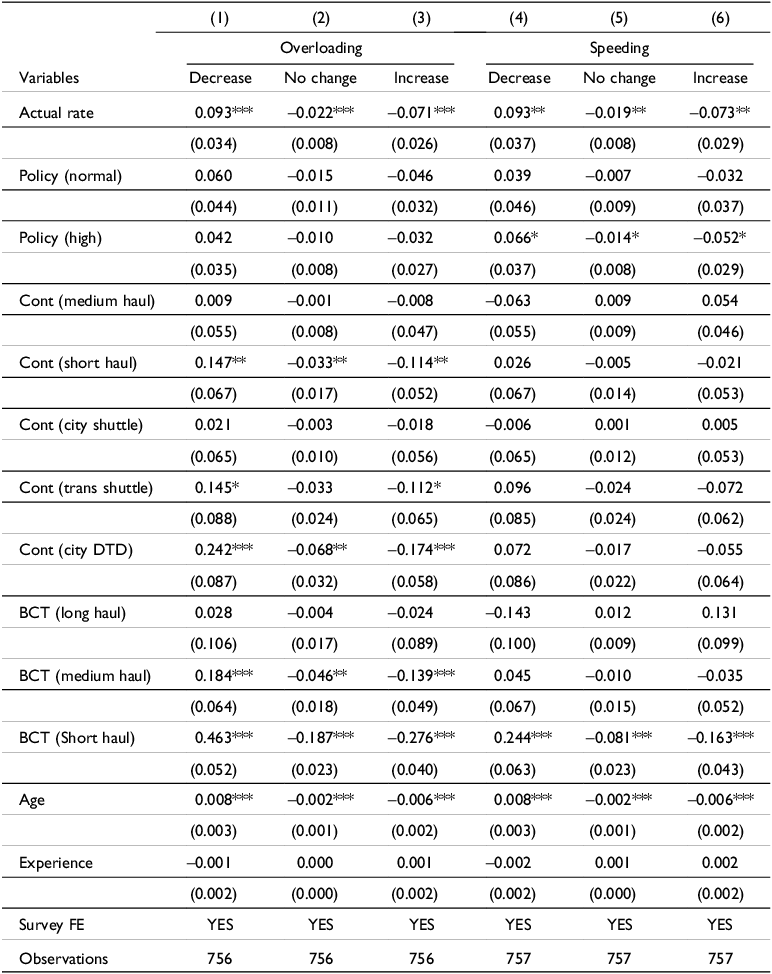
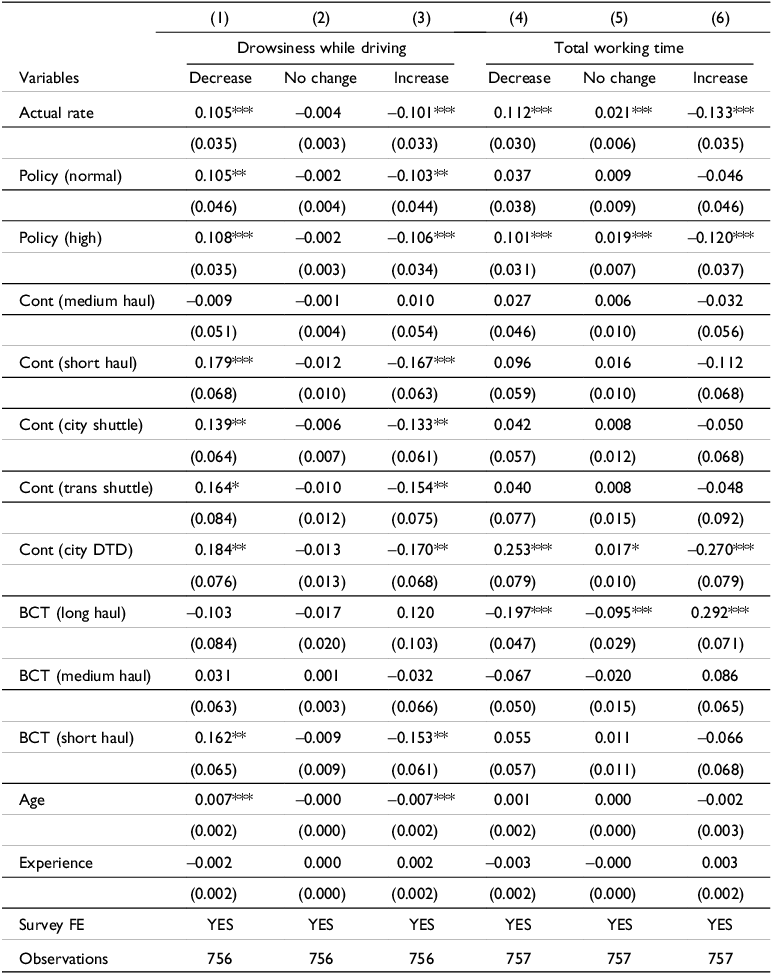
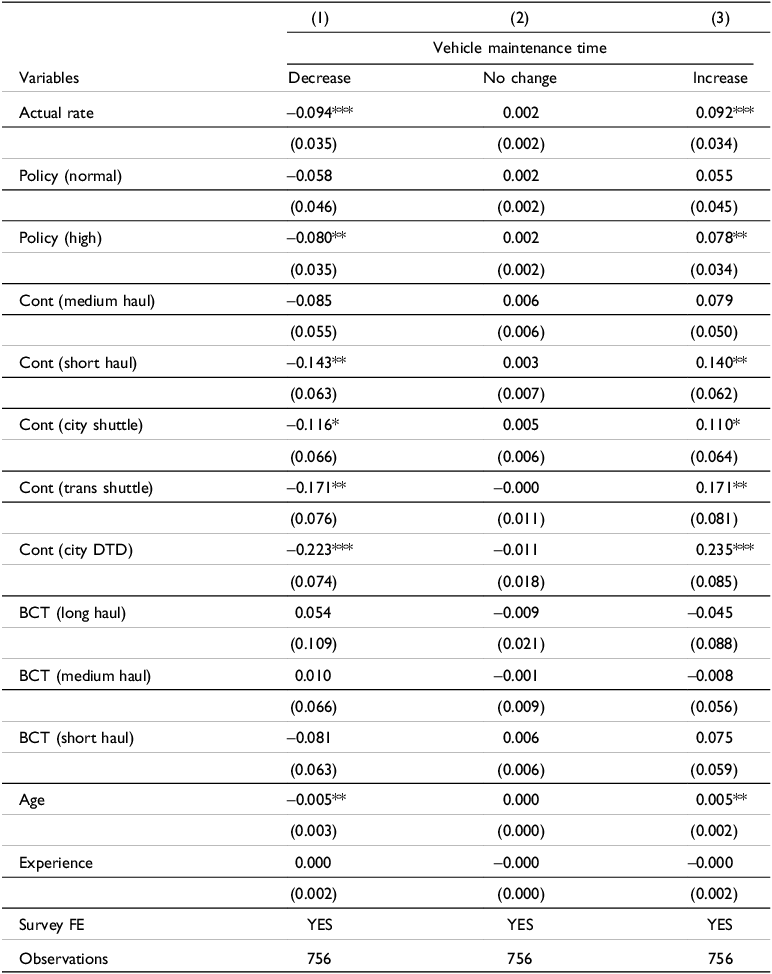
Tables 8–10 show empirical results related to the occurrence of crash risks, including overloading, speeding, drowsiness while driving, total working time, and time spent on maintenance. All these factors directly relate to the likelihood that drivers will crash their trucks.
Table 8. Safe rates system impact on crash risk (marginal effect on overloading and speeding)
Robust Standard errors in parentheses.
***p < .01, **p < .05, *p < .1.
Table 9. Safe rates system impact on crash risks (marginal effect on drowsiness while driving and total working time)
Robust Standard errors in parentheses.
***p < .01, **p < .05, *p < .1.
Table 10. Safe rates system impact on crash risk (marginal effect on vehicle maintenance time)
Robust Standard errors in parentheses.
***p < .1, **p < .05, *p < .1.
Remarkably, implementation of the Safe Rates System followed by an increase in actual rates of pay received by drivers corresponded with a decrease in overloading by 9% 9%. Likewise, speeding, drowsiness while driving, and excessive working time decreased by 9%, 10%, and 11%, respectively, following the increase in actual pay rates. Drivers’ vehicle maintenance time also increased by 9% as their actual pay rates increased. Our results strongly suggest that the implementation of the Safe Rates System contributed to a decrease in the risk of truck crashes in South Korea. Reduction in crash risk is beneficial to drivers, the public, and the industry as a whole.
Our results are consistent with studies on the impact of pay on truck driver behaviour such as Belzer and Sedo (Reference Belzer and Sedo2018) which demonstrate that truck drivers reduce their working hours when they achieve their target income. Similarly, our research found that the receipt of ‘safe rates’ led to shortened working hours as shown in Table 9. In other words, drivers refrained from working extremely long hours following the increase in actual pay rates. While the short implementation period and lack of sufficient data make it impossible to look directly at the impact of safe rates of pay on the number of truck crashes, our results are consistent with studies that have found a correlation between increased pay and lower crash frequency, including Belzer et al (Reference Belzer, Daniel and Stanley2002), Rodríguez et al (Reference Rodríguez, Rocha, Khattak and Belzer2003) and Rodriquez et al (Reference Rodríguez, Targa and Belzer2006), in as much as we demonstrate a positive impact on factors that increase the risk of crashes. Our research also suggests that with a longer period of observation and better disaggregation of crash data, we would observe results similar to Peetz (Reference Peetz2022), who demonstrated reduction of articulated vehicle crashes and crash fatalities as a result of the regulation of driver pay in the state of New South Wales.
Conclusion
This research sheds light on the impact of the Safe Rates System on the work environment in the Korean road freight transport industry, including by demonstrating a relationship between the implementation of the system and improvements in factors in the work environment that affect road safety. We conducted an empirical analysis to demonstrate the effects of the system by distinguishing three elements of the work environment: market structure, drivers’ net income, and the occurrence of crash risks.
Our results suggest that increased rates of pay arising from the implementation of the Safe Rates System improved the work environment overall, particularly the number of contracting steps, the level of market transparency, drivers’ net income, the occurrence of overloading, speeding, drowsiness while driving, total working time, and total time spent on maintenance. At the same time, as compliance with the system improved, drivers’ overall work environment improved as well. Our results strongly suggest that the implementation of the Safe Rates System enhanced the work environment in the Korean road freight transport industry, particularly those elements related to road safety.
This research has some limitations. First limitation in data collection caused by the COVID-19 pandemic meant that the survey data adopted for this analysis came from the most readily available source – a list of unionised drivers covered by the Safe Rates System. However, as explained above, given the similar impact of the Safe Rates System on unionised and non-unionised drivers, we believe the influence of this limitation to be minor More importantly, the survey only covered a two-year period due to the short period during which the Safe Rates System was in effect. Panel or pooled analysis using a wider sample over a longer period would enable more observations and lead to more robust results.Footnote 4 Moreover, as data on the general population size for each of the nine categories of transport identified in the survey is unavailable, we were not able to weight the responses. Finally, while we adopted the actual pay rates received before and after the introduction of the Safe Rates System as a proxy for the impact of the system, the rate increase may not have been solely the result of the system’s implementation. Future research may find a more appropriate proxy or variable to represent the implementation of the Safe Rates System.
Despite these limitations, our research sheds light on the effectiveness of the Safe Rates System in improving elements of the work environment related to road safety. Currently, a debate on reintroduction of the system is underway. Given the political sensitivity of this debate, empirical evaluation and evidence of the system’s effectiveness are needed. Our empirical analysis fills this gap by providing a logical basis for future evaluation, which may pave the way for successful reintroduction of the system.
Funding statement
This research was supported by the Ministry of Education of the Republic of Korea and the National Research Foundation of Korea (NRF-2020S1A5C2A02093112). The Funder had no involvement in preparing the manuscript.
Competing interests
The authors(s) declare none.

