1. Introduction
In August2006, amid widespread controversy, the International Astronomical Union (IAU) changed the classification of a planet through Resolution 5A (1) at its XXVIth General Assembly in Prague (IAU 2006). This was based on a new definition of aplanet as:
A non-satelliteFootnote a celestial body in the Solar System which (i) is in orbit around the Sun, (ii) has sufficient self-gravity to assume hydrostatic equilibrium (i.e., it is essentially spherical in shape), and (iii) has ‘cleared the neighbourhood’ around its orbit.
Much-loved Pluto failed the third component of this definition and so was reclassified as an object within the new and distinct class of ‘dwarf planet’ defined in Resolution 5A (2).
Various parameterised mathematical models have been developed to determine if an object orbiting a star is able to ‘clear or have cleared its neighbouring region’ of (or has ‘dynamical dominance’ over) smaller bodies (Stern & Levison Reference Stern and Levison2002; Soter Reference Soter2006; Margot Reference Margot2015). This dominance can be achieved by accretion, capture as a direct satellite or resonant body, or displacement to a more distant orbit. The models all identify a gap of several orders of magnitude in the value of the specific ‘orbital clearing’ parameter, thereby showing a clear discrimination between the eight IAU planets and the dwarf planets.
2. Diameter-distance distribution of planetary satellites
In Hill (Reference Hill2020a) and (Reference Hill2020b), the orbital and size characteristics of the 156 named satellites in the Solar System (as of 2019) were studied in respect of their potential to provide total solar eclipses similar in type and grandeur to those that can be seen on Earth, when viewed from the (nominal) surfaces of their parent bodies. This subset of the total of 184 natural satellites identified on six planets and four dwarf planets (https://solarsystem.nasa.gov/moons/in-depth/, https://ssd.jpl.nasa.gov/?satelem, and https://ssd.jpl.nasa.gov/?satphyspar) is the group that had orbital and size parameters characterised well enough for them to be formally named at that time.
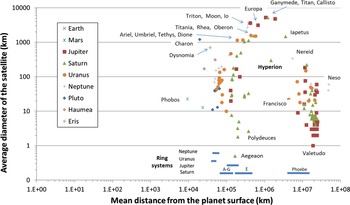
As a by-product of this study an unexpected and, as far as the author is aware, undocumented non-random distribution of these satellites in relation to their diameter and distance from the relevant parent planet or dwarf planet was observed (Figures 1 and 2). On the one hand, the diameters of the satellites are distributed broadly from
![]() $0.5\,\mathrm{km}$
for Aegeaon on Saturn, to
$0.5\,\mathrm{km}$
for Aegeaon on Saturn, to
![]() $5\,260\,\mathrm{km}$
for Ganymede on Jupiter (Figure 1). However, the distances of the satellites from their parent display a distinctly non-random ‘horseshoe-like’ pattern, with very few satellites (namely, only the largest ones) occurring at distances from the parent between
$5\,260\,\mathrm{km}$
for Ganymede on Jupiter (Figure 1). However, the distances of the satellites from their parent display a distinctly non-random ‘horseshoe-like’ pattern, with very few satellites (namely, only the largest ones) occurring at distances from the parent between
![]() $400\,000\,\mathrm{km}$
and 4 million km. This gap in smaller satellite distances is henceforth referred to as the ‘exclusion zone’ around that planet.
$400\,000\,\mathrm{km}$
and 4 million km. This gap in smaller satellite distances is henceforth referred to as the ‘exclusion zone’ around that planet.
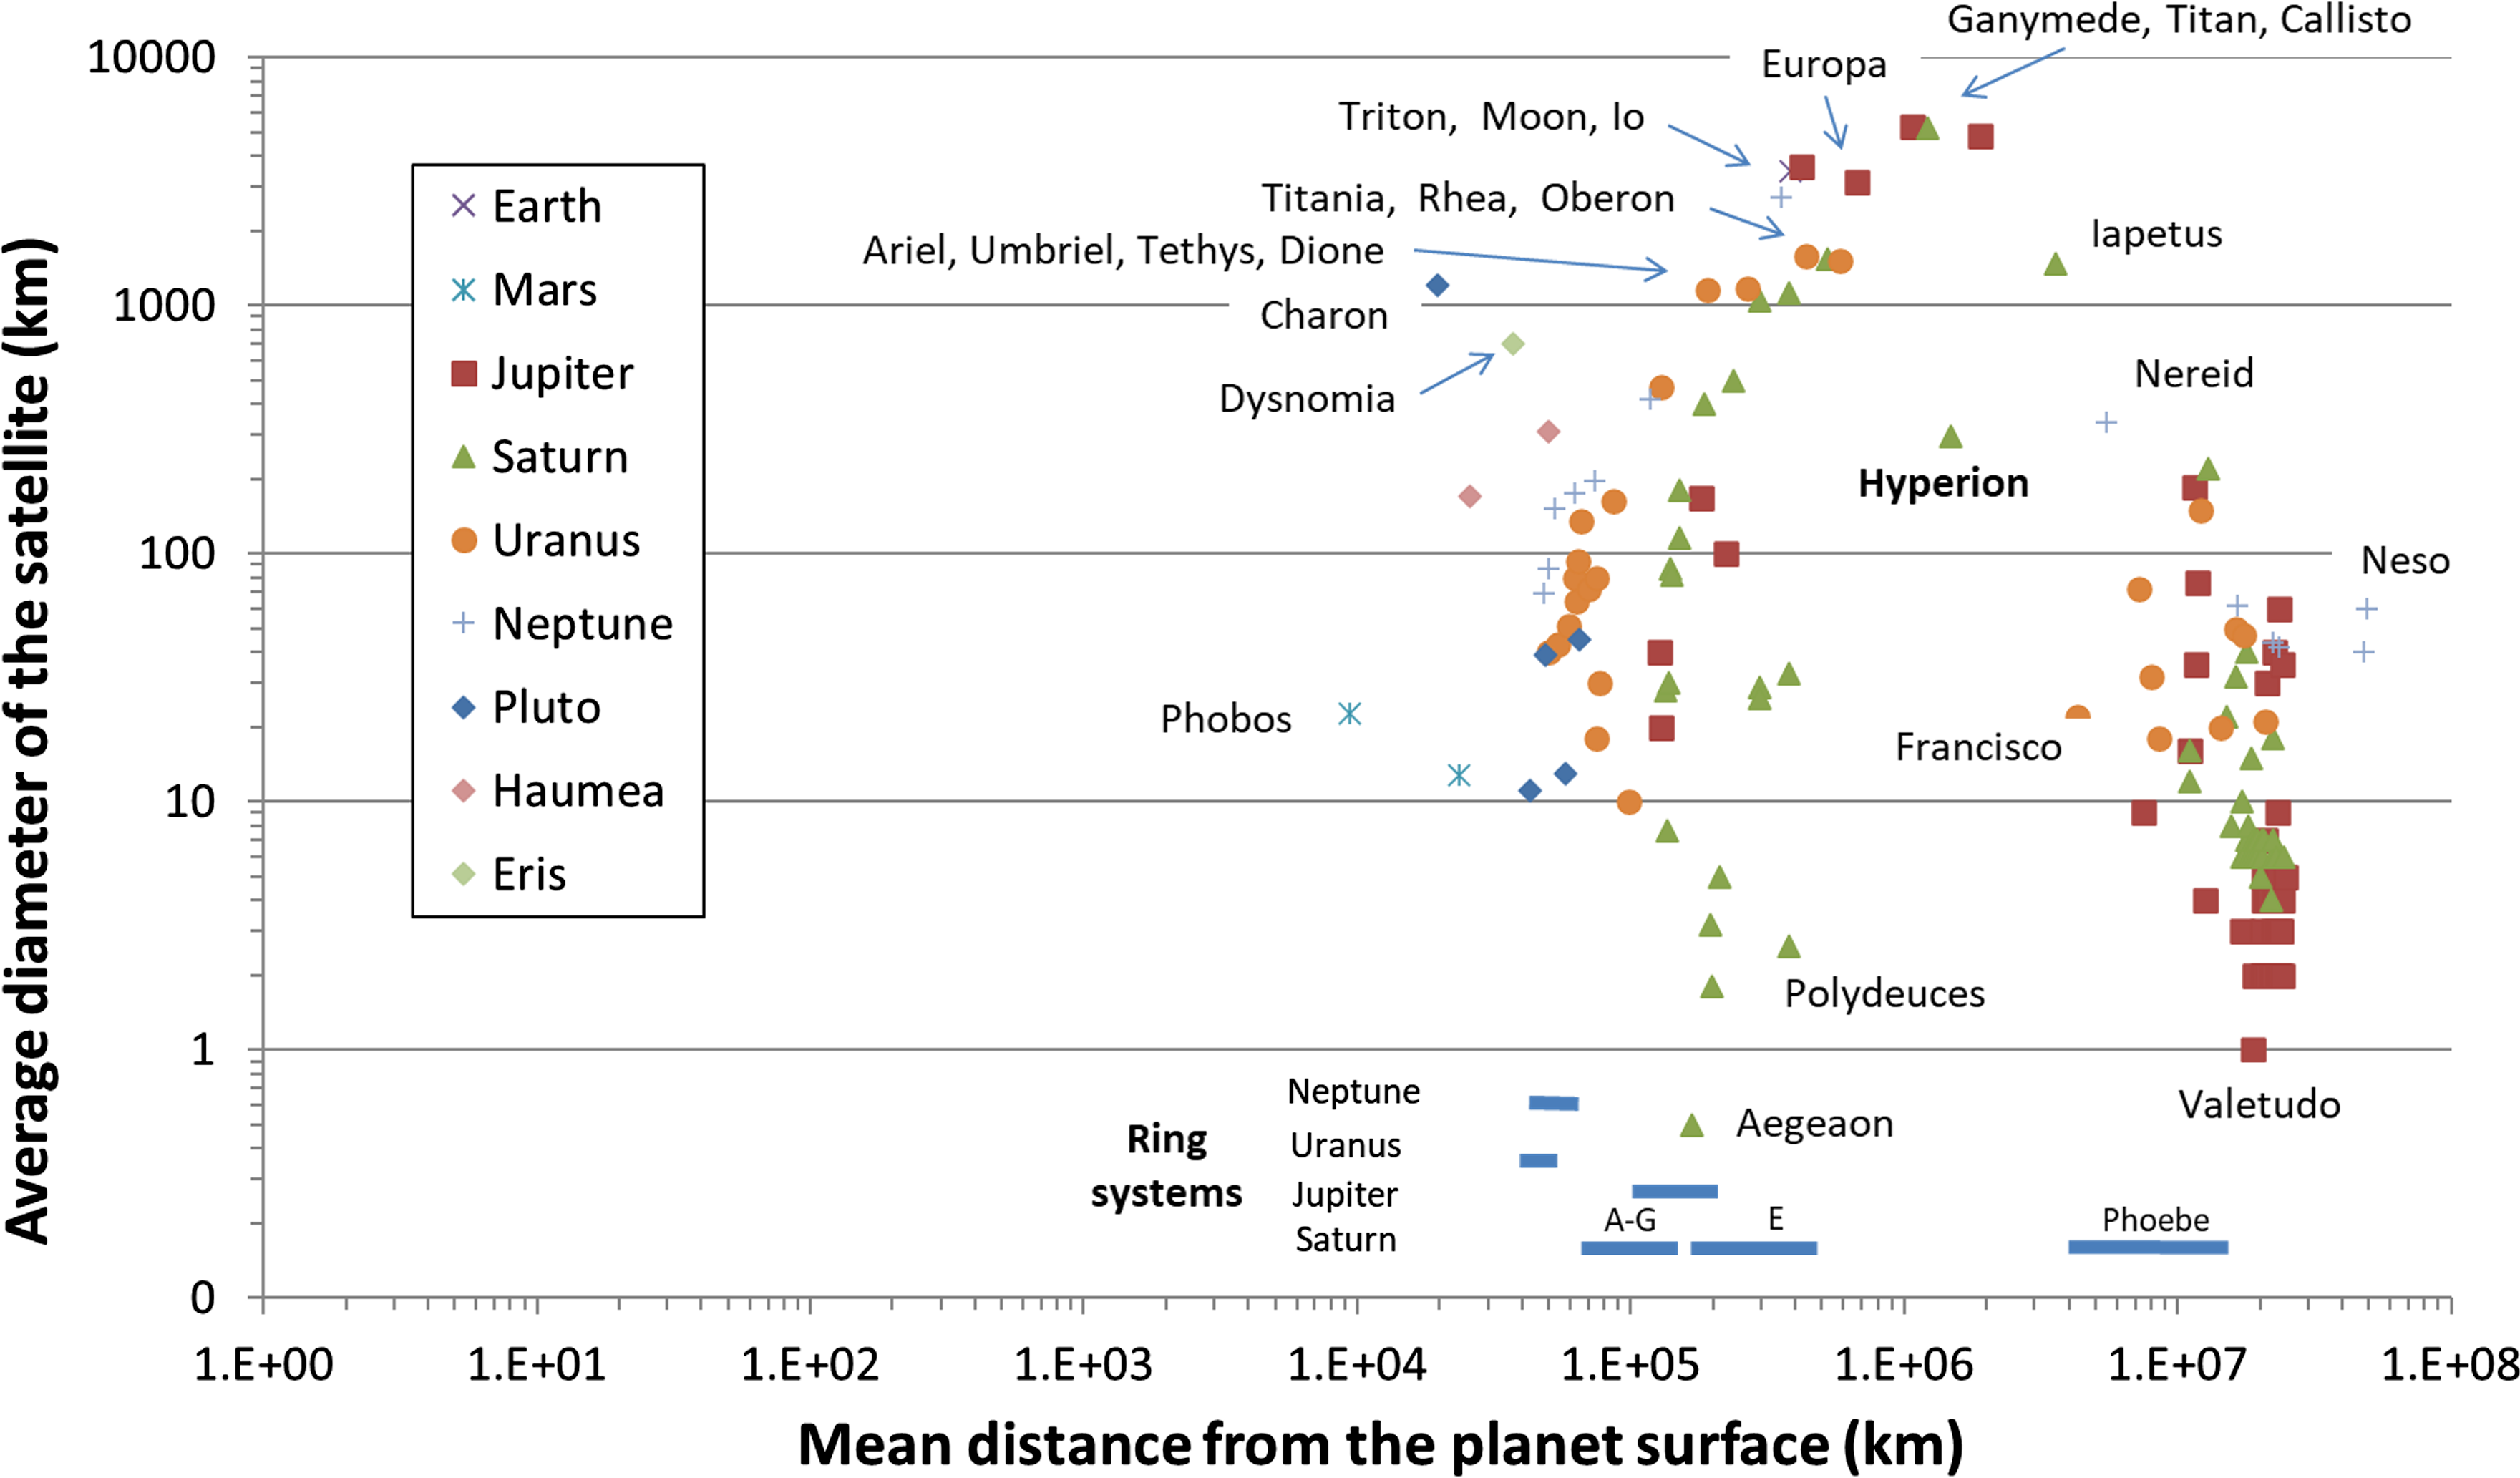
Figure 1. The mean diameters of 156 named natural satellites in the Solar System (as of late 2019) plotted as a function of their mean distance from the parent body (note log scales on both axes). For reference, the major ring systems of the gas giant planets have been included at their respective distances from the relevant planet, but the locations of these rings have only a general relationship to the vertical (diameter) axis. Some of the significant satellites have been named on the plot for ease of reference to the text.

Figure 2. Individual relationships of satellite diameter and distance from the parent planet for the gas giants (a) Jupiter, (b) Saturn, (c) Uranus and (d) Neptune. All show a complete or near (for Saturn) absence of smaller satellites for parent-satellite distances between 400,000 and 4 million km. The positions of the approximate lower diameter limit of the ‘clearing’ satellites for each planet is indicated by dashed lines.
The gap in parent-satellite distances is particularly evident when the distribution is plotted for each of the individual gas giant planets Jupiter, Saturn, Uranus, and Neptune since these all have multiple satellites orbiting at distances on both sides of the exclusion zone (Figure 2). The inner planets with satellites, namely, Earth and Mars, along with the dwarf planets Pluto, Haumea, and Eris, have only one or very few satellites and these moons do not span both sides of the ‘exclusion zone’ so they do not display an obvious clearing gap.
The 16 satellites larger than
![]() $1\,000\,\mathrm{km}$
in diameter are distributed across the top of the horseshoe, ranging from a distance from the parent of
$1\,000\,\mathrm{km}$
in diameter are distributed across the top of the horseshoe, ranging from a distance from the parent of
![]() $191\,000\,\mathrm{km}$
(
$191\,000\,\mathrm{km}$
(
![]() $1 158\,\mathrm{km}$
Ariel on Uranus) to 3.5 million km (
$1 158\,\mathrm{km}$
Ariel on Uranus) to 3.5 million km (
![]() $1\,468\,\mathrm{km}$
Iapetus on Saturn). This striking clustering of large (especially the largest) satellites in the middle of the distance distribution occurs regardless of the parent planet. While clearly highlighted by the use of a logarithmic scale, the distribution mimics the diameter-distance relationship observed in the case of the largest planets in the Solar System, but is not discussed further here.
$1\,468\,\mathrm{km}$
Iapetus on Saturn). This striking clustering of large (especially the largest) satellites in the middle of the distance distribution occurs regardless of the parent planet. While clearly highlighted by the use of a logarithmic scale, the distribution mimics the diameter-distance relationship observed in the case of the largest planets in the Solar System, but is not discussed further here.
Charon (
![]() $1\,208\,\mathrm{km}$
in diameter) at a distance of only
$1\,208\,\mathrm{km}$
in diameter) at a distance of only
![]() $20\,000\,\mathrm{km}$
from Pluto is an exception to the clustering of the other large satellites (Figure 1) but, while of a similar diameter to Ariel, Charon is distinguished from the group in that it is more properly classified as the smaller component of a ‘binary dwarf planet’ system than as a ‘conventional’ satellite of Pluto (Sutherland & Kratter Reference Sutherland and Kratter2019). This is because the centre of mass of the Pluto-Charon system lies outside the surface of Pluto; Eris and its lone satellite Dysnomia (diameter
$20\,000\,\mathrm{km}$
from Pluto is an exception to the clustering of the other large satellites (Figure 1) but, while of a similar diameter to Ariel, Charon is distinguished from the group in that it is more properly classified as the smaller component of a ‘binary dwarf planet’ system than as a ‘conventional’ satellite of Pluto (Sutherland & Kratter Reference Sutherland and Kratter2019). This is because the centre of mass of the Pluto-Charon system lies outside the surface of Pluto; Eris and its lone satellite Dysnomia (diameter
![]() $700\,\mathrm{km}$
with a semimajor axis of
$700\,\mathrm{km}$
with a semimajor axis of
![]() $37\,000\,\mathrm{km}$
; Brown & Butler (Reference Brown and Butler2018)) are in a similar situation.
$37\,000\,\mathrm{km}$
; Brown & Butler (Reference Brown and Butler2018)) are in a similar situation.
For satellites smaller than
![]() $1\,000\,\mathrm{km}$
, the distribution of parent-satellite distances occurs in two almost exclusive populations (i.e., the sides, or lobes, of the horseshoe in Figures 1 and 2). One lobe consists of satellites orbiting between
$1\,000\,\mathrm{km}$
, the distribution of parent-satellite distances occurs in two almost exclusive populations (i.e., the sides, or lobes, of the horseshoe in Figures 1 and 2). One lobe consists of satellites orbiting between
![]() $10\,000\,\mathrm{km}$
(
$10\,000\,\mathrm{km}$
(
![]() $22.7\,\mathrm{km}$
Phobos on Mars) and
$22.7\,\mathrm{km}$
Phobos on Mars) and
![]() $400\,000\,\mathrm{km}$
(
$400\,000\,\mathrm{km}$
(
![]() $2.6\,\mathrm{km}$
Polydeuces on Saturn) from their parent planet, while the other lobe includes satellites located between 4 million km (
$2.6\,\mathrm{km}$
Polydeuces on Saturn) from their parent planet, while the other lobe includes satellites located between 4 million km (
![]() $22\,\mathrm{km}$
Francisco on Uranus) and 50 million km (
$22\,\mathrm{km}$
Francisco on Uranus) and 50 million km (
![]() $60\,\mathrm{km}$
Neso on Neptune) from their parent.
$60\,\mathrm{km}$
Neso on Neptune) from their parent.
The ring systems of the planets occur between 40 000 and 20 million km from their parent but they likewise eschew the region between 400 000 and 4 million km; the rings are shown as short blue bars along the horizontal axis, at the base of the vertical axis in Figure 1. Also, it is clear that the vast majority of the really small satellites (less than
![]() $10\,\mathrm{km}$
in diameter) are located in the lobe with the largest distance from the parent body. The exception is the small number of Saturnian ring moonlets and ring shepherd satellites that fall in the closest lobe, embedded in and between that planet’s A-G and E ring systems.
$10\,\mathrm{km}$
in diameter) are located in the lobe with the largest distance from the parent body. The exception is the small number of Saturnian ring moonlets and ring shepherd satellites that fall in the closest lobe, embedded in and between that planet’s A-G and E ring systems.
For Saturn, several large satellites, albeit with diameters less than
![]() $1\,000\,\mathrm{km}$
in diameter, are positioned inside or near the exclusion zone between these two lobes. However, all of these moons have special orbital relationships with neighbouring larger satellites that have stabilised their orbits within the gap through gravitational resonance of one sort or another. These exceptional satellites are the alkyonides Methone, Anthe and Pallene that have dynamical relationships with Mimas and Enceladus; Telesto, Calypso, Helene and Polydeuces, that are the Trojans of Tethys and Dione, respectively; and Hyperion, that has a 3:4 orbital resonance with Titan (Peale Reference Peale1999; Showalter & Hamilton Reference Showalter and Hamilton2015).
$1\,000\,\mathrm{km}$
in diameter, are positioned inside or near the exclusion zone between these two lobes. However, all of these moons have special orbital relationships with neighbouring larger satellites that have stabilised their orbits within the gap through gravitational resonance of one sort or another. These exceptional satellites are the alkyonides Methone, Anthe and Pallene that have dynamical relationships with Mimas and Enceladus; Telesto, Calypso, Helene and Polydeuces, that are the Trojans of Tethys and Dione, respectively; and Hyperion, that has a 3:4 orbital resonance with Titan (Peale Reference Peale1999; Showalter & Hamilton Reference Showalter and Hamilton2015).
The large majority of the small satellites in the outer lobe beyond 4 million km from the gas giants (unlike those located in the inner lobe) generally have highly eccentric orbits, large inclinations to the ecliptic, and retrograde orbits. Indeed, all but one of the 38 named satellites at a distance of more than 19 million km from Jupiter (Figures 1 and 2) have retrograde orbits and all but two of these have eccentricities above 0.10. For Saturn, 21 of the 28 named satellites further than 12 million km from the planet have retrograde orbits, and all have high eccentricities and large inclinations. For Uranus, eight of the nine named satellites beyond 4 million km (and none closer) have retrograde orbits and similarly large eccentricities and inclinations. Of the six satellite further away than Triton on Neptune, three have retrograde orbits and all have high inclinations and eccentricities.
Retrograde, high eccentricity and high inclination orbital characteristics have been taken to indicate that these moons are captured small bodies (Nesvorný, Vokrouhlický, & Morbidelli Reference Nesvorný, Vokrouhlický and Morbidelli2007; Nesvorný, Vokrouhlický, & Deienno Reference Nesvorný, Vokrouhlický and Deienno2014) that came too close to the planet after approaching the side of the planet that is rotating towards it (Astakhov et al. Reference Astakhov, Burbanks, Wiggins and Farrelly2003). Triton (
![]() $2\,705\,\mathrm{km}$
in diameter and only
$2\,705\,\mathrm{km}$
in diameter and only
![]() $355\,000\,\mathrm{km}$
from its parent planet) is the only large satellite on any planet to have a retrograde orbit and high inclination. Since it also has a composition similar to Pluto it is probably a dwarf planet captured from the Kuiper belt (Agnor & Hamilton Reference Agnor and Hamilton2006).
$355\,000\,\mathrm{km}$
from its parent planet) is the only large satellite on any planet to have a retrograde orbit and high inclination. Since it also has a composition similar to Pluto it is probably a dwarf planet captured from the Kuiper belt (Agnor & Hamilton Reference Agnor and Hamilton2006).
For the gas giants, all of the satellites with prograde orbits lie closer to their parent planet than the massive satellites and all are likely to have been formed in situ.
3. Discussion
It is not immediately clear why a gap of around 3.6 million km exists between the two populations of satellites below
![]() $1\,000\,\mathrm{km}$
in diameter. However, it is significant that the 11 largest (and therefore, most massive) satellites with diameters greater than
$1\,000\,\mathrm{km}$
in diameter. However, it is significant that the 11 largest (and therefore, most massive) satellites with diameters greater than
![]() $1\,400\,\mathrm{km}$
lie in this region between 400 000 and 4 million km. Four of the six satellites with diameters between 600 and
$1\,400\,\mathrm{km}$
lie in this region between 400 000 and 4 million km. Four of the six satellites with diameters between 600 and
![]() $1\,400\,\mathrm{km}$
lie close to the lower edge of this gap, and the other two, Charon and Dysnomia, lie significantly below
$1\,400\,\mathrm{km}$
lie close to the lower edge of this gap, and the other two, Charon and Dysnomia, lie significantly below
![]() $400\,000\,\mathrm{km}$
, for reasons explained above.
$400\,000\,\mathrm{km}$
, for reasons explained above.
3.1. Evolution of planetary and satellite systems
There has been much discussion of the dynamical evolution of the planets and the Kuiper Belt (Batygin & Brown Reference Batygin and Brown2010; Tsiganis et al. Reference Tsiganis, Gomes, Morbidelli and Levison2005; Hahn & Malhotra Reference Hahn and Malhotra1999; Kokubo & Ida Reference Kokubo and Ida1995) including their formation by accretion of a circumsolar solids and gas disk (Pollack et al. Reference Pollack, Hubickyj, Bodenheimer, Lissauer, Podolak and Greenzweig1996; Alibert et al. Reference Alibert, Mordasini, Benz and Winisdoerffer2005; Bitsch et al. Reference Bitsch, Izidoro, Johansen, Raymond, Morbidelli, Lambrechts and Jacobson2019), the development of their orbital eccentricity, and their movement inwards or outwards due to an exchange of orbital angular momentum with planetesimals (Nesvorný Reference Nesvorný2018). Specifically, Soter (Reference Soter2006) concluded that ‘there is a tendency of disk evolution in a mature system to produce a small number of large bodies (planets) in non-intersecting or resonant orbits, which prevent collisions between them’.
Although none of these papers considers the formation and evolution of the systems of natural satellites on the planets, it might be assumed that related dynamics may be in play as those that formed the planets. The ‘gas-starved’ model of Canup & Ward (Reference Canup and Ward2002) and (Reference Canup and Ward2006) is the most successful model for the formation of the large satellites of the giant planets; this model has been summarised, and an alternative model proposed, by Batygin & Morbidelli (Reference Batygin and Morbidelli2020). It is likely that most of the inner, prograde planetary satellites have formed by the accretion of dust and gas in a local disk that has been subsumed by the planet from the circumsolar solar disk. On the other hand, the outer, mostly retrograde and highly eccentric and inclined satellites probably represent captured bodies that had formed elsewhere.
It is suggested here that the gap in the parent-satellite distance distribution in Figures 1 and 2 exists because the large satellites on each planet have, over time, gravitationally ‘cleared’ smaller bodies from their respective orbital regions around the planet, just as the planets have cleared other bodies from the region of their orbits around the Sun.
Specifically, the four Galilean satellites appear to have cleared all of the other putative satellites of Jupiter (red squares in Figures 1 and 2) that may have previously existed in their vicinity, Titan has cleared any potential rings between the E and Phoebe rings along with all of the satellites in its vicinity (except Hyperion) around Saturn (green triangles), Titania and Oberon have cleared any other satellites of Uranus (orange circles) from their orbital region, and Triton has cleared any other satellites of Neptune (plus signs).
It is noted that wide separations between satellite orbits do not necessarily imply that this has occurred through gravitational clearing. Indeed, a more massive, distant satellite may exert a much larger gravitational influence than the closer satellite and/or may be in a resonant orbital relationship with it. Also, outward migration of the satellites due to tidal forces may also generate increased separations and resonant relationships that mimic the effects of clearing.
Nonetheless, the prospect of orbital clearing as a factor in producing the non-random diameter-distance relationship in Figures 1 and 2 is explored in detail below.
3.2. Domain of influence and orbital stability of a celestial body
Two parameters have been used to describe the influential relationship between a large and a small celestial body in close proximity. The so-called ‘sphere of influence’ (SoI) has been used primarily for spacecraft mission planning. Its radius is provided by Equation (1):
where a is the semimajor axis of the orbit of the smaller object around the larger body, and m and M are the masses of the smaller and larger objects, respectively. At a distance of a lunar spacecraft from the larger body (i.e., the Earth) less than the SoI, the satellite’s orbit can be approximated as motion around the Earth, perturbed by the smaller one (i.e., the Moon), whereas outside the SoI, the satellite’s motion is approximated as being around the Moon, perturbed by the Earth.
The closely related Hill (or Roche) sphereFootnote b Hamilton & Burns (Reference Hamilton and Burns1991) of a celestial body is the region in which it dominates the attraction of satellites; the outer shell of that region constitutes a zero-velocity surface. It is used to determine the distance from the larger body out to which the smaller object remains in a stable orbit. The radius of the Hill sphere (Hs) is given inEquation (2):
where the parameters have the same meaning as in Equation (1), and eccentricity of the orbit is negligible.
Itis not obvious which of the SoI or the Hs is more relevant in determining how closely objects can be placed around a star or planet, but it is a widely used criterion for determining orbital stability in two-body systems (Gladman Reference Gladman1993). For compact systems of more than two bodies—the situation under consideration in the current work—scaling through an exponent of 1/4 in Equation (2) has been shown to work better than 1/3 (Petit et al. Reference Petit, Pichierri, Davies and Johansen2020).
A body that forms or strays within the larger body’s SoI or Hs is unlikely to be captured permanently by that body (unless another influence comes into play, and it loses energy) but it may spend a few orbits around the larger body before returning to heliocentric orbit. Reid (Reference Reid2015) has argued that no ‘fourth order’ objects, namely, satellites of satellites, have been observed in the Solar System because tidal orbital evolution of these objects would have caused them to spiral into the parent (synchronous) satellite early in their history.
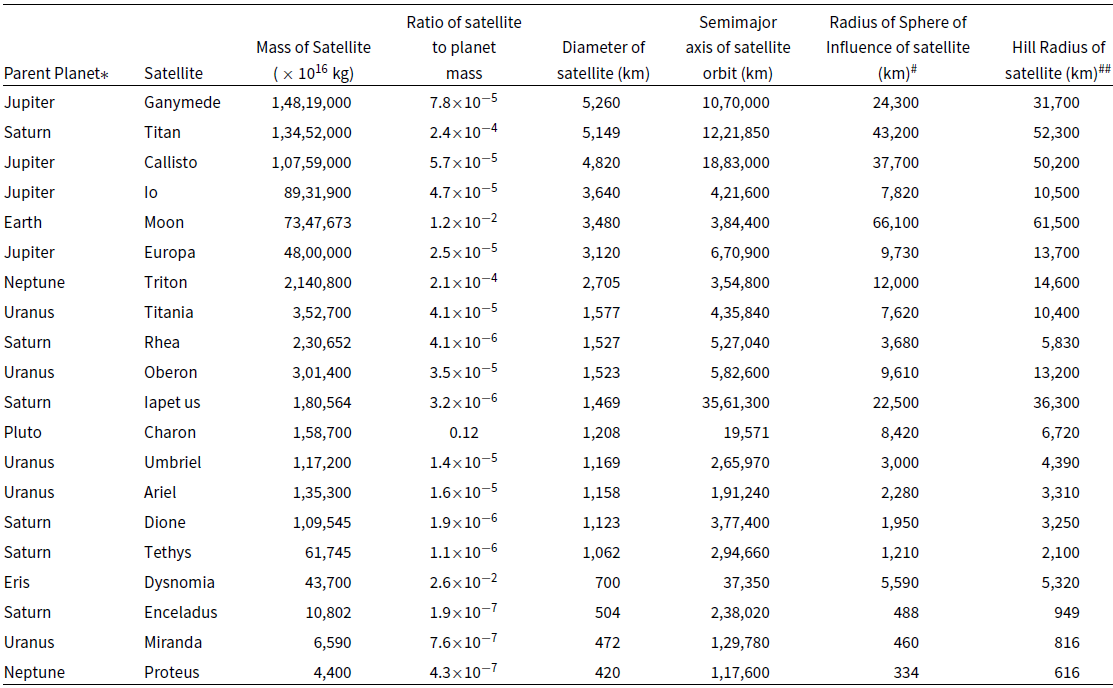
The SoI and Hs radii for the 20 largest satellites in the Solar System have been calculated using Equations (1) and (2) and are presented in Table 1, in descending order of satellite diameter. All of the satellites bar the last in this list, Proteus, have a spherical or near-spherical shape. All appear to have cleared their orbits, as judged from the diameter-distance distributions in Figures 1and 2.
Table 1. Mass, size, orbital dimensions and SoI radius of the 20 largest satellites in the Solar System.
*The masses (kg) of the planets: Earth
![]() $5.972 \times 10^{24}$
, Jupiter
$5.972 \times 10^{24}$
, Jupiter
![]() $1.898 \times 10^{27}$
, Saturn
$1.898 \times 10^{27}$
, Saturn
![]() $5.683 \times 10^{26}$
, Uranus
$5.683 \times 10^{26}$
, Uranus
![]() $8.681 \times 10^{25}$
, Neptune
$8.681 \times 10^{25}$
, Neptune
![]() $1.024 \times 10^{26}$
, Pluto
$1.024 \times 10^{26}$
, Pluto
![]() $1.309 \times 10^{22}$
, Eris
$1.309 \times 10^{22}$
, Eris
![]() $1.66 \times 10^{22}$
.
$1.66 \times 10^{22}$
.
#Calculated from
![]() $\mathrm{R}_{\mathrm{SOI}} \approx a(m/M)^{2/5}$
, where a is the semimajor axis of the satellite’s orbit around the planet, and m and M are the masses of the satellite and the planet, respectively.
$\mathrm{R}_{\mathrm{SOI}} \approx a(m/M)^{2/5}$
, where a is the semimajor axis of the satellite’s orbit around the planet, and m and M are the masses of the satellite and the planet, respectively.
##Calculated from
![]() $\mathrm{R}_{\mathrm{Hs}} \approx a(m/3M)^{1/3}$
, where a is the semimajor axis of the satellite’s orbit around the planet, and m and M are the masses of the satellite and the planet, respectively.
$\mathrm{R}_{\mathrm{Hs}} \approx a(m/3M)^{1/3}$
, where a is the semimajor axis of the satellite’s orbit around the planet, and m and M are the masses of the satellite and the planet, respectively.
Raw data is from https://solarsystem.nasa.gov/moons/in-depth/, https://ssd.jpl.nasa.gov/?sat_elem, and https://ssd.jpl.nasa.gov/?sat_phys_par; formula from https:// en.wikipedia.org/wiki/Sphere_of_Influence_(astrodynamics)#Table_of_selected_SOI_radii
The SoI and Hs radii of the larger bodies (planets, dwarf planets and the Moon) and the Galilean satellites and their adjacent small moons are plotted in Figures 3(a) and (b) respectively.

Figure 3. Comparison of the radius of the Sphere of Influence (SoI) and Hill Sphere (Hs) for (a) the larger bodies in the Solar System (planets, dwarf planets and the Moon) and(b) the Galilean satellites of Jupiter and their adjacent smaller moons.
Figure 3 shows that the Hs radius is larger than the SoI radius by a factor of between 1.1 and 1.9 for the major planets and the Galilean satellites, but for the dwarf planets Pluto, Ceres and Eris, and for smaller satellites of Jupiter, Hs is between 2.6 and 6.0 times larger than SoI. Interestingly, for the systems that have been likened to binary planets, namely Pluto-Charon, Earth-Moon and Eris-Dysnomia, the Hs value for the satellite is smaller than the SoI, viz., 0.95, 0.93, and 0.80, respectively (Table 1).
With the exception of Mars, the upper limit of influenceFootnote c for the planets is larger than the largest observed planet-satellite apoapsis distances for each system (Figures 1, 2 and 3(a)) by a factor of between 1.50 (Neptune-Neso) and 3.91 (Earth-Moon); not unexpectedly for the unusual Mars system, the Mars-Deimos ratio is 46.0. This suggests that there is scope for many additional (non-Trojan) stable satellites to be discovered on allplanets.
Calculations of the Hs values for the Galilean satellites and their adjacent smaller moons (Figure 3(b)) are given particular attention in the discussion below in order to investigate their influence on these close neighbours in the context of large satellite ‘clearing’ capability.
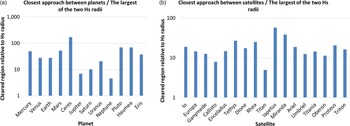
In Figure 4(a), the closest distance of approach of adjacent planets and dwarf planets and in Figure 4(b) the closest approach of the Galilean satellites to their nearest neighbours have been expressed in multiples of the corresponding largest Hs value of the pair of bodies, calculated from a comparison of their orbital semimajor axes, assuming zero orbital eccentricity.
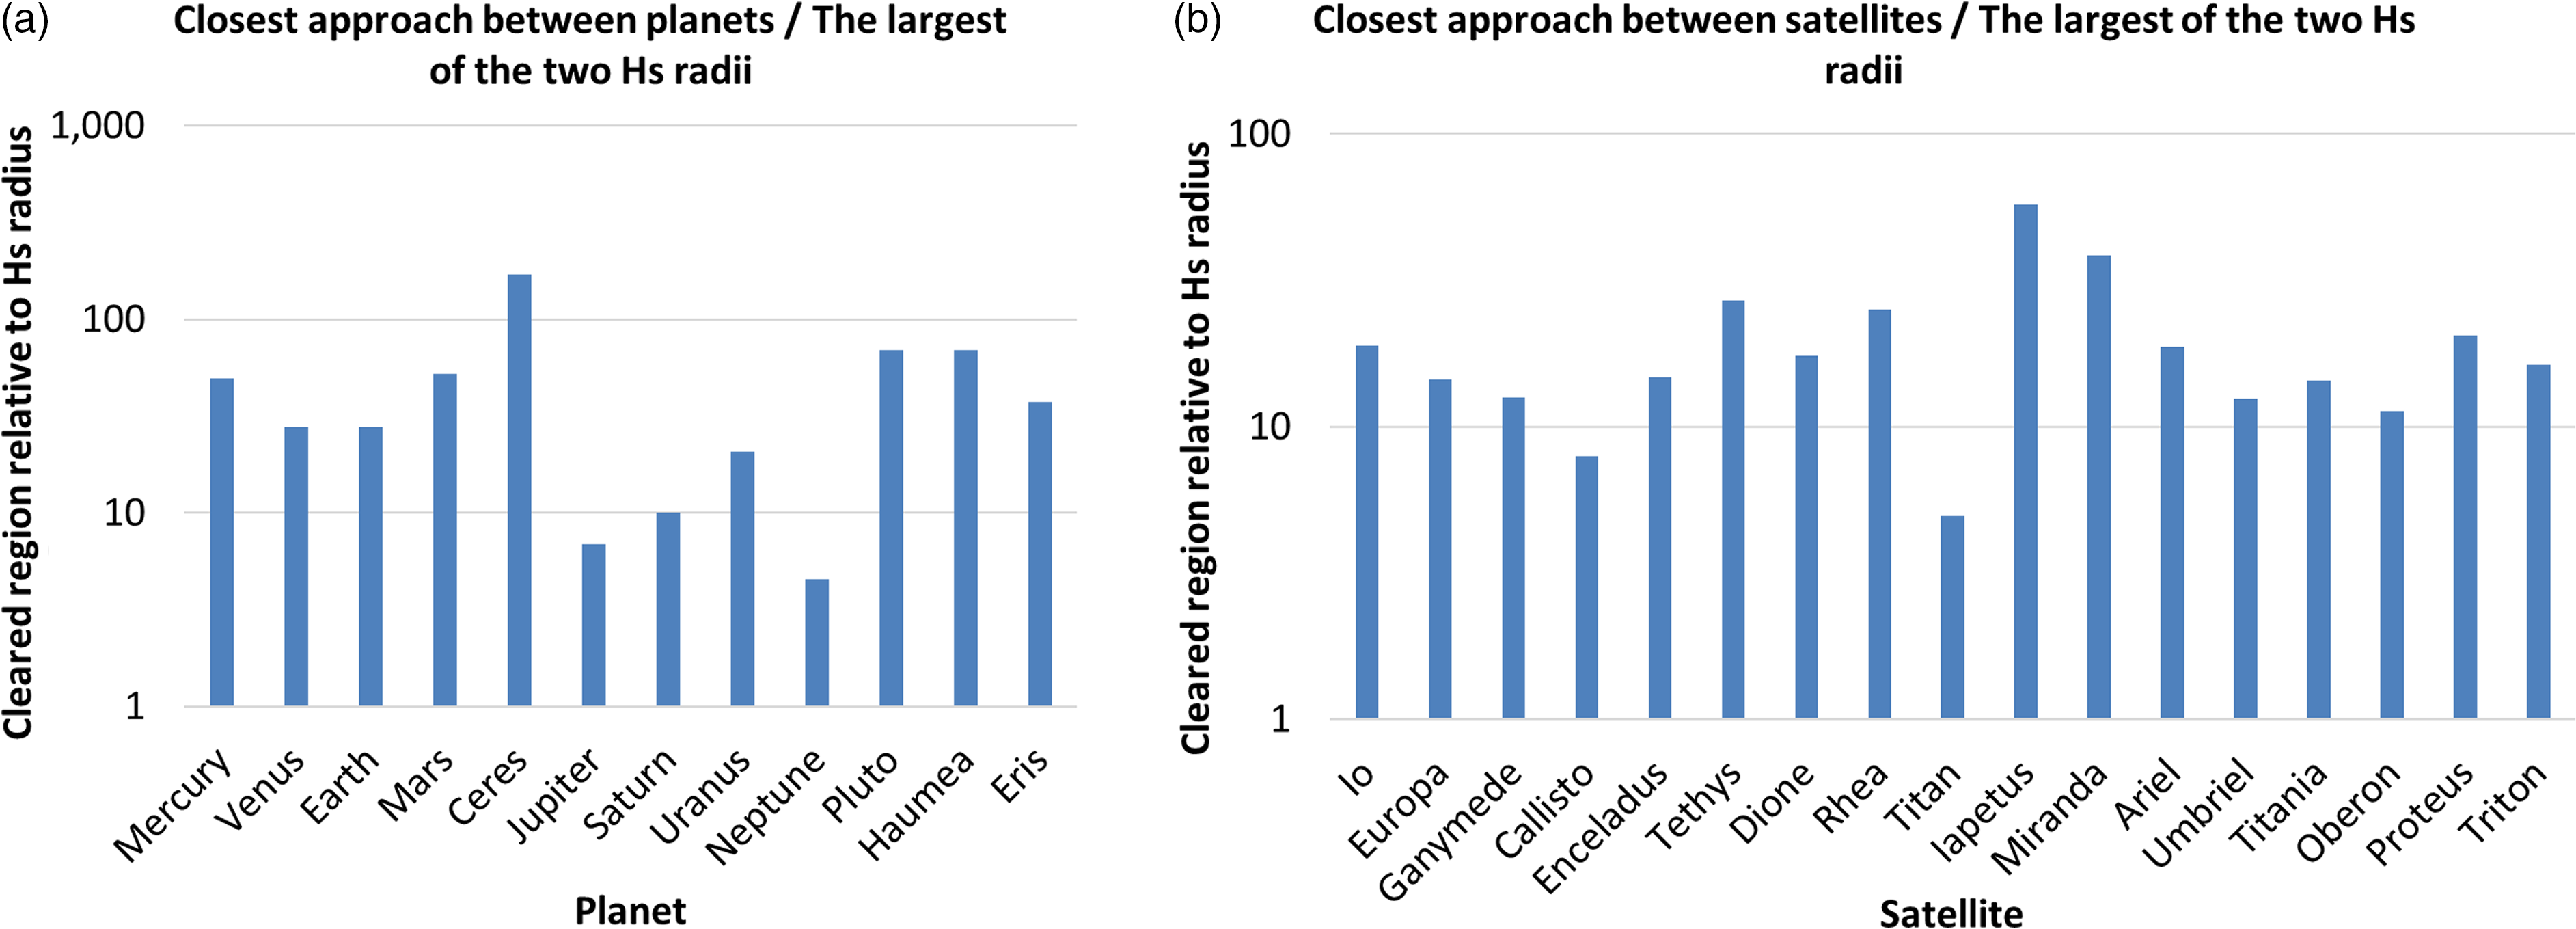
Figure 4. Closest separation distance between (a) the planets and dwarf planets, and (b) 17 of the largest satellites and their nearest neighbours, each expressed as a multiple of the largest of the two Hs radii of the relevant bodies.
The ratio of closest approach distance to the largest Hs radius for the adjacent planets and/or dwarf planet pairs (Figure 4(a)) varies roughly with the diameter of the body; it is largest for the dwarf planets (37–171), intermediate for the rocky planets(27–52), and smallest for the gas giants (4.6–20.6). While the variation in multiples of Hs radius is large, it surely indicates that the region around these bodies has been effectively cleared.
In terms of the major satellites (Figure 4(b)), the ratio of closest separation distance to Hs radius varies over a similar range to the planets and dwarf planets (with the minor exception of Ceres), namely, from 4.97 (Titan) to 57.2 (Iapetus), but appears to be unrelated to the diameter of the satellite. In both sets of bodies, the minimum separation distance is around 5 times the Hs radius. Thus, if the Hs ratio has any significance in the ‘clearing’ of the vicinity of celestial bodies (Figures 1 and 2), the mechanism may be similar for the satellites as it is for the planets.
This means that displacement/ejection of the smaller satellite body to another orbit well outside the clearing zone has occurred, or the smaller body has been captured into a resonant or other special orbital relationship, such as the Lagrangian points (as for the Trojans of Tethys and Dione) and the 3:4 resonant relationship between Hyperion and Titan.
3.3. Clearing the neighbourhood around a body’s orbit
Stern & Levison(Reference Stern and Levison2002), in the context of later discussion about the definition of a ‘planet’ during the 2006 IAU general assembly, developed a theoretical basis for determining if an object orbiting a star is likely to ‘clear its neighbouring region’ of planetesimals based on the object’s mass and its orbital dimensions. This was embodied in a dimensionless parameter
![]() $\Lambda$
(lambda), a measure of a body’s ability to scatter smaller masses out of its orbital region ‘over the age of the Universe’:
$\Lambda$
(lambda), a measure of a body’s ability to scatter smaller masses out of its orbital region ‘over the age of the Universe’:
where m is the mass of the body relative to the Sun, a is the body’s semimajor axis, and k is a function of the orbital elements of the smaller body being scattered, including its orbital period, eccentricity, inclination, and the ratio of its semimajor axis to that of the larger body. Stern and Levison (hereafter SL) proposed that if
![]() $\Lambda > 1$
, the body will likely clear out smaller bodies in its orbital zone. They used this parameter to separate the gravitationally rounded, Sun-orbiting bodies into ‘Überplanets’, which are ‘dynamically important enough to have cleared their neighbouring planetesimals’, and ‘unterplanets’, the rest.
$\Lambda > 1$
, the body will likely clear out smaller bodies in its orbital zone. They used this parameter to separate the gravitationally rounded, Sun-orbiting bodies into ‘Überplanets’, which are ‘dynamically important enough to have cleared their neighbouring planetesimals’, and ‘unterplanets’, the rest.
While the SL methodology is relatively crude and did not consider numerical orbital integrations, it was successful in that the Überplanets turned out to be the eight most massive IAU solar orbiters/planets, and the Moon (if it were in a heliocentric orbit) and the unterplanets were found to be similar (if not identical) to the IAU dwarf planets (Ceres, Pluto and an unidentified Kuiper Belt object).
In order to determine if
![]() $\Lambda$
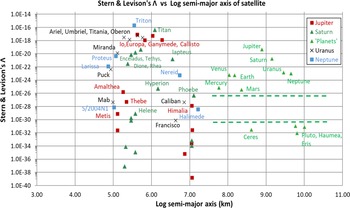
can also be used to ascertain whether large satellites are capable of clearing their orbital domains, Equation (3) has been applied here to the major satellites of the gas giants. Adjustments to Equation (3) so that it bears on satellites rather than planets are that (i) m is the mass of each satellite relative to its specific parent planet (rather than the Sun), and (ii) a is the satellite’s semimajor axis (rather than the planet’s). To calibrate against the planets, Equation (3) has also been applied (in its original form) to the Sun-planet systems and incorporated with the other results in Figure 5.
$\Lambda$
can also be used to ascertain whether large satellites are capable of clearing their orbital domains, Equation (3) has been applied here to the major satellites of the gas giants. Adjustments to Equation (3) so that it bears on satellites rather than planets are that (i) m is the mass of each satellite relative to its specific parent planet (rather than the Sun), and (ii) a is the satellite’s semimajor axis (rather than the planet’s). To calibrate against the planets, Equation (3) has also been applied (in its original form) to the Sun-planet systems and incorporated with the other results in Figure 5.

Figure 5. Distribution of the Stern & Levison (Reference Stern and Levison2002) parameter
![]() $\Lambda$
, plotted as a function of the logarithm of the semimajor axis of the planets, dwarf planets and satellites of the gas giants. The zone between bodies classified by SL as Überplanets and unterplanets in the Solar System is designated by parallel dashed lines.
$\Lambda$
, plotted as a function of the logarithm of the semimajor axis of the planets, dwarf planets and satellites of the gas giants. The zone between bodies classified by SL as Überplanets and unterplanets in the Solar System is designated by parallel dashed lines.
The distribution of
![]() $\Lambda$
and the semimajor axes for the planets and dwarf planets in the right half of Figure 5 is identical to that found by SL, although the magnitude of
$\Lambda$
and the semimajor axes for the planets and dwarf planets in the right half of Figure 5 is identical to that found by SL, although the magnitude of
![]() $\Lambda$
is different in an absolute sense since k has been set to unity for all calculations here. The two dashed lines in the Figure delineate the region between the IAU dwarf planets and IAU planets; it shows the same gap of 5 orders of magnitude in the value of
$\Lambda$
is different in an absolute sense since k has been set to unity for all calculations here. The two dashed lines in the Figure delineate the region between the IAU dwarf planets and IAU planets; it shows the same gap of 5 orders of magnitude in the value of
![]() $\Lambda$
between these classes of bodies as discovered by SL.
$\Lambda$
between these classes of bodies as discovered by SL.
The
![]() $\Lambda$
values for the largest satellite systems of each of the four giant planets have been included in Figure 5 for ease of comparison with the results obtained for the planets and dwarf planets, despite the fact that k is different for each of these planetary systems due to differences in their orbital characteristics (viz., mass of the planet, relative and absolute orbital velocity, inclination, and ratio of semi-major axes). While internally consistent, without recalibration each of the planetary systems of satellites is displaced slightly along the y axis relative to each other and to the system of planets and dwarf planets.
$\Lambda$
values for the largest satellite systems of each of the four giant planets have been included in Figure 5 for ease of comparison with the results obtained for the planets and dwarf planets, despite the fact that k is different for each of these planetary systems due to differences in their orbital characteristics (viz., mass of the planet, relative and absolute orbital velocity, inclination, and ratio of semi-major axes). While internally consistent, without recalibration each of the planetary systems of satellites is displaced slightly along the y axis relative to each other and to the system of planets and dwarf planets.
By following the distribution of symbols for each planetary system in Figure 5, it is clear that there is a significant gap of 8 orders of magnitude between the
![]() $\Lambda$
values for the four Galilean and the smaller satellites of Jupiter, a smaller gap of 2-3 orders of magnitude between the 6 largest and the smaller satellites of Saturn, but no consistent break between satellites of Uranus and Neptune. Thus, while the gaps in satellite distributions for Jupiter and Saturn might be used under the SL methodology to unambiguously separate the clearing and non-clearing ones, the situation is not as clear for the small number of satellites around Uranus and Neptune.
$\Lambda$
values for the four Galilean and the smaller satellites of Jupiter, a smaller gap of 2-3 orders of magnitude between the 6 largest and the smaller satellites of Saturn, but no consistent break between satellites of Uranus and Neptune. Thus, while the gaps in satellite distributions for Jupiter and Saturn might be used under the SL methodology to unambiguously separate the clearing and non-clearing ones, the situation is not as clear for the small number of satellites around Uranus and Neptune.
Soter (Reference Soter2006) proposed an observational parameter,
![]() $\mu$
, toclassify bodies in nonresonant crossing orbits into planets and non-planets:
$\mu$
, toclassify bodies in nonresonant crossing orbits into planets and non-planets:
where M is the mass of the candidate body and m is the mass of all of the other bodies that share its ‘orbital zone’. Soter proposed that if
![]() $\mu > 100$
then the body is classified as a planet. Since no such other bodies have been observed within at least 5 times the Hs radius (i.e., ‘orbital zone’) of any of the large satellites considered in the present study (presumably because they are very small or non-existent) the value of m is likely to be very small and
$\mu > 100$
then the body is classified as a planet. Since no such other bodies have been observed within at least 5 times the Hs radius (i.e., ‘orbital zone’) of any of the large satellites considered in the present study (presumably because they are very small or non-existent) the value of m is likely to be very small and
![]() $\mu$
would thus be much larger than 100 for all of the satellites. Therefore, the Soter parameter has not been explored further here.
$\mu$
would thus be much larger than 100 for all of the satellites. Therefore, the Soter parameter has not been explored further here.
Margot (Reference Margot2015) proposed another definition of planethood (albeit with specific reference to exoplanets) through a new parameter
![]() $\Pi$
(pi):
$\Pi$
(pi):
where k is a constant chosen so that
![]() $\Pi > 1$
for a body that can clear its orbital zone, M is the mass of the parent star in solar masses, and m and a are the masses and semimajor axes, respectively, of the (exoplanet) body relative to the Earth.
$\Pi > 1$
for a body that can clear its orbital zone, M is the mass of the parent star in solar masses, and m and a are the masses and semimajor axes, respectively, of the (exoplanet) body relative to the Earth.
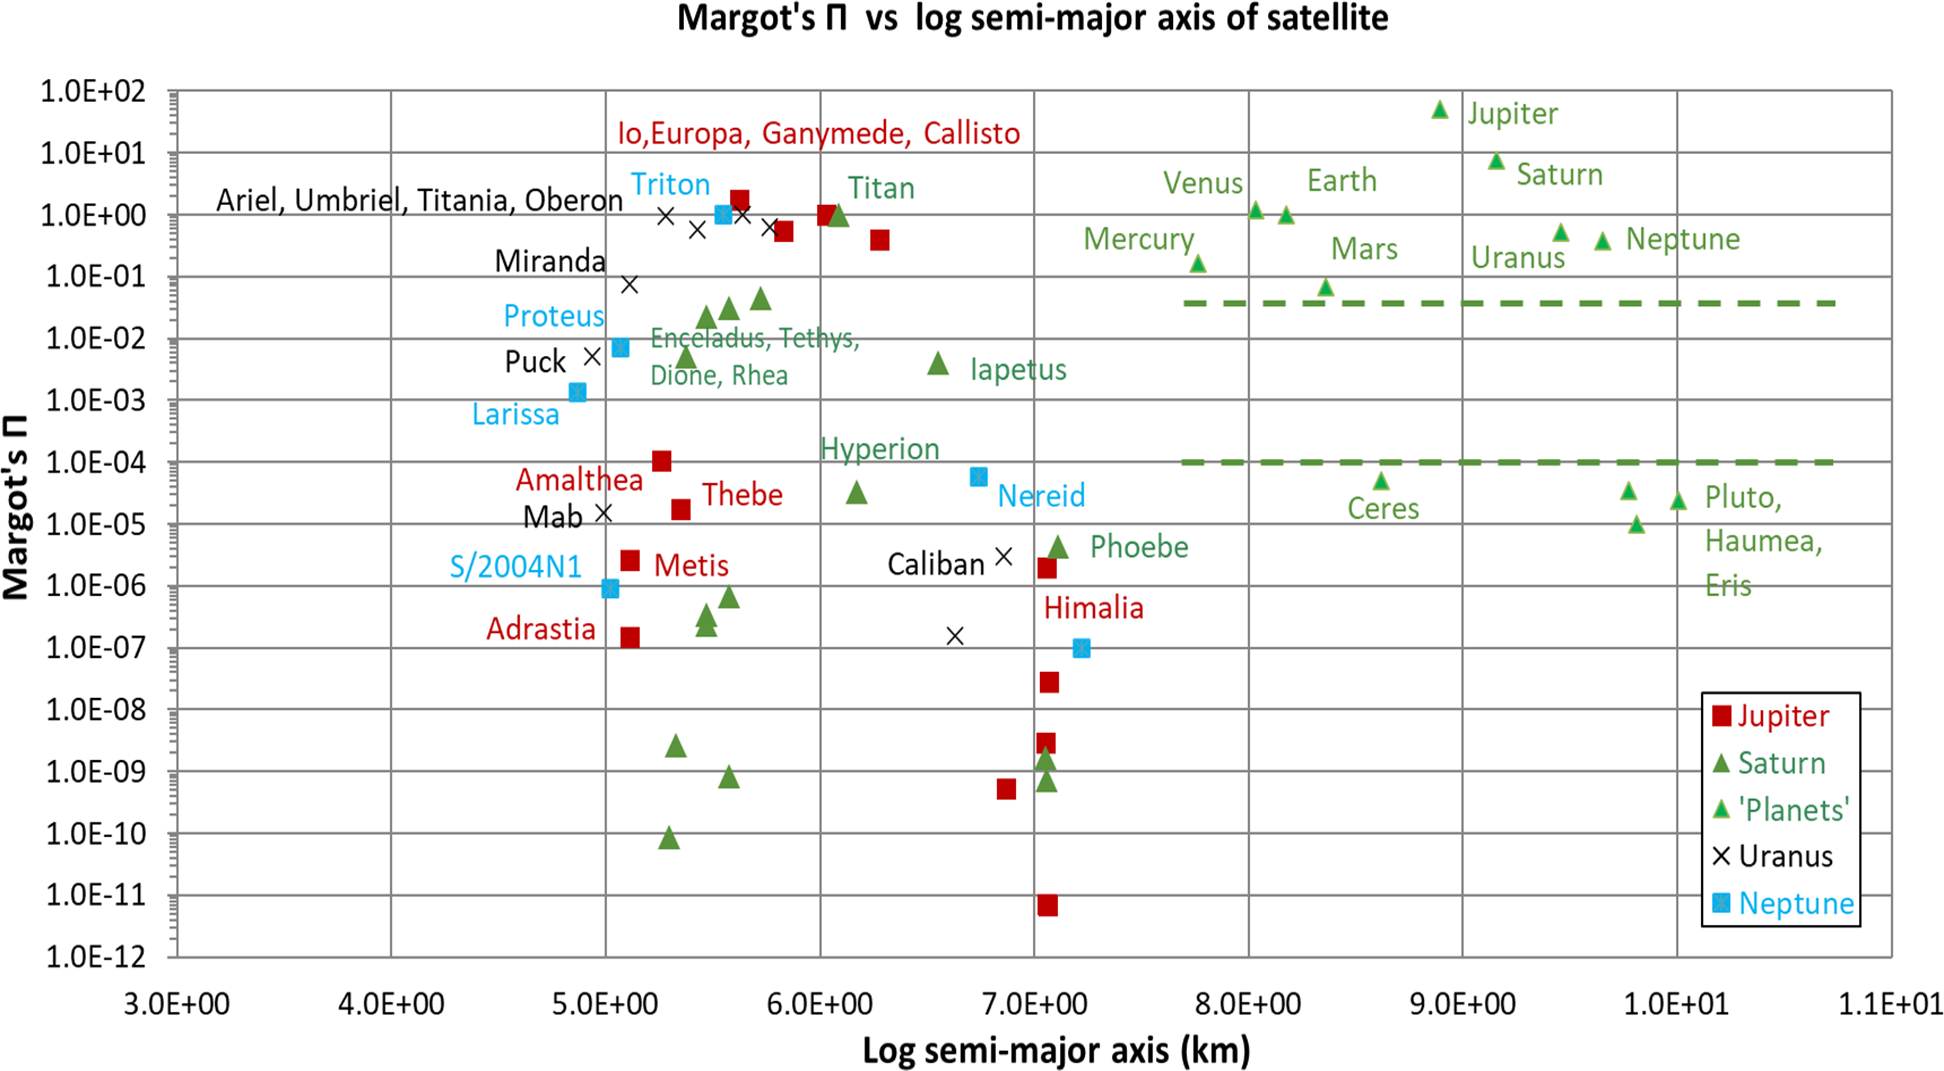
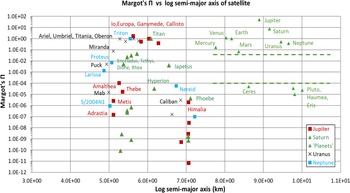
Figure 6. Distribution of the Margot (Reference Margot2015) parameter
![]() $\Pi$
, calculated using Equation (5), plotted as a function of the logarithm of the semimajor axis of the planets, dwarf planets and satellites of the gas giants. The zone between bodies classified by the IAU as planets and dwarf planets in the Solar System is designated by dashed lines.
$\Pi$
, calculated using Equation (5), plotted as a function of the logarithm of the semimajor axis of the planets, dwarf planets and satellites of the gas giants. The zone between bodies classified by the IAU as planets and dwarf planets in the Solar System is designated by dashed lines.
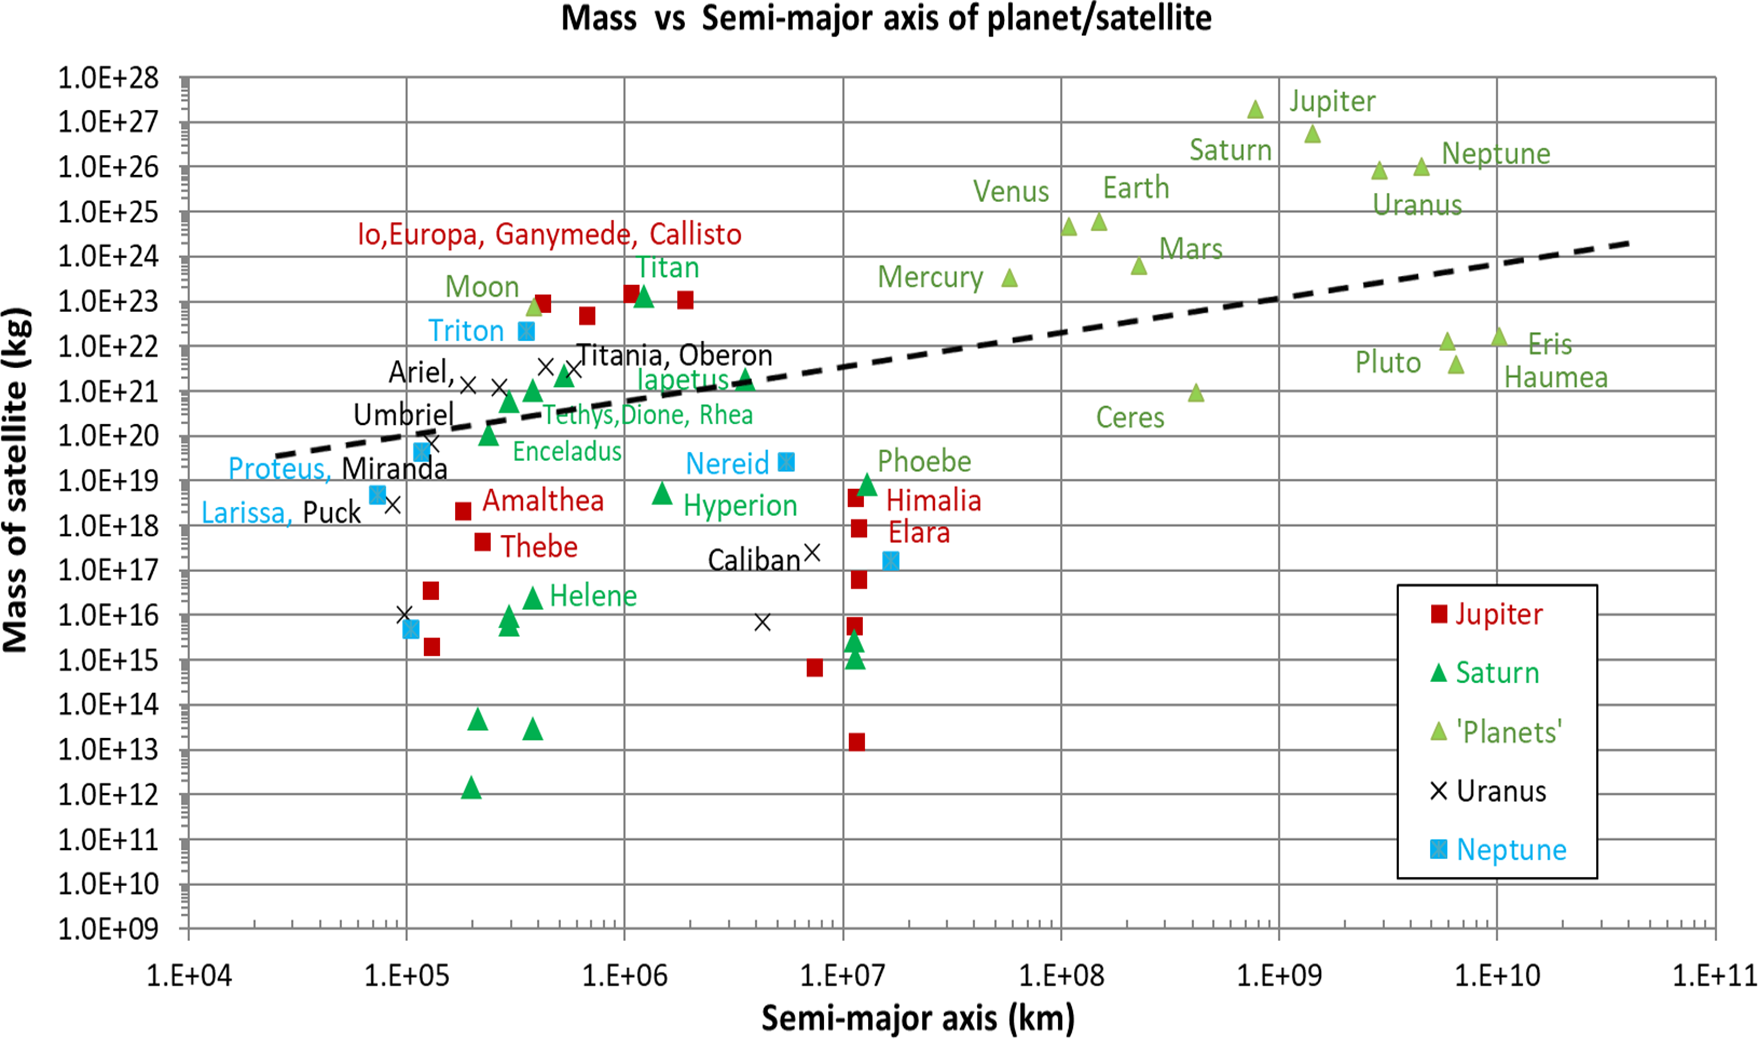
Figure 7. The relationship between the mass of a planet, dwarf planet or satellite and the logarithm of its orbital semimajor axis, as defined by Equation (8) in Margot (Reference Margot2015). The dashed line corresponds approximately to the position and slope of the line proposed by Margot (Reference Margot2015) to separate the eight planets from all other bodies in the Solar System.
Figure 6 shows the results of application of Equation (5) to the same set of planets and satellites as in Figure 5, with k and M set to 1, the latter because there is no need to normalise the mathematics to the Sun when exoplanets are not in the frame. The other adjustment made to Equation (5) in respect of the satellites is that their m and a values are normalised to the mass and semimajor axis of the specific parent planet (Jupiter, Saturn, Uranus or Neptune) rather than to the Earth.
Figure 6 shows an identical distribution of the planets and dwarf planets as does Margot’s
![]() $\Pi$
(and SL’s
$\Pi$
(and SL’s
![]() $\Lambda$
) calculation, with a similar gap of 3 orders of magnitude between the
$\Lambda$
) calculation, with a similar gap of 3 orders of magnitude between the
![]() $\Pi$
values for these two groups of bodies. The magnitude of the
$\Pi$
values for these two groups of bodies. The magnitude of the
![]() $\Pi$
values in Figure 6 are displaced relative to Margo’s
$\Pi$
values in Figure 6 are displaced relative to Margo’s
![]() $\Pi$
due to the setting of k and M to 1 in the current calculations.
$\Pi$
due to the setting of k and M to 1 in the current calculations.
Unlike SL’s parameter, Margot’s
![]() $\Pi$
reveals a much more distinct gap in the distribution of the larger and smaller gas giant satellites in the left-hand part of the Figure. Specifically, using Margot’s
$\Pi$
reveals a much more distinct gap in the distribution of the larger and smaller gas giant satellites in the left-hand part of the Figure. Specifically, using Margot’s
![]() $\Pi$
, only the Galilean moons, along with Triton, Titan, Ariel, Umbriel, Titania, Oberon and Miranda lie above the upper ’clearing line’ for the planets (0.05, or about the same value as Mars) in the Figure. This distribution of 10 large satellites (plus Miranda) is closely similar to the set of 11 large satellites that were identified as potentially having cleared their orbital regions from the distributions plotted in Figures 1 and 2. Furthermore, lowering the clearing limit to around 0.002 (i.e., nearer to the midpoint of the gap between the planets and the dwarf planets) would bring the set of possible clearing bodies closer in alignment to the set identified by SL’s
$\Pi$
, only the Galilean moons, along with Triton, Titan, Ariel, Umbriel, Titania, Oberon and Miranda lie above the upper ’clearing line’ for the planets (0.05, or about the same value as Mars) in the Figure. This distribution of 10 large satellites (plus Miranda) is closely similar to the set of 11 large satellites that were identified as potentially having cleared their orbital regions from the distributions plotted in Figures 1 and 2. Furthermore, lowering the clearing limit to around 0.002 (i.e., nearer to the midpoint of the gap between the planets and the dwarf planets) would bring the set of possible clearing bodies closer in alignment to the set identified by SL’s
![]() $\Lambda$
in Figure 5.
$\Lambda$
in Figure 5.
Equation (8) of Margot (Reference Margot2015) seeks to predict the mass of a body above which it becomes capable of clearing its orbit, through a simple plot of the mass of the body versus its semimajor axis. In this analysis Margot drew a line separating those bodies in the Sun-planet system that had cleared their orbits and those that had not, with a slope dependent on the clearing time, planet/star mass ratio, and the Hill Radius of the body.
Margot’s large-body analysis has been reproduced in Figure 7, with the additional inclusion of satellite data. The dashed line is drawn in a position and with a slope analogous to that of Margot (Reference Margot2015). When projected down in mass to the area occupied by the planetary satellites, this line differentiates between the large and small satellites in a similar way to the clearing lines in Figures 5 and 6. Once again, the satellites proposed in Figures 1 and 2 to have cleared their orbital domains all lie above the Margot line in Figure 7.
The figure shows that the mass required for clearing an orbital region reduces with the size of the semimajor axis of that orbit. It suggests that the minimum mass for clearing decreases from around
![]() $1.8\times 10^{21}\,\mathrm{kg}$
for
$1.8\times 10^{21}\,\mathrm{kg}$
for
![]() $1\,470\,\mathrm{km}$
diameter Iapetus on Saturn, with a semimajor axis of
$1\,470\,\mathrm{km}$
diameter Iapetus on Saturn, with a semimajor axis of
![]() $3.6 \times 10^6\,\mathrm{km}$
, to around
$3.6 \times 10^6\,\mathrm{km}$
, to around
![]() $5.0 \times 10^{19}\,\mathrm{kg}$
for
$5.0 \times 10^{19}\,\mathrm{kg}$
for
![]() $420\,\mathrm{km}$
diameter Proteus on Neptune, with a semimajor axis of
$420\,\mathrm{km}$
diameter Proteus on Neptune, with a semimajor axis of
![]() $1.2 \times 10^5\,\mathrm{km}$
.
$1.2 \times 10^5\,\mathrm{km}$
.
4. Summary and conclusions
Several mathematical parameters (Stern & Levison Reference Stern and Levison2002; Soter Reference Soter2006; Margot Reference Margot2015) have been assessed in terms of their ability to discriminate between Solar System bodies by virtue of their capacity to clear their orbital regions through gravitational dominance. Despite the different nature of the three parameters,
![]() $\Lambda$
,
$\Lambda$
,
![]() $\Pi$
and mass, all of these parameters, when applied to heliocentric bodies, display an obvious gap in the value of the parameter, often of several orders of magnitude, between the IAU recognised planets and the IAU dwarf planets.
$\Pi$
and mass, all of these parameters, when applied to heliocentric bodies, display an obvious gap in the value of the parameter, often of several orders of magnitude, between the IAU recognised planets and the IAU dwarf planets.
In the present study, these same three parameters have been reframed and applied to the 20 major satellites of the planets. There is a clear consistency in their implication that the 11 or so largest satellites, and perhaps satellites as small as
![]() $450\,\mathrm{km}$
, are capable of clearing, and perhaps have indeed already cleared, their orbital regions of smaller bodies out to a distance of at least 5 times their Hill Sphere.
$450\,\mathrm{km}$
, are capable of clearing, and perhaps have indeed already cleared, their orbital regions of smaller bodies out to a distance of at least 5 times their Hill Sphere.
All parameters point to there being a lower limit of ‘orbital clearing ability’ or ‘dominance of their orbital zone’ akin to that between the planets and dwarf planets. However, unlike the case of the IAU planets and dwarf planets, where the gap between these classes of objects is 5 orders of magnitude, the boundary between orbital clearing and non-clearing ability of the satellites is not always so clearly marked.
Nevertheless, the present analysis suggests that by analogy with the data for the planets, the 20 or so largest satellites are capable of clearing their orbits of smaller planetesimals. The discrimination between the clearing capacity of the larger and smaller objects is especially obvious when using the Margot (Reference Margot2015) parameter
![]() $\Pi$
, and a plot of mass versus semimajor axis. This ‘capacity to clear’ is consistent with, and may explain the (horseshoe-shaped) small satellite ‘exclusion zone’ that is observed in the distribution of the diameters and planet-satellite distances of the 156 named planetary satellites in the Solar System by association with the presence of large satellites as the dominant gravitational body in thatregion.
$\Pi$
, and a plot of mass versus semimajor axis. This ‘capacity to clear’ is consistent with, and may explain the (horseshoe-shaped) small satellite ‘exclusion zone’ that is observed in the distribution of the diameters and planet-satellite distances of the 156 named planetary satellites in the Solar System by association with the presence of large satellites as the dominant gravitational body in thatregion.
Further examination of the clearing process would benefit from numerical orbital integrations of the satellite systems around each planet similar to those by Burns & Gladman (Reference Burns and Gladman1996) for the region between the rings of Saturn to just outside the orbit of Titan, considered over time frames of millions of years.
Acknowledgements
I am grateful for the detailed contributions of an anonymous referee who provided significant insight into models for the orbital evolution of planetary and satellite systems.


