1. Introduction
The world’s polar ice sheets and ice caps are recognized as sensitive archives of ambient atmospheric conditions, and contain a unique record of climatic and environmental change. Snow, firn and ice samples recovered from low-latitude/high-altitude glaciers also have the potential to provide detailed paleo-atmospheric information, as long as such records are collected at sites where post-depositional alteration (e.g. seasonal melting, chemical redistribution) is minimal (Reference Wagenbach, Oeschger and LangwayWagenbach, 1989). High-altitude glaciochemical records often have the additional geographic advantages of (1) the ability to record mid-latitude climatic and environmental processes, (2) proximity to long-term meteorological observations, and (3) removal from boundary layer processes, and hence provide sampling of the free troposphere. Widespread glaciation in several central Asian mountain ranges (Himalaya, Karakorum, Pamir and Tien Shan) provides several suitable sites from which ice cores can be recovered and used to investigate critical aspects of the Asian climate system (e.g. Reference Mamane, Dzubay and WardMayewski and others, 1984; Reference ThompsonThompson and others, 1995, Reference Thompson1997).
The Tien Shan, along the northern periphery of the Tibetan Plateau (Fig. 1), contain the largest subcontinental glacier system (Pobeda–Khan Tengri massif; 1200 glaciers with a total area of ∼4320 km2) in the region (Reference Aizen, Aizen, Dozier, Melack, Sexton and NesterovAizen and others, 1997a). Meteorological conditions in the central Tien Shan, responsible for the modern glacier regime, are dominated by the interaction between the Siberian anticyclone and western cyclones (Reference Aizen, Aizen, Melack and MartmaAizen and others, 1996). In summer (June–August), the subtropical and northern jet streams merge and advect moisture to the Tien Shan (Reference Aizen, Aizen, Nesterov and SextonAizen and others, 1993). As a result, the majority of precipitation and hence mass accumulation on glaciers in the Tien Shan occurs during the boreal summer. In addition, the Tien Shan provide a unique setting for studying regional aridity and dust transport, as several deserts (Fig. 1) surround the mountain range.

Fig. 1. Regional map of central Asia. The star symbol represents the location of the Inilchek glacier firn-core site.
Previous glaciochemical studies in the Tien Shan have demonstrated the strong influence of dust derived from surrounding arid regions (Reference Wake, Mayewski and SpencerWake and others, 1992; Reference WarneckWilliams and others, 1992; Reference JohnsenKattelmann and others, 1995). More recently, a simultaneous study of aerosol and snow chemistry in the eastern Tien Shan (Reference JunyingSun and others, 1998) demonstrated good agreement between the chemical composition of the two, and created additional confidence for reconstructing past atmospheric composition based on snow- and ice-core records. In addition, studies of the δ 18O and δD composition of precipitation in the Tien Shan demonstrate the usefulness of isotope measurements for reconstructing site temperatures and identifying moisture sources (Reference Aizen, Aizen, Melack and MartmaAizen and others, 1996; Reference Tandong, Masson, Jouzel, Stievenard, Sun and JiaoYao and others, 1999). Despite the encouraging results from these studies, and the importance of the central Tien Shan in regional and larger-scale atmospheric and climatic processes, a detailed, multivariate glaciochemical record has not yet been developed from the area.
2. Methodology
To further study glaciochemical characteristics in the region, the relationship between preserved glaciochemistry and climatic processes, and the potential for recovering a long-time-series ice core from the central Tien Shan region, we visited South Inilchek glacier, Kyrgyzstan (42.16° N, 80.25° E), during July–August 1998 (Fig. 1). Fresh snow samples, snow-pit samples and a shallow firn core were recovered from the accumulation zone at 5100 m a.s.l. to avoid potential complications from seasonal melting of the snow-pack. At the drill site, a 2 m snow pit was sampled at 5 cm intervals for chemical measurements by workers wearing non-particulating suits, masks and plastic gloves. Snow samples were placed into pre-cleaned low-density polyethylene (LDPE) containers that had been washed in a sequence of soaking and rinsing with Milli-Q18.2 MΩ water. Density measurements in the snow pit (using a stainless-steel 100 cm3 box sampler) were made every 3 cm in a continuous profile. From the bottom of the 2 m pit, a 12.36 m firn core (7.62 cm diameter) was drilled with a Polar Ice Coring Office (PICO) fiberglass auger (10 m temperature = −12°C). The diameter, length and weight of each core section recovered were measured for density calculation. Snow-pit samples and core sections were packed into insulated shipping containers and transported frozen to the freezers at the University of New Hampshire (UNH).
Gore processing at UNH was done in a dedicated cold room (temperature <−12°C) using established techniques for ultra-clean sample preparation. Samples for oxygen isotope and major-ion analyses were cut every 7.5 cm. Frozen 18.2 MΩ water blanks were sent through the entire system and analyzed often to assure that there was no contamination. Samples were melted immediately prior to ion chromatographic analysis at UNH for water-soluble inorganic ion composition. Anion (Cl−, NO3 − and SO4 2−) and cation (Na+, Ca2+, K+, Mg2+ and NH4 +) analyses were performed via suppressed ion chromatography (Dionex 4000 series instruments). Cations were analyzed with a CS12 column, 125 μL loop and 20 mM methanesulfonic acid (MSA) eluent. Anions were analyzed with an AS11 column, 75 μL loop, and 6 mM NaOH. Upon melting, an aliquot (10 mL) of sample was removed, refrozen and shipped frozen to the University of Maine for oxygen isotope (δ 18O) analysis. A VG-Fisons Sira Series II mass spectrometer fitted with dual inlets, triple collectors and mated to an automated CO2 equilibration device was used for analysis (precision ±0.05‰). Sample ratios are reported in delta (δ) notation relative to Vienna standard mean ocean water (V-SMOW) according to the formula (Reference CraigCraig, 1961):
Density measurements in the sampled portion of Inilchek glacier are shown in Figure 2. A single ice layer (ρ > 0.9 g cm−3) was noted at 1.1 m depth (0.4 m w.e. depth) in the snow pit. Below this depth, density values display a characteristic (Reference Mayewski, Lyons, Ahmad, Smith and PourchetPaterson, 1981) exponential increase, and do not reach the firn/ice transition at the base of the core. The core is therefore within the firn zone of Inilchek glacier. A density model was fit to the data (Fig. 2):
where ρ (i) = 0.89 g cm−3 (Reference Mayewski, Lyons, Ahmad, Smith and PourchetPaterson, 1981), ρ (s) = 0.33 g cm−3 (based on the average density of the upper 30 cm of surface snow) and z is depth. Depth values for isotopic and chemical measurements in the snow pit and firn core were corrected using the above model, and are expressed in terms of water-equivalent depth (WED).
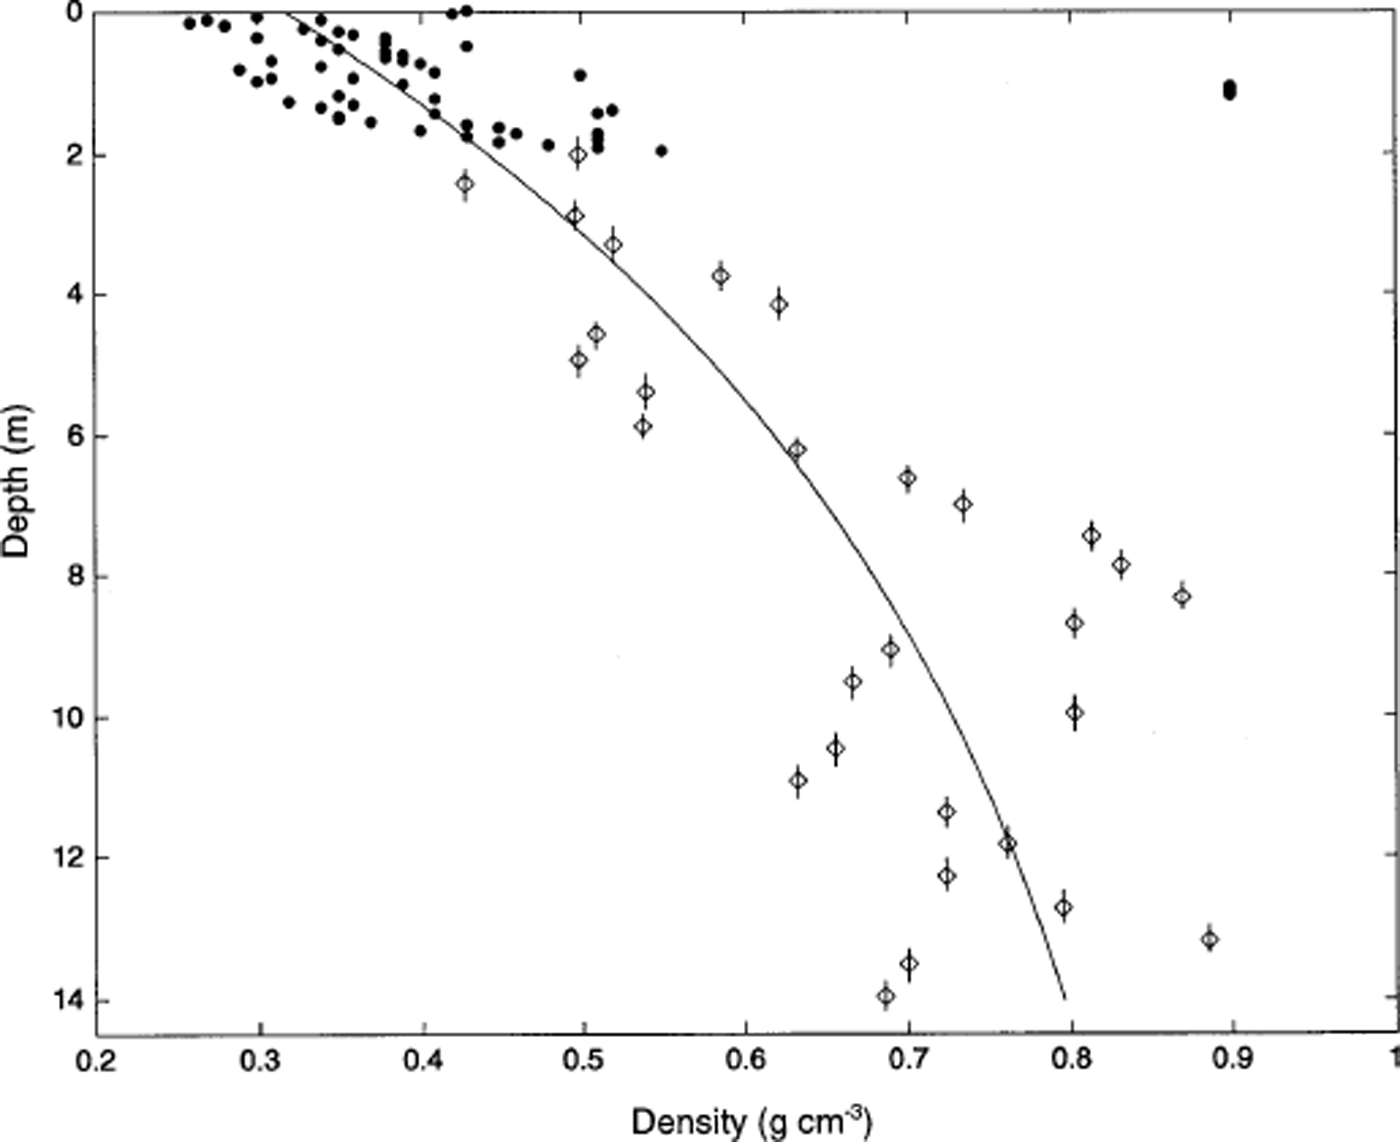
Fig. 2. Density measurements in the upper 14.3 m of Inilchek glacier. Filled circles represent density measurements made in a 2 m snow pit; sampling interval is 3 cm. Diamonds represent density measurements made on firn-core sections; sample lengths are represented by vertical bars and range from 34 to 50 cm. The solid line represents the density model described in the text.
3. Results and Discussion
3.1. Oxygen isotopes
To produce a continuous oxygen-isotope (δ 18O) record from the glacier surface, data have been combined from the 2 m snow pit and the 12.36 m firn core (Fig. 3). Significant variability is apparent in the δ 18O data with increasing depth, with large-amplitude (range = 29.6‰) δ 18O fluctuations present throughout the core. No significant post-depositional effects are apparent in the 1998 firn-core δ 18O record, as the signal amplitude near the bottom of the core (6–9 m WED) is similar to that observed near the surface. Some attenuation of the sub-seasonal δ 18O signal, perhaps due to vapor diffusion (Johnsen, 1977), is noted when comparing bottom and top portions of the record. However, part of the discrepancy may be due to different sample intervals in the snow-pit (5 cm) and firn-core (7.5 cm) sections of the profile, so the record is too short to adequately assess any diffusion mechanisms. Similar δ 18O signals have been noted in snow pits from other locations on Inilchek glacier (Reference Aizen, Aizen, Melack and MartmaAizen and others, 1996), and in a 20 m core from the Gregoriev ice cap (4660 m a.s.l.), Tien Shan (Reference JunyingThompson and others, 1993; Table 1). We therefore interpret the observed δ 18O variability as reflecting annual cycles in precipitation δ 18O at the site (Reference DansgaardDansgaard, 1964). Based on this assumption, accumulation years have been defined on the δ 18O curve (Fig. 3), with δ 18O maxima corresponding to summer layers. This interpretation (δ 18O maximum during summer) is consistent with observed δ 18O values in surface snow-pit samples and fresh-snow samples collected during the 1998 field expedition (Fig. 3). Mass-balance (precipitation−(evaporation + sublimation)) estimates indicate a mean accumulation rate of 146 g cm−2 a−1 for the period 1993–97 (the snow-pit and firn-core record does not include the full accumulation season for 1992 and 1998, so available data from these years are not included in the mean accumulation estimate). The observed accumulation rate is higher than modeled precipitation estimates (∼80 g cm−2 a−1) for this altitude in the Inilchek basin (Reference Aizen, Aizen, Dozier, Melack, Sexton and NesterovAizen and others, 1997a), which may be due to basin morphology (i.e. preferential trapping of snow in a sheltered basin; Reference Wagenbach, Oeschger and LangwayWake, 1989).
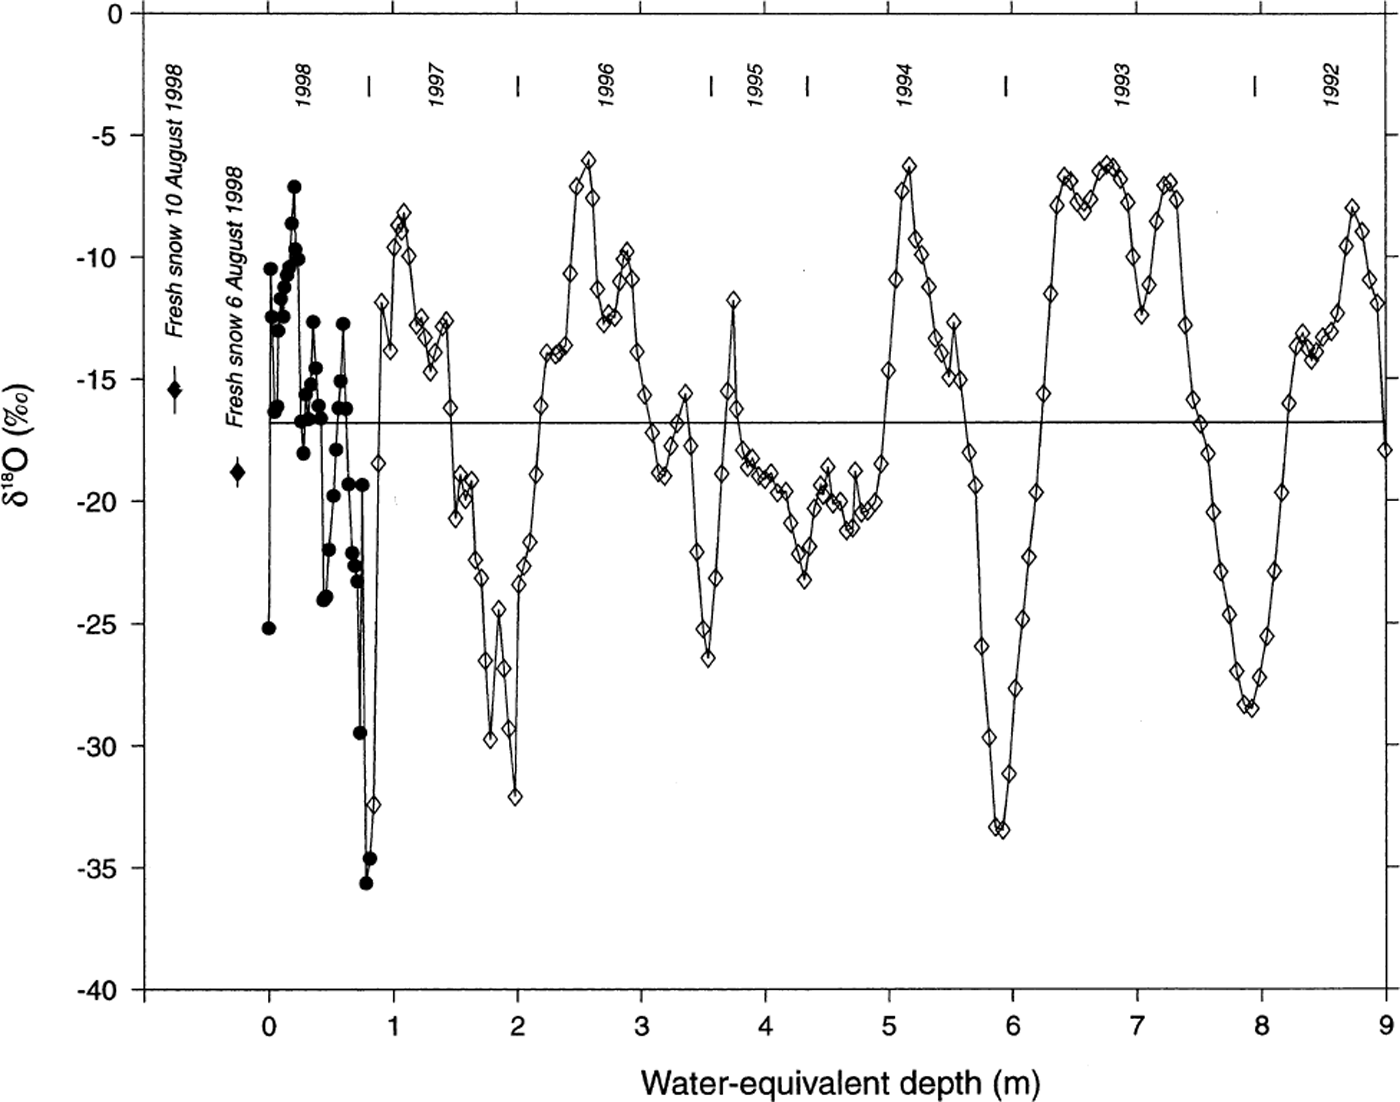
Fig. 3. Oxygen isotopic (δ18O) measurements on the Inilchek glacier firn core. Data from the upper 2 m (1 m w.e.) are from a snow pit sampled at 5 cm intervals at the drill site; remaining data from the firn core are in 7.5 cm intervals. Depths in both the snow pit and core have been corrected based on density measurements. years (1992–97) represent summer intervals, and have been chosen based on δ18O maxima and the 1998 sampling period. Fresh-snow data are from two events which occurred during the expedition (error bars represent ±1 std dev. of five replicate samples).
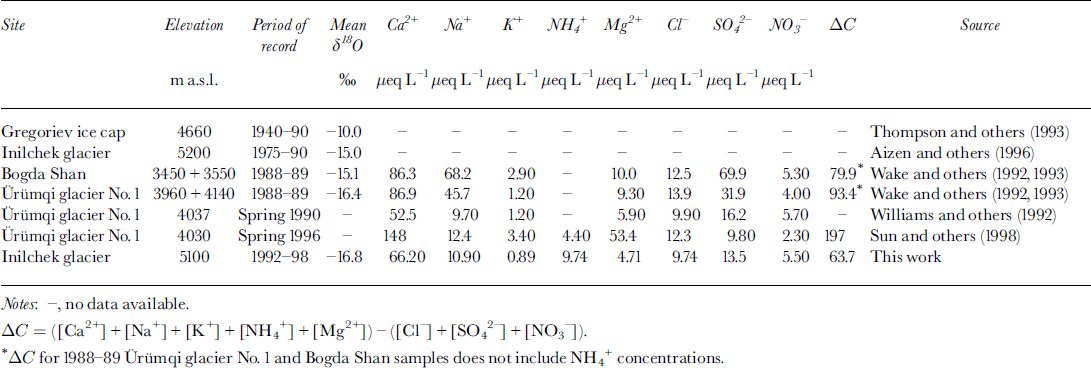
Table 1. Summary of oxygen isotope ratios and major-ion concentrations in Tien Shan snow, firn and ice core
In central Asia, empirical δ/T s studies have been performed at several sites using meteorological-station and field temperature data, and the δ 18O composition of precipitation and preserved snow (Reference Tandong and ThompsonYao and Thompson, 1992; Reference Legrand, de Angelis, Staffelbach, Neftel and StaufferLin and others, 1995; Reference Tandong, Thompson, Keqin, Mosley-Thompson and ZhihongYao and others, 1995, Reference Tandong, Masson, Jouzel, Stievenard, Sun and Jiao1999; Reference Aizen, Aizen, Melack and MartmaAizen and others, 1996). Based on these results, several Asian ice-core δ 18O records have been used to reconstruct past atmospheric temperature changes on 102–104 year time-scales (Reference JunyingThompson and others, 1993, Reference Thompson1995, Reference Thompson1997). Using a limited set of precipitation δ 18O measurements in the Tien Shan, Reference Aizen, Aizen, Melack and MartmaAizen and others (1996) concluded that there was likely a single summer moisture source, and derived the following relationship:
Because this equation represents the only empirical relationship yet derived from the central Tien Shan, we use it as a basis for interpreting the 1998 Inilchek firn-core δ 18O record. Using Equation (1), the average yearly δ 18O maxima (−7.46‰) and minima (−29.85‰) present in the Inilchek core record underestimate the mean annual temperature cycle recorded at Tien Shan station (3614 m). Calculated vs observed temperatures are −3.1° and 3.4°C for summer (June–August), and −40.4° and −20.2°C for winter (December–February), respectively. Given that Tien Shan station lies at a lower altitude, the absolute seasonal temperature cycle at the Inilchek core site is likely colder. Calculated winter values for the Inilchek site, however, appear to be much lower than can be accounted for by standard adiabatic lapse rates. Seasonal differences over the 1500 m elevation range, including temperature-dependent lapse rates and/or valley effects, may play a role in the winter discrepancy (Reference Grootes, Stuiver, Thompson and Mosley-ThompsonGrootes and others, 1989). It is therefore likely that the δ 18O/T s relationship derived by Reference Aizen, Aizen, Melack and MartmaAizen and others (1996), based only on coeval summer precipitation sampling and temperature observations, does not correctly approximate δ/T s during other seasons. Assuming that δ 18O maxima mainly represent summer precipitation, and that δ 18O values during summer are primarily related to T s, there is no apparent trend in summer temperatures at the site during the 1992–98 period. In fact, mean summer δ 18O values are consistent except for 1995, a year with only one-third the long-term mean precipitation amount at Tien Shan station. Mean summer (June–September) temperatures measured at Tien Shan station (3614 m a.s.l.) also lack any significant trend during 1992–97 (V. Aizen, unpublished data), lending qualitative support to the interpretation of the Inilchek firn-core δ 18O record.
3.2. Soluble ions
Mean ion concentrations in the 1998 Inilchek glacier firn core are given in Table 1. Within the Tien Shan range, snow and firn soluble-ion data are generally in good agreement despite different time periods sampled. To compare the relative contribution of each species to the overall chemical loading, the percentage of total ionic charge was calculated on a sample-by-sample basis and then averaged for the entire core. The cation excess is represented by ΔC, and is calculated by subtracting the anion sum (Σ−) from the cation sum (Σ+). The dominant cations are Ca2+, NH4 + and Na+, while Cl− and SO4 2− are the dominant anions. Although not measured, Ca2+ is likely carbonate/bicarbonate, based on estimates of evaporite deposits in the region and glaciochemical measurements made at other Tien Shan sites (Reference WarneckWilliams and others, 1992). Therefore, soluble aerosol deposition at the site during the time period covered by this core was dominated by Ca2+ and HCO3/CO3 2−, suggesting that regional sources of soluble calcite have a strong impact on the precipitation chemistry at this site.
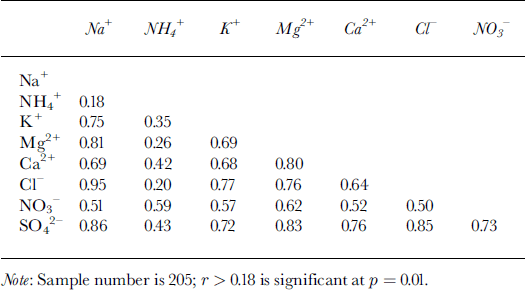
Chemical-species time series from the 1998 Inilchek samples are presented in Figure 4. Episodic dust input is likely the cause of the strong temporal variability in the record, and strong covariance is visually evident in several (Na+, Cl−, Mg2+, K+, Ca2+ and SO4 2−) species. Linear regression between water-soluble species indicates a significant (95% confidence level) correlation between most ions, particularly Na+ and Cl− (Table 2). These species are generally assumed to have a marine origin, even at some high-elevation sites (Reference PatersonShrestha and others, 1997), but scatter-plot estimates reveal a departure from sea-water Na+/Cl− ratio (0.83; Reference DreverDrever, 1988; Fig. 5). In addition, comparison of Na+ concentrations with other potential marine species (Fig. 5) suggests that sea-water ratios are almost always exceeded, particularly for Ca2+. The regional setting of the site (at least 2400 km from ocean sources) likely precludes any long-range transport of coarse-mode, primary sea-salt aerosol. Rather, the mean Na+/Cl− equivalence ratio is 1.24, suggesting various evaporite (e.g. halite) sources. Terrestrial dusts have also been postulated as the main source of SO4 2− and NO3 − in Tien Shan snow (Reference WakeWake and others, 1990; Reference WarneckWilliams and others, 1992; Reference JunyingSun and others, 1998). Under alkaline atmospheric conditions, H2SO4 and HNO3 can be absorbed on the surface of mineral particles and react to form salts (Reference Lin, Thompson, Davis and Mosley-ThompsonMamane and Gottlieb, 1992; Reference Mamane and GottliebMamane and others, 1992). The significant correlation observed between SO4 2− and NO3 − (Table 2) suggests that this may be the case in the Inilchek region as well.

Fig. 4. Soluble-ion measurements made on Inilchek glacier firncore samples. Sampling intervals are the same as those described in Figure 3.

Fig. 5. Na+ concentrations in Inilchek glacier firn core vs other species (Cl−, Mg2+, K+ and Ca2+) with possible marine sources. Conservative sea-water concentration lines are based on data from Reference DreverDrever (1988).
Table 2. Correlation coefficients between soluble-ion species in the Inilchek firn core
Equivalence ratios can provide information for evaluating compounds responsible for soluble-species deposition, so they are useful for estimating chemical sources. For example, Ca2+ may be associated with SO4 2− (gypsum and/or anhydrite) or with CO3 2− (calcite), both originating from evaporite deposits. If gypsum were the primary soluble compound delivering Ca2+ to the site, a mean Ca2+/SO4 2− equivalence ratio close to 1 would be expected (Fig. 6). This is clearly not the case in the Inilchek glacier core, as the mean Ca2+/SO4 2− ratio is much higher (6.90), suggesting that Ca2+ is primarily arriving at the site as calcite. There is no apparent seasonal variation in the Ca2+/SO4 2− ratio. Reference Aizen, Aizen, Dozier, Melack, Sexton and NesterovAizen and others (1997a) noted that synoptic processes favorable for precipitation in the Tien Shan occur from the west, suggesting that aerosol from western Kyrgyzstan, Kazakhstan, Uzbekistan and Turkmenistan may be transported to the site. An intensive aerosol study in Tajikistan during 1989 also noted that meteorological conditions responsible for enhanced atmospheric-dust concentrations involved long-range transport of aerosol from desert regions to the west.
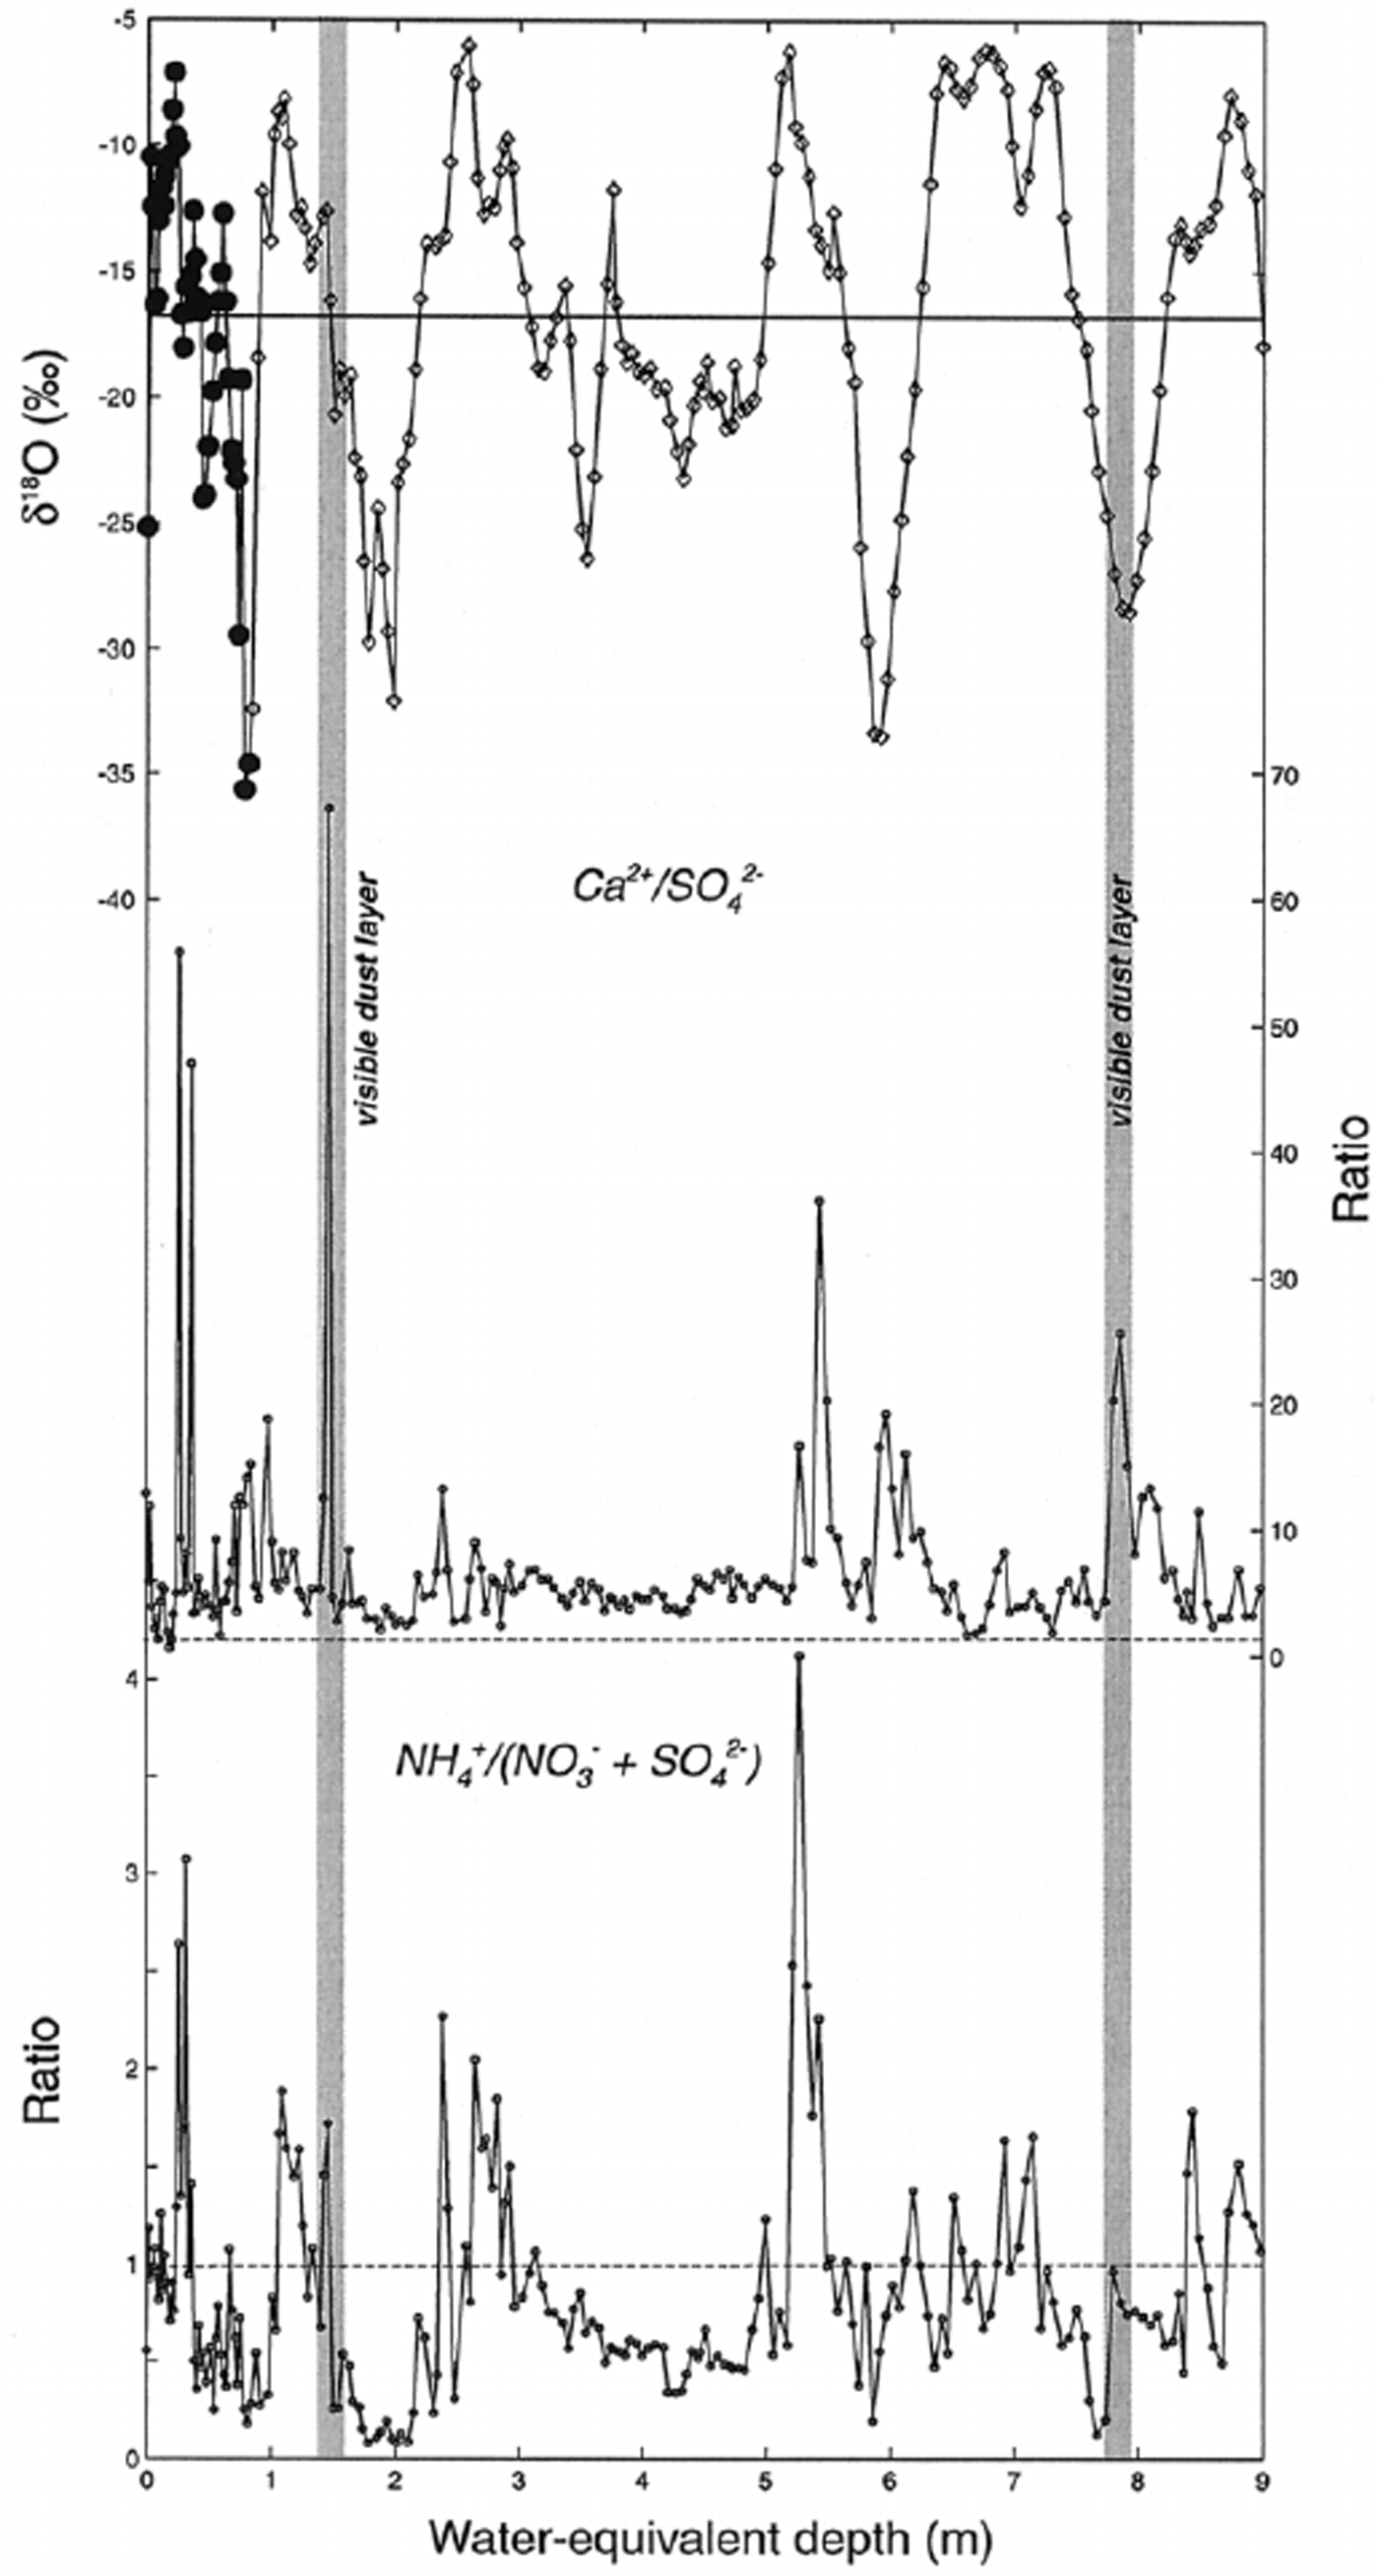
Fig. 6. Equivalence ratios for selected ion species along Inilchek glacier firn core. Also plotted for comparison are the firn-core δ18O data. The horizontal line on the δ18O plot represents the mean value, while the horizontal lines on the ratio plots represent an equivalence ratio of 1.
Significant interannual variability in dust deposition to Inilchek glacier occurred during the period covered by the firn-core record. In particular, the 1996/97 period stands out as having much higher dust input (Fig. 4). Several potential scenarios could be responsible for such an increase in dust flux: (1) increased regional aridity, (2) increased dust-storm frequency and/or transport to the site, or (3) decreased accumulation and enhanced dry deposition. An estimate of accumulation, based on the δ 18O signal, suggests that this period was not one of significantly reduced accumulation. Therefore, an increase in concentration due only to increased dry deposition is unlikely. We suggest that regional aridity conditions and/or transport efficiency were enhanced and are responsible for the observed increase in dust flux.
Ammonium (NH4 +) has the highest correlation with SO4 2− and NO3 − (Table 2), which is consistent with aerosols prevalent in the remote global troposphere (Reference Wake, Mayewski, Zichu, Ping and LiWarneck, 1988). While the mean NH4 +/(NO3 − + SO4 2−) ratio is below 1, peaks greater than 1 occur during summer (δ 18O maxima; Fig. 6). Thus, NH4 + compounds are minor components in the regional troposphere at times of high dust input, but during summer they are much more significant. Potentially significant local NH4+ sources include: (1) biomass burning, (2) livestock, and (3) commercial and natural fertilizers widely used in agricultural activities. Of these sources, NH4 + emissions from fertilized soil are estimated to make the dominant contribution to the troposphere (Reference Shrestha, Wake and DibbStedman and Shetter, 1983; Reference Wake, Mayewski, Zichu, Ping and LiWarneck, 1988). Gaseous NH3 released from soils undergoes rapid reaction with strong acids (HNO3 and H2SO4), so common NH4 +-bearing compounds are NH4HSO4, (NH4)2SO4 and NH4NO3.
Equivalence ratios in the 1998 Inilchek glacier core suggest that these compounds alone cannot explain observed NH4 + concentrations. In particular, the NH4 +/(SO4 2− + NO3 −) ratio exceeds 1 during summer periods (Fig. 6), and during 1994 reaches a value of 4. The high ratios indicate that there is a vast excess of NH3 emitted to the atmosphere in summer, which reaches the site either in the gas phase or as an NH4 +-bearing compound. Previous glaciochemical work has suggested that biomass burning is responsible for the correlation seen between NH4 + and organic acids (i.e. formate, HCOO−) in snow- and ice-core records (Reference Kattelmann, Elder, Melack, Aizen and AizenLegrand and others, 1992; Reference Wake, Mayewski and SpencerWake and others, 1992). Because we have not measured organic acids in the Inilchek glacier samples, we cannot rule out biomass-burning products as a source of the excess NH4 +. It is not clear, however, that such a biomass-burning source would be dominant in summer, as observed in the core record. Rather, we favor a compound that is linked to agricultural activity in the region, and specifically to the use of nitrogen-rich fertilizers that increases in summer. A summer peak in NH4 + concentrations has been noted at Colle Gnifetti, Switzerland (4450 m a.s.l.), and was explained by a superposition of atmospheric transport (summer instability and enhanced vertical transport) and European agricultural NH3 emissions (Reference Döscher, Gäggeler, Schotterer and SchwikowskiDöscher and others, 1996). We suggest that a similar mechanism is responsible for the observed NH4 + concentrations in the Inilchek firn core, related to summer agricultural activity in the region.
5. Conclusions
The isotopic and soluble-ionic records presented here from a shallow firn core indicate that Inilchek glacier provides a sensitive archive of central Asian atmospheric, climatic and environmental conditions. Although a single melt feature was observed in the 14.4 m profile, it appears possible to reconstruct climate variability without any significant ambiguity introduced by seasonal melting. The preserved annual δ 18O cycles in the snow and firn sections of the glacier are a means of identifying annual layering, but more accurate depth/age scale construction will require independent verification of δ 18O-based dating (i.e. with radionuclide data). The Inilchek δ 18O record contains no obvious trend in summer δ 18O values during the 1992–98 period, which is consistent with mean summer air temperatures recorded in regional instrumental data. Major-ion data demonstrate the dominance of dust (particularly CaCO3) deposition on the water-soluble chemistry of the site, as well as significant interannual variability in dust transport. In addition, given the timing and magnitude of summer NH4 + concentrations, we speculate that regional agricultural activity and the use of nitrogen-rich fertilizers have an impact at the Inilchek site. Based on results presented here, a long multivariate ice-core record recovered from Inilchek glacier will provide a means to investigate climatic and environmental conditions in central Asia and extend reconstructions prior to the instrumental period. Several trends observed in central Asia over the past half-century, namely, increasing temperatures, decreasing precipitation (Reference Aizen, Aizen, Melack and DozierAizen and others, 1997b), and aridity (Reference Tandong, Masson, Jouzel, Stievenard, Sun and JiaoZhang and Crowley, 1989), can thus be established within a longer climatic context.
Acknowledgements
We thank D. Introne (University of Maine Stable Isotope Laboratory) for oxygen isotope analyses, S. Whitlow (UNH Climate Change Research Center) for major-ion measurements, and the staff and guides of the Tien Shan International Mountaineering Center for assistance in the field. The manuscript was improved by comments from E. Sholkovitz. This work was supported by the U.S. Department of Energy, U.S. Geological Survey, Associated Western Universities, the Postdoctoral Scholar Program at the Woods Hole Oceanographic Institution (funding provided by the Devonshire Foundation) and the U.S. National Science Foundation (ATM-0000560).


