Introduction
Salmonella infections are a leading cause of hospitalisation and death from gastroenteritis in Australia [Reference Kirk1, Reference Ford2]. Mandatory reporting of salmonellosis allows monitoring of disease trends and identification of outbreak sources [Reference Ford3, Reference Moffatt4], yet despite the high burden of disease, sources of Salmonella infection in individuals are rarely identified. Public health investigations are generally limited to point source outbreaks, commonly traced to foods of animal origin, particularly chicken and eggs [Reference Moffatt4, Reference Fearnley5]. However, infection sources also include broader animal groups of birds, swine, cattle, reptiles, cats and dogs, and environmental transmission via contaminated recreational or drinking water [Reference Hale6–Reference Aiken, Lane and Adak9].
The northern states of Australia consistently report higher rates of salmonellosis than the national average [Reference Ford3]. A case–control study of young children in tropical Australia found widespread Salmonella contamination in households, with environmental transmission identified as the most likely cause of illness [Reference Williams10]. Queensland spans tropical and subtropical climates and reports high rates of salmonellosis in children under 1 year old. Unlike temperate states of Australia, where over half of notified cases are due to Salmonella Typhimurium, S. Typhimurium was responsible for only 27% of cases in Queensland over 2000–2013 [Reference Ford3].
Bayesian source attribution models have emerged as a valuable tool for estimating the proportion of salmonellosis due to reservoir sources [Reference Hald11–Reference Pires15]. Salmonella source attribution models in New Zealand, Europe and the USA have highlighted poultry, eggs, pork and beef as key sources [Reference Hald11, Reference Mullner12, Reference Pires15–Reference Guo17]. In Australia, attribution modelling in the temperate region of South Australia identified chicken and eggs as the predominant sources of human illness generally, with an even higher association with S. Typhimurium [Reference Glass18], but it is unclear whether other reservoirs play a larger role in tropical and subtropical climates.
With the rise in culture-independent diagnostic testing and use of new typing methods, including whole-genome sequencing, data for source attribution have become fragmented. To ensure results are not biased by these changes, and to enable comparability with earlier work in South Australia, we conducted source attribution of salmonellosis in Queensland using serotype- and phage-type data collected from 2000 to 2011.
Methods
Data
Laboratory-confirmed Salmonella infections in humans from 2000 to 2011 were obtained from the communicable disease surveillance system provided by the Queensland Department of Health. The selected period was chosen based on high proportions of isolates serotyped from 2000 onwards, and a change in diagnostic processes from Typhimurium phage typing to molecular discrimination via multi-locus variable number tandem repeat analysis in 2012. Data included age, gender and notification date of the case, and typing information (serotype and phage type) for the Salmonella isolated. We did not have information on potential international travel in the incubation period before infection, or on the association of a case with a known outbreak. The research was approved by the Australian National University Ethics (Application 2012/412).
Isolations of Salmonella from non-human sources were obtained from the public health microbiology laboratory, Queensland Department of Health, for 2000–2011. The non-human data were not collected under a systematic surveillance programme of foods and animal sources, but contain data collected from short-term monitoring projects, outbreak investigation sampling, veterinary diagnostic pathology laboratories and industrial compliance testing. Non-human data obtained included a description of the sample, date of isolation, location of sample collection at the postcode level and type (serotype and phage type) of Salmonella isolated. The description of the sample was used to categorise the samples into food and animal group sources. Descriptions of samples included in each of the six source categories are provided in Table S1. Samples taken from locations outside Queensland were excluded, except for several postcodes near the border of Queensland and New South Wales for which there were consistently high numbers of samples across the study period (see Supplementary Material).
Analysis
Rates of reported disease by year were calculated using estimated residential populations from the Australian Bureau of Statistics [19]. Age-specific rates were calculated for S. Typhimurium, non-Typhimurium subtypes combined and for high-incidence non-Typhimurium subtypes. Yearly rates of incidence for Queensland were compared with Australian rates over time. Seasonality of Typhimurium and non-Typhimurium subtypes was captured by calculating total notifications by week of year across 2000–2011.
A source attribution model was developed in line with earlier work in South Australia [Reference Glass18]. As before, we constructed the model in two steps (as in [Reference Mullner12]). In the first step, we estimated the prevalence (p ij) of each subtype i in each source, j, based on the estimates of the prevalence of Salmonella in each source, and the relative occurrence of each type in each source. In the second step, we estimated the number of human cases of subtype i arising from source j as:
where M j is the consumption weight for source j, and q i and a j are type- and source-dependent parameters, respectively. We ran the model using the Bayesian software WinBUGS14 for 400 000 iterations to burn-in and then sampled from the following 100 000 iterations from a single chain, assessing convergence from trace plots. Results of all models were presented as median values and 95% credible intervals (95% CrI).
Salmonella subtypes included in the modelling were chosen based on the requirement of at least 20 human cases and at least 10 non-human isolates across all included sources, as the original South Australian model failed to converge if rare subtypes were included [Reference Glass18]. Consumption weights were based on mean daily food intake from the Australian Health Survey 2011–2012 [20] as: bovine 18.7 g/day, chicken 24.3 g/day, egg 7.7 g/day, nuts 5.2 g/day, ovine 7.2 g/day and porcine 6 g/day. Prevalence estimates were from published Queensland or Australian data [Reference Jordan and Morris21–24] as: bovine 0.44%, chicken 44%, eggs 1%, nuts 0.1%, ovine 0.7% and porcine 1.9% (see Supplementary Material for further details).
Initially, we ran a model with nine food and animal sources, with these sources selected based on sufficient numbers of samples per source (>70) and the potential to contribute to human disease. These nine sources were: bovine, chicken, companion animals (namely cats and dogs), egg, goat, kangaroo, nuts, ovine and porcine. Samples from nuts were largely from macadamia nuts, which are native to Australia and commonly grown in Queensland. Our model with nine sources was unstable, showed poor convergence (assessed through trace plots) and identified extremely low attribution proportions to the three sources of companion animals, goat and kangaroo. Given these findings and the difficulty interpreting attribution for companion animals due to the potential multi-directional transmission of disease from human to animal and vice versa, these three sources were removed from the model. The six-source model of: bovine, chicken, egg, nuts, ovine and porcine showed increased stability and convergence, while retaining all sources used in the analysis for South Australia, with the addition of nuts in the Queensland model.
As our attribution is at the reservoir level, we tested sensitivity of the model to consumption weights by removing the consumption term (M j) from the model. We also identified some convergence difficulties for the model with chicken and eggs included separately and tested a five-source model with a combined chicken and egg source.
Results
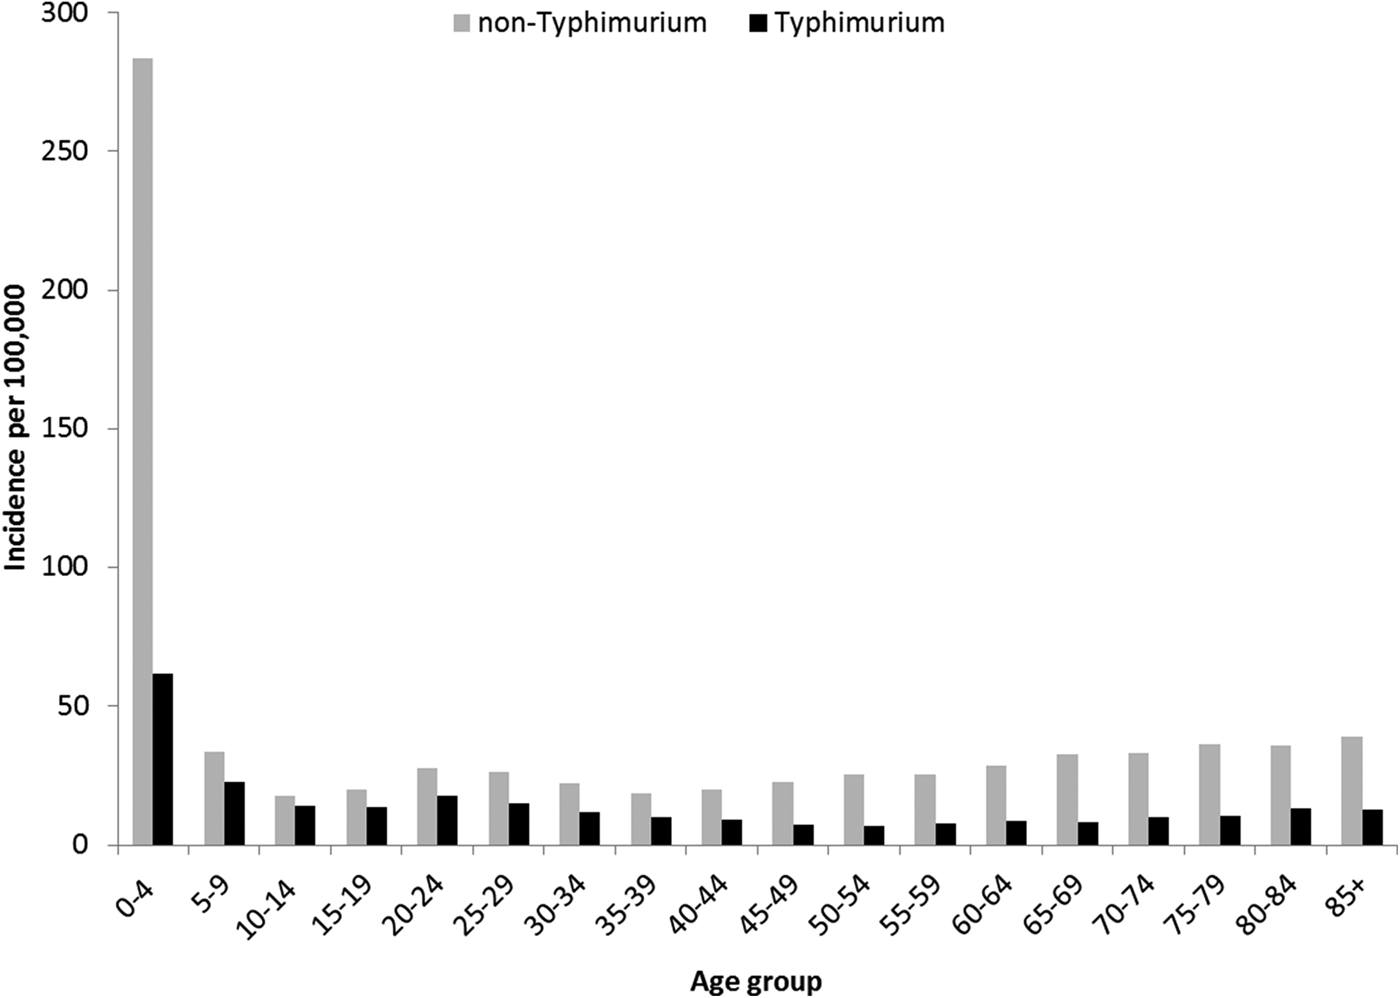
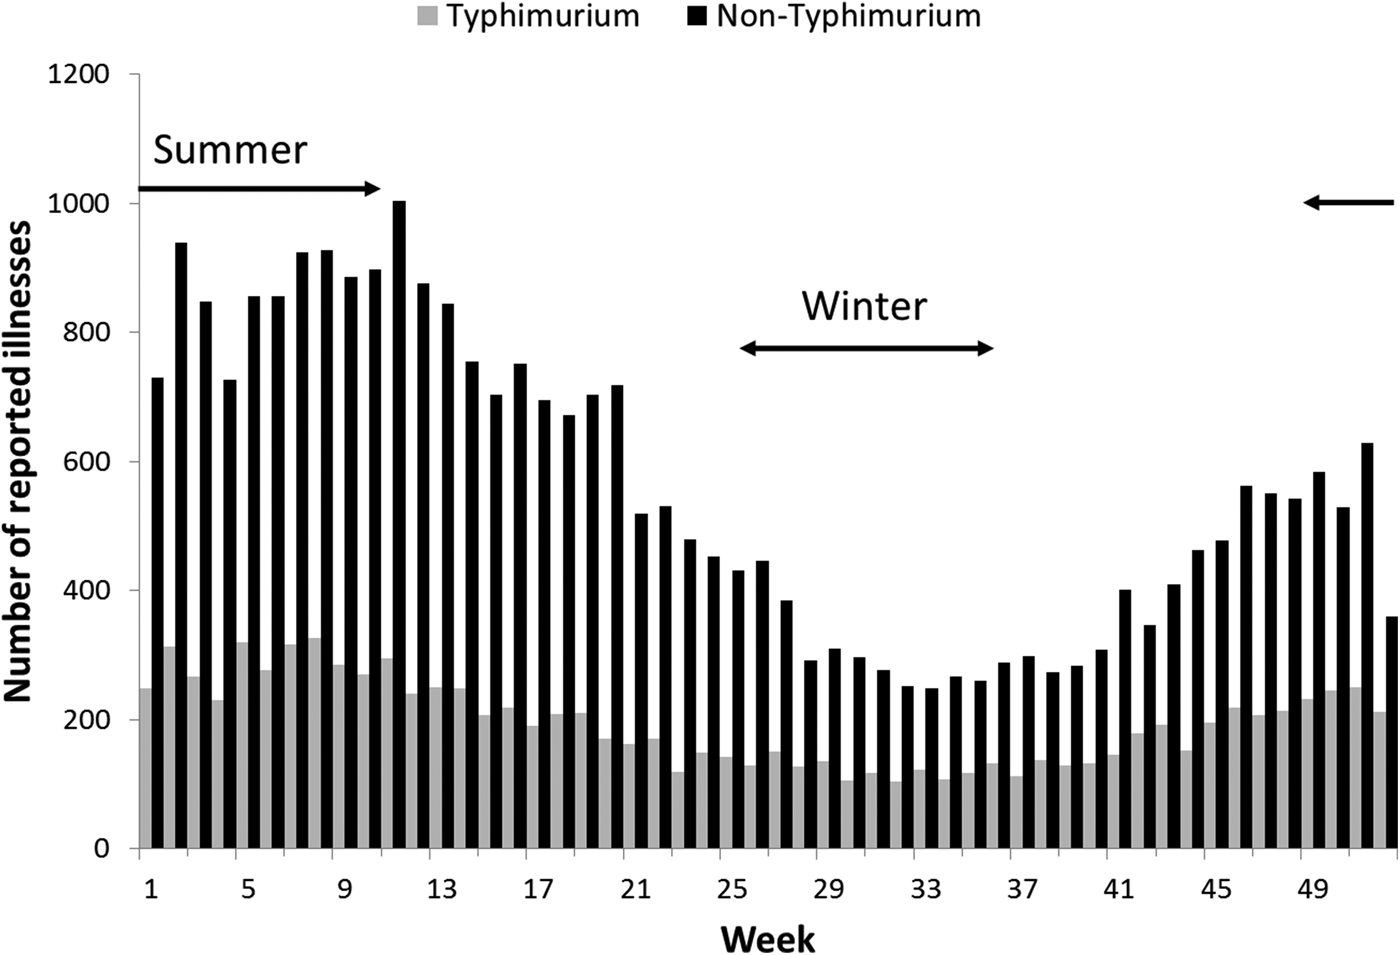
Rates of Salmonella infection reported in Queensland remained consistently above the national average from 2000 to 2011, with higher rates of non-Typhimurium Salmonella infection than of S. Typhimurium across all the years (Fig. S1). Both non-Typhimurium Salmonella and S. Typhimurium incidence rates peaked in the 0–4-year-old age groups (Fig. 1), with non-Typhimurium rates higher than those of S. Typhimurium across all age groups. Infection with S. Typhimurium was consistently reported across the year with a small decrease in the winter months. Conversely, reported non-Typhimurium serotypes showed a more varied seasonal pattern with higher incidence in the warmer wetter periods of late spring and summer (Fig. 2).

Fig. 1. Age group-specific incidence rates of notified Typhimurium vs. non-Typhimurium salmonellosis in Queensland, 2000–2011.

Fig. 2. Weekly number of reported S. Typhimurium and non-Typhimurium infections in Queensland, 2000–2011. Australian summer covers weeks 49–52 and 1–12, while winter is weeks 26–37.
Of the 29 546 notified human cases, 29 044 were included in the source attribution model (84%). Cases were excluded if subtyping data were not available (502 cases, 1.7%) or if they were of a serotype with fewer than 20 human notifications or fewer than 10 non-human isolates across all six included sources (4575 cases, 15.8%). Several non-Typhimurium isolates were amongst the top 20 most common serotypes isolated from humans over 2000–2011 (Table S2).
Under our standard model, most cases were attributed to chicken (43.7%, 95% CrI 27–59.5), nuts (17.5%, 95% CrI 12.6–22.2) or eggs (17%, 95% CrI 1.3–33.6). When consumption weights were removed from the model, the proportion of cases attributed to eggs increased from 17% to 32.9% (95% CrI 13.1–46.2), bovine sources reduced from 2.4% to 0.4% (95% CrI 0.02–2) and chicken reduced to 33.2% (95% CrI 22–51.6) (Table 1). The wide CrI around the proportion of cases attributed to chicken and eggs indicated difficulty distinguishing between these sources. When the model was run with chicken and eggs combined as a single source, 65.3% of cases were attributed to the combined chicken and egg source with much greater precision (95% CrI 60.6–73.2).
Table 1. Median percentages of salmonellosis cases over 2000–2011 attributed to each source in the standard Queensland source attribution model, and two comparison models: one without consumption weights and one in which chicken and eggs are treated as a combined source (95% credible intervals)

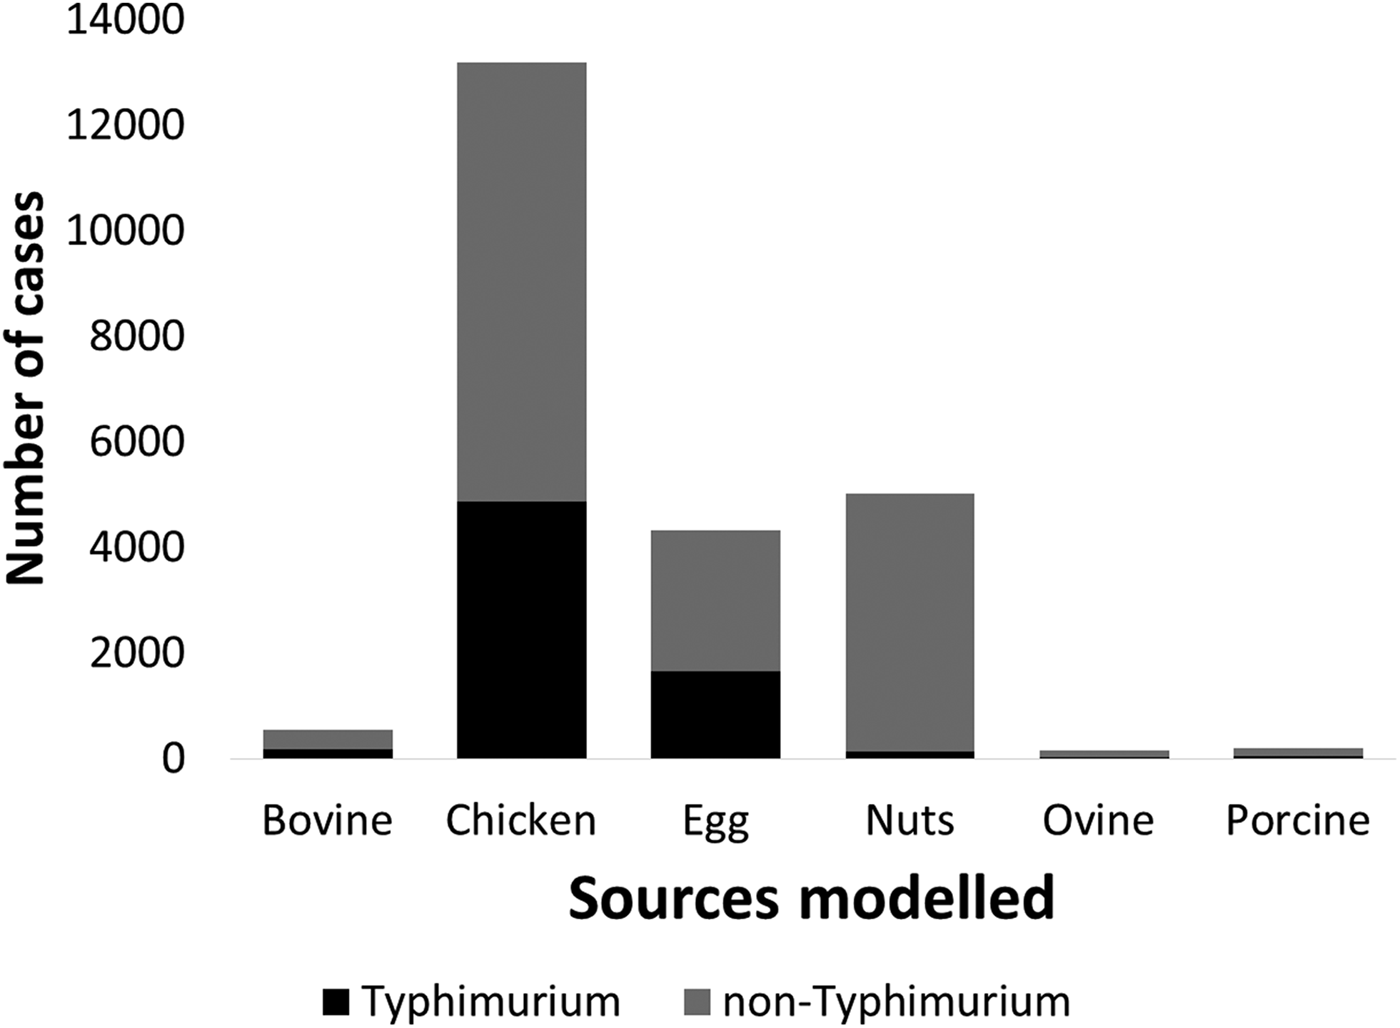
Sources vary by serotype (Fig. 3). Nuts predominate for Salmonella Aberdeen, S. Birkenhead, S. Hvittingfoss and S. Waycross; chicken is the predominant source for Salmonella Chester and S. virchow; while chicken and eggs predominate for Salmonella Anatum, S. Enteritidis, S. Saintpaul and S. Typhimurium. Figure 4 collapses these results into S. Typhimurium and non-Typhimurium subtypes for the sources, highlighting the higher proportion of S. Typhimurium cases attributed to chicken and eggs. For the five subtypes most strongly associated with nuts, rates of reported infection were considerably higher in 0–4-year-old children than any other age group (Fig. S2), ranging from S. Aberdeen with annual rates of 23/100 000 to S. Potsdam with 4/100 000 population.

Fig. 3. Salmonellosis cases by type and source, assigned via source attribution modelling, Queensland 2000–2011.

Fig. 4. Source attribution modelling results combined into Salmonella Typhimurium and non-Typhimurium subtypes, Queensland, 2000–2011.
Discussion
Queensland's reported rates of non-Typhimurium Salmonella subtypes are higher than those in temperate states of Australia. Incidence of non-Typhimurium subtypes is more strongly seasonal, with particularly high rates in young children, suggesting that environmental factors may play a greater role than in transmission of S. Typhimurium. To capture this broader range of potential reservoirs, we included additional sources in our attribution model, and attributed most incident cases to chicken, eggs and nuts.
In a previous source attribution analysis in a temperate state of Australia [Reference Glass18], we attributed higher proportion of cases to eggs (40.1% vs. 17%); however, the total attributed to chicken and eggs combined was similar (62.3% vs. 60.7%). Our Queensland analysis attributed a lower proportion of cases to bovine (2.4% vs. 7.3%), ovine (0.7% vs. 2.7%) and porcine (0.8% vs. 2.6%), although this may be partly explained by the inclusion of nuts in the Queensland model that was not considered for South Australia. In both analyses, most S. Typhimurium was attributed to either chicken meat or eggs.
We attributed 15–17% of human cases of salmonellosis in Queensland to nuts, with strong associations with five serotypes: S. Aberdeen, S. Birkenhead, S. Hvittingfoss, S. Potsdam and S. Waycross. These serotypes have considerably higher incidence in children aged 0–4 years (Fig. S2), suggesting that much of the attribution to nuts may be due to environmental transmission rather than direct consumption. A case–control study of illness due to S. Birkenhead across all age groups failed to identify risk factors [Reference Beard25], while S. Aberdeen has been detected from reptiles [Reference Scheelings, Lightfoot and Holz26] and environmental samples [Reference Munnoch27]. The majority of nut samples in the dataset were macadamia nuts, which are commonly grown in Queensland. Nuts may become contaminated with Salmonella while on the tree or during harvesting where nuts can come into contact with the ground.
Our model produced wide CrI when chicken meat and eggs were included separately, with trace plots indicating difficulty distinguishing between these sources. We also found some differences in the proportion of cases attributed to chicken meat and eggs when consumption weights were removed from the model [Reference Mughini-Gras and van Pelt28]. Unlike source attribution analyses conducted in countries with active sampling of food-producing animals [Reference Hald11], our data were not collected for the purpose of source attribution, and reflect industry, public health and research sampling that may not be representative of the sources. We did not have access to travel data and acknowledge that travel-associated cases will be incorrectly attributed by our study. For most subtypes, travel-associated cases are a small fraction of total notified cases, but 63–64% of cases of S. Enteritidis in 2016 and 2017 were travel-associated, and so we anticipate that only 35–40% of S. Enteritidis cases over 2000–2011 were locally acquired. Attribution for S. Enteritidis is also complicated by low rates of isolation from our sources, resulting in wide CrI for estimates. The date range chosen for this analysis provides consistency in typing methods; however, we recognise that some attribution may not reflect current transmission. In particular, we note that use of vaccines for S. Typhimurium in broilers [Reference Groves29] may have reduced the isolation rate from chicken meat. Finally, we acknowledge that food is transported across state borders in Australia; isolates from food and animal sources within Queensland do not reflect the full range of sources that individuals in the state are exposed to.
Most source attribution analyses from high-income countries have been conducted in temperate regions. Australia's geographic range allows us to compare Salmonella attribution in a tropical and subtropical region to that of a temperate region with similar food consumption patterns. While direct food sources are similar in the two regions, there is evidence for environment-mediated transmission in Queensland. Use of whole-genome sequencing may help strengthen the evidence for this association, and direct interventions.
Supplementary material
The supplementary material for this article can be found at https://doi.org/10.1017/S0950268818002224
Acknowledgements
The authors would like to thank the laboratory providers for the extensive subtyping dataset and Nanna Munck for helpful comments on a draft of this manuscript.
Financial support
This study was funded through an Australian Research Council linkage project (LP110200431). M Kirk is supported by a National Health and Medical Research Council Fellowship (GNT1145997).
Conflict of interest
None.


