Determinants of eating behaviour and dietary intake in children have been extensively researched, with increasing understanding of influences such as the food environment, particularly at home, where children eat most often(Reference Burke, McCarthy and O'Neill1). A wide range of home-related factors such as socio-economic status (SES), affordability, availability at home and accessibility(Reference Ding, Sallis and Norman2–Reference Wyse, Campbell and Nathan5), to parental factors such as parent's education, nutritional knowledge and parental intake(Reference Arcan, Neumark-Sztainer and Hannan3, Reference Wyse, Campbell and Nathan5–Reference Vereecken and Maes9) and individual factors such as food preferences(Reference McGowan, Croker and Wardle7, Reference Johnson, van Jaarsveld and Wardle8), have all been shown to relate to diet quality in children.
The most researched and consistent determinant of diet quality is the household or individual SES, which includes factors such as income, education and occupation(Reference Ryden and Hagfors10–Reference Mullie, Clarys and Hulens12). Those in lower socio-economic groups tend to be less educated with lower nutritional knowledge and reduced affordability of healthier foods(Reference Aggarwal, Monsivais and Cook11, Reference McLeod, Campbell and Hesketh13). The downstream result is poorer food choices and poorer diet quality, often reflected by low fruit and vegetable (FV) consumption(Reference Bihan, Castetbon and Mejean14, Reference Cutler, Flood and Hannan15). Because SES is such a strong determinant of FV consumption and diet quality, it may be possible that the relationships between home-related determinants and FV consumption are confounded or mediated by SES. Furthermore, home-related factors are likely to be correlated with each other(Reference Borodulin, Zimmer and Sippola16). Traditional methods to study these relationships such as multiple regression analyses have led to inconclusive results, and previous studies suggested that holistic approaches to examine combinations of related factors may be more effective in understanding dietary behaviours than individual factors alone(Reference Lv, Liu and Ren17, Reference Poortinga18). This could be due to multicollinearity between variables investigated and over-adjustment of correlated confounding factors in multivariate models, leading to reduced statistical power to detect effects between exposures and diet outcomes. One way to explore the combined effects of factors rather than independent associations is to identify patterns of characteristics using principal component analysis (PCA).
The aim of the present study was to use pattern analysis to investigate associations between combinations of sociodemographic and food practice (SFP) characteristics in relation to FV consumption, in a nationally representative sample of UK children aged 1·5 to 10 years. SFP characteristics of children and their households were collected in the UK National Diet and Nutrition Survey (NDNS) 2008–2010, which included the following: household size, the number of adults and the number of children in the household; demographic characteristics including household SES, ethnicity and region; the age and sex of the main food provider of the participating children; as well as household food practice characteristics, including if organic foods were ever purchased, purchase frequencies of fruit and vegetables, fruit availability at home, eating out and eating takeaway. We hypothesised that the National Statistic Socio-economic Classification 5 (NSSEC5), an indicator of household SES based on the head of household's occupation and used in UK national surveys, was associated with these SFP factors. We also predicted that independent associations between SFP and FV consumption would attenuate when adjusted for NSSEC5 in the models. Finally, we explored empirically derived patterns of SFP using PCA, a data-driven technique to reduce the SFP variables to a smaller number of mutually exclusive patterns. These patterns were then further examined in relation to FV consumption.
Methods
Study sample and design
Data were collected from 642 children aged 1·5 to 10 years in the NDNS Rolling Programme between February 2008 and April 2010 (Years 1 and 2). The aim of NDNS is to assess food consumption, nutrient intakes and nutritional status of individuals aged 1·5+ years across the UK, with a core sample of 1000 people per year (500 adults (≥19 years) and 500 children (1·5 to 18 years)). Detailed descriptions of the sampling procedure and design have been reported(19). Briefly, sampling was based on a random selection of postcode sectors throughout the UK; a number of addresses per sector were invited for participation by interviewers, following an initial information letter. Up to one adult and one child were selected from each participating household and a child ‘boost’ of addresses was included to compensate for households with no children(19). Individual non-response weights were applied to reduce bias from differential response at the household and individual interview, and adjustment made for age, sex and regional profiles of participating individuals(20). NDNS was conducted according to the guidelines laid down in the Declaration of Helsinki and all procedures involving human subjects were approved by the Oxfordshire A Research Ethics Committee. Written informed consent was obtained from parents of the children who participated in the survey(21).
Dietary assessment
Unweighed food diaries were used to record all food and beverages consumed over four consecutive days, with instructions given by trained interviewers at the initial visit. For bought foods such as ready meals and snacks, participants were asked to record brand names to aid identification during the coding process; for homemade dishes, recipes were recorded separately with detailed description of ingredients, quantities and cooking methods. Portion sizes were estimated using household measures and weights from food package labels. Further description and justification of the dietary assessment have been reported elsewhere(21, 22). For this age group, parents and carers filled in the food diaries, with help from other people who had looked after the children(22). The interviewer made a brief visit (either via telephone or in person) during the recording period to check for compliance and answer queries. Upon completion of the diary, the interviewer returned to collect the food diary and checked for any missing information(22). To be considered fully productive, participants had to record their intakes for three days or more. Food diaries were returned to the Medical Research Council – Human Nutrition Research and were coded by trained diet coders using the in-house dietary assessment software, Diet in Nutrients out, with nutrient values provided by the UK NDNS Nutrient Databank.
Disaggregation of fruit and vegetable consumption
Portion sizes of discrete fruit items and discrete vegetable items were determined using the publication Food Portion Sizes (23). To quantify consumption of fruit and vegetables more accurately, disaggregation of mixed dishes was undertaken. The method adopted to disaggregate food codes in NDNS has been described previously(Reference Fitt, Mak and Stephen24). Essentially, proportions of fruit and vegetables in composite dishes were calculated in three main ways: (i) manufactured product information from packaging; (ii) standard recipes from McCance and Widdowson's The Composition of Foods (25); and (iii) homemade recipes from respondents’ food diaries. For products that contain dried fruit and vegetables, such as soup powders, dried FV content was scaled up using the water content of the fresh equivalent. The amounts of disaggregated and discrete fruit and vegetables consumed by each participant per day were summed and the mean intakes of fruit (g/d) and vegetables (g/d) over the recording period were calculated per person.
Computer-assisted personal interview
A computer-assisted personal interview (CAPI) was conducted face-to-face by the interviewer during the initial visit to the participant's home. The CAPI consisted of three main elements: (i) a household structure interview; (ii) a main food provider (MFP) interview; and (iii) an individual interview. Together these gathered information on demographics, household composition, shopping and food preparation practices, cooking skills and facilities at home. Information on employment and income of the household reference person, defined as the person in whose name the property is owned or rented with the highest income, was used to determine the socio-economic classification of the household(21). For this age group, the questions in the CAPI were answered on behalf of the child by the MFP, defined as the person best placed to answer questions about food purchase and preparation for the participant, who was usually the mother of the child. Details of the CAPI and the full questionnaire have been reported(19, 26).
Sociodemographic variables
Variables relating to sociodemographic characteristics and household structure were collected in the first part of the CAPI. NSSEC5 was used as the household SES indicator for the survey(27), which was based on occupation and included five sub-categories: (i) managerial and professional; (ii) intermediates; (iii) small employers and own account workers; (iv) lower supervisory and technical; and (v) routine, manual, never worked, long-term unemployment. Since 2001, NSSEC has been used as the main measure of household SES for all official statistics and surveys in the UK. NSSEC takes into account details of employment status of the household reference person (whether an employer, self-employed or employee; whether a supervisor, manager, etc.), and is seen as superior to other social classification measures as it has been constructed to determine employment relations and conditions of occupation, to show the structure of socio-economic position in modern societies and to explain variations in social behaviour and other social phenomena(Reference Rose, Pevalin and O'Reilly28). Ethnicity was recorded as white or non-white. Six categories were used to describe region: (i) England: North; (ii) England: Central/Midlands; (iii) England: South (including London); (iv) Scotland; (v) Wales; and (vi) Northern Ireland. For household structure, information was collected on: the size of the household (on the scale of 2, 3, 4 and 5+); the number of adults per household (1, 2 and 3+); and the number of children per household (1, 2, 3 and 4+). The level of household income was asked in the questionnaire, but due to a high percentage of non-responses, this variable was not used in the analysis. Information on parent's education level was not collected in NDNS. For adults participating in NDNS, questions related to education were asked but not for children, and therefore this variable could not be used in the current analysis.
Food practice variables
The MFP interview in the CAPI captured a number of variables related to food practices at home. Specific fruit and vegetable indicators were recorded, including frequency of fruit and vegetable purchase (‘<3 times per month’, ‘weekly’, ‘2 or 3 times per week’, ‘daily’) and frequency of fruit availability at home (‘never’, ‘weekly’, ‘most of the time’). Respondents were also asked if they have ever purchased organic foods (yes, no), how frequently they eat out (‘rarely or never’, ‘once or twice per month’, ‘more than once per week’) and the frequency of eating takeaway (‘rarely or never’, ‘once or twice per month’, ‘more than once per week’). Age and sex of the MFP were included in the analyses.
Statistical analysis
All analyses were performed using the Stata statistical software package release 11. Descriptive statistics of continuous variables were expressed as means and standard deviations. Distributions of the categorical variables were described in absolute frequencies and percentages. The χ 2 test was used to test for associations between NSSEC5 and individual SFP variables, except for MFP age, which was a continuous variable; ANOVA was used instead to test for association. Independent associations between the SFP variables and fruit consumption (g/d) and vegetable (g/d) consumption were determined using linear regression analysis, with all models adjusted for age and sex of the child. Patterns of the variables were identified using PCA. PCA is a statistical data-reduction technique that reduces a large number of variables into a smaller number of uncorrelated linear combinations of variables that contain most of the variance of the sample(Reference Vyas and Kumaranayake29). PCA is scale sensitive(Reference Kolenikov and Angeles30) and only variables of continuous, ordinal and binary nature were included in the analysis; hence the variable ‘region’ was removed from analyses. The variable MFP sex was also removed since only 7 % of MFP were male. Eleven variables were therefore entered in the PCA: household size, number of adults per household, number of children per household, NSSEC5, ethnicity, MFP age, frequency of fruit availability, frequency of FV purchase, organic purchase, frequency of eating out and frequency of eating takeaway. Variables with component loadings >±0·3 were considered to be correlated highly with the construction of the pattern. The screeplot was used to decide on the number of patterns to retain for subsequent analyses. Pattern scores were calculated for each participant for each pattern retained and were regressed v. fruit (g/d) and vegetable (g/d) consumption. Age and sex of the child were adjusted in the final models. Survey commands (svy) were used throughout to account for the multistage survey design and non-response weighting was applied in the regression analyses.
Results
Sample characteristics
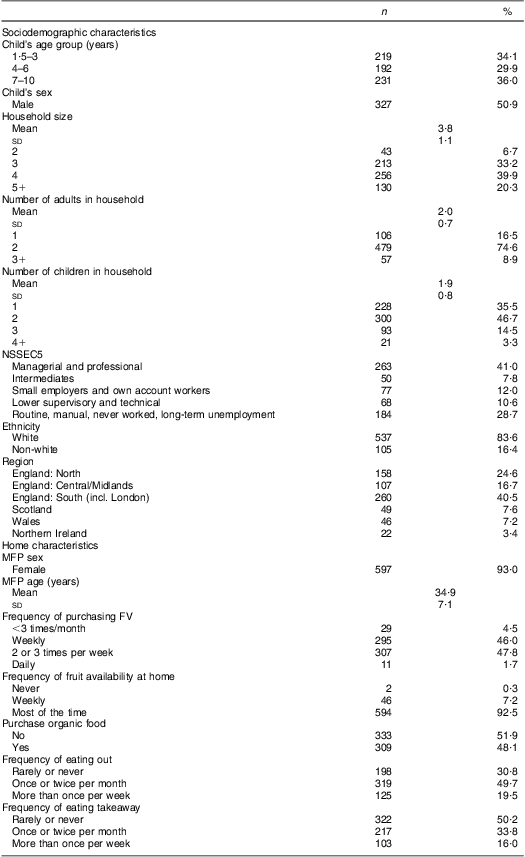
Table 1 shows the basic characteristics of the sample population. Fifty-one per cent of children were male. Mean household size was 3·8 (sd 1·1) persons, with two adults (sd 0·7) and two children (sd 0·8) on average. The majority of the sample was white, from England South (40·5 %), and 41 % of the household reference persons had managerial and professional occupations. In terms of food practice characteristics, the majority of the MFP were female, with a mean age of 35 (sd 7·2) years. Most MFP purchased FV weekly or 2 or 3 times per week, and indicated that fruit were available at home most of the time. About 70 % of children ate out at least once per month, while approximately 50 % of children rarely or never ate takeaway.
Table 1 Characteristics of the sample population: children (n 642) aged 1·5–10 years, UK National Diet and Nutrition Survey Rolling Programme (2008–2010)

NSSEC5, National Statistic Socio-economic Classification 5; MFP, main food provider; FV, fruit and vegetables.
Household socio-economic status and sociodemographic and food practice characteristics
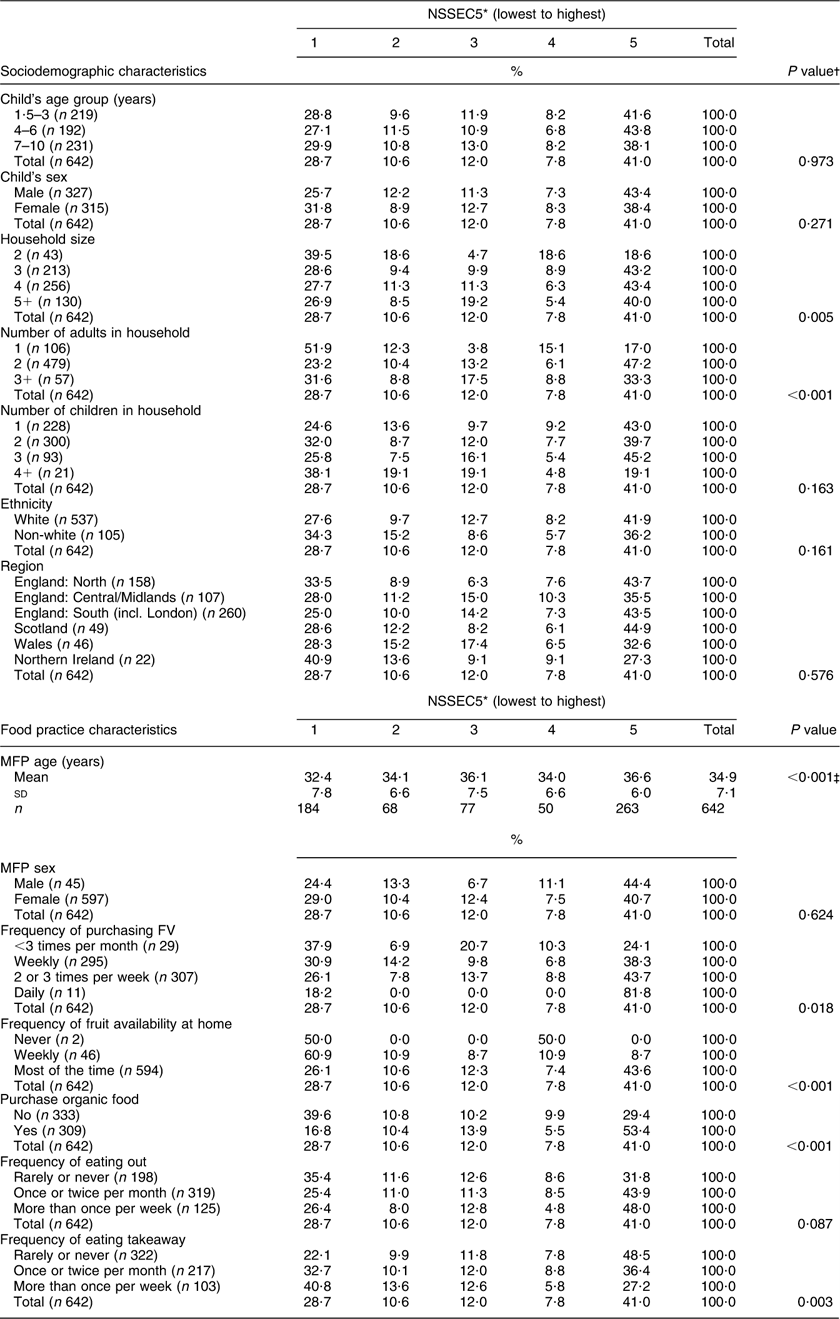
NSSEC5 was associated with seven out of twelve SFP variables (Table 2), including the number of adults per household, MFP age, frequency of fruit availability, organic food purchase (all P < 0·001), household size, frequency of eating takeaway (both P < 0·01) and frequency of FV purchase (P < 0·05).
Table 2 Associations between NSSEC5 and SFP characteristics: children (n 642) aged 1·5–10 years, UK National Diet and Nutrition Survey Rolling Programme (2008–2010)

NSSEC5, National Statistic Socio-economic Classification 5; SFP, sociodemographic and food practice; MFP, main food provider; FV, fruit and vegetables.
*NSSEC5 categories were as follows: 1 = routine, manual, never worked, long-term unemployment; 2 = lower supervisory and technical occupations; 3 = small employers and own account workers; 4 = intermediate occupations; 5 = managerial and professional occupations.
†Associations between SFP characteristics and NSSEC5 examined using χ 2 tests. P values significant at P < 0·05.
‡Association between MFP age and NSSEC5 tested using ANOVA. P value significant at P < 0·05.
Independent associations between sociodemographic and food practice characteristics and fruit and vegetable consumption
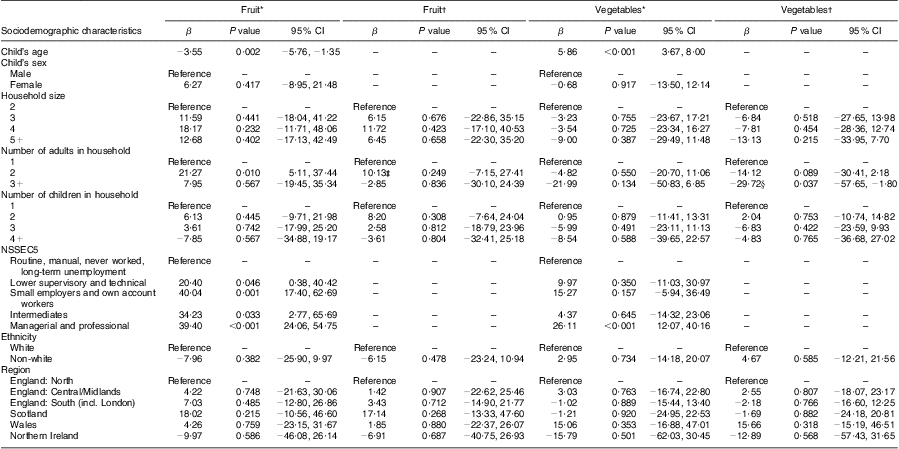
Child's age was associated with fruit consumption and vegetable consumption, where fruit consumption decreased as age increased (P = 0·002) with the reverse seen for vegetables (P < 0·001; Table 3). Compared with single-adult households (reference), children in households with two adults consumed approximately 21·3 g more fruit per day (P = 0·01); however the relationship was not significant when adjusted for NSSEC5. On the other hand, vegetable consumption was 29·7 g/d lower (P = 0·037) in households with more than three adults after adjusting for NSSEC5. Differences in consumption were seen in different household socio-economic classifications, where children in the highest NSSEC5 group (managerial and professional) consumed significantly more fruit and vegetables daily (both P < 0·001) than those from the lowest NSSEC5 group (reference). Other sociodemographic characteristics were not significantly related to FV consumption.
Table 3 Independent associations between sociodemographic characteristics and FV consumption: children (n 642) aged 1·5–10 years, UK National Diet and Nutrition Survey Rolling Programme (2008–2010)

FV, fruit and vegetable; NSSEC5, National Statistic Socio-economic Classification 5.
*Model adjusted for age and sex.
†Model adjusted for age, sex and NSSEC5.
‡Variable category became non-significant after adjusting for NSSEC5.
§Variable category became significant after adjusting for NSSEC5.
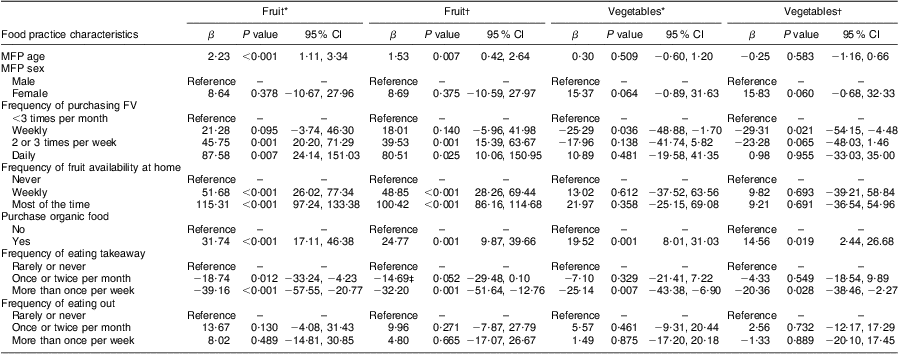
Associations were seen between food practice characteristics and FV consumption in children (Table 4) and most remained significant after adjusting for NSSEC5. Fruit consumption increased as MFP age increased (P = 0·007). Those who reported to have ever bought organic food consumed 24·8 g more fruit (P = 0·001) and 14·6 g more vegetables (P < 0·019) per day than those who had never purchased organic food (reference) after adjusting for NSSEC5 and age and sex of children (fully adjusted model). Higher fruit consumption was also seen in children in the fully adjusted model where the MFP reported to purchase fruit and vegetables frequently (2 or 3 times per week (P = 0·001) or once daily (P = 0·025)) and had fruit available at home weekly or most of the time (both P < 0·001). Those who ate takeaway more than once per week consumed 32·2 g less fruit (P < 0·001) and 20·4 g less vegetables (P = 0·028) per day than those rarely or never ate takeaway (reference) in the fully adjusted model.
Table 4 Independent associations between food practice characteristics and FV consumption: children (n 642) aged 1·5–10 years, UK National Diet and Nutrition Survey Rolling Programme (2008–2010)

FV, fruit and vegetable(s); MFP, main food provider; NSSEC5, National Statistic Socio-economic Classification 5.
*Model adjusted for age and sex.
†Model adjusted for age, sex and NSSEC5.
‡Variable category non-significant after adjusting for NSSEC5.
Pattern analysis
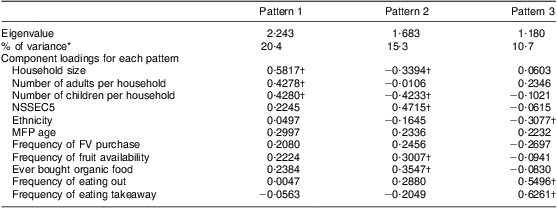
Of the eleven principal components (patterns) identified from the PCA, three were retained for subsequent analyses, where they explained approximately 46 % of total variance of the data. The loadings of each variable for the three patterns were shown in Table 5.
Table 5 Eigenvalues, percentage of variance and the component loadings for the three patterns retained

NSSEC5, National Statistic Socio-economic Classification 5; MFP, main food provider; FV, fruit and vegetable(s); SFP, sociodemographic and food purchase; PCA, principal component analysis.
*Percentage of variance explained by SFP variables in the PCA pattern scores.
†Component loading of variable ≥±0·30 considered to be highly correlated with pattern.
The first pattern described greater correlations with household structure, where higher positive correlations were seen for household size, number of children and number of adults per household. For each unit of increase in pattern score, children significantly increased consumption of fruit by 9·5 g/d (P < 0·001); no difference was observed for vegetables (Table 6). The second pattern was characterised by positive correlations for NSSEC5, fruit availability and organic food purchase, and in contrast to pattern 1, this pattern was negatively correlated with household size and the number of children per household. For this pattern, fruit and vegetable consumption increased significantly by 16·8 g/d and 8·1 g/d, respectively, per unit increase of pattern score (both P < 0·001). Lastly, the third pattern explained positive correlations with frequencies of eating out and eating takeaway, as well as negative correlation with ethnicity, indicating those who correlated higher with this pattern were more likely to be white than non-white. This pattern was associated with a lower consumption of both fruit (P = 0·012) and vegetables (P = 0·023).
Table 6 Regression of pattern scores for patterns 1, 2 and 3 on fruit consumption (g/d) and vegetable consumption (g/d): children (n 642) aged 1·5–10 years, UK National Diet and Nutrition Survey Rolling Programme (2008–2010)

*β, beta coefficient representing an increase of consumption (g/d) per unit increase of pattern score.
Discussion
The present study has demonstrated household SES was significantly associated with a number of SFP variables in this nationally representative sample of UK children aged 1·5 to 10 years. There were very few associations between sociodemographic variables and FV consumption, but several food practice characteristics were significantly related to FV consumption independent of household SES. Finally, through PCA, three distinct patterns of SFP characteristics were identified, where each pattern was uniquely associated with FV consumption.
While our results have shown that household SES is indeed a strong predictor of FV consumption, especially when comparing the highest NSSEC5 group with the lowest group, our hypothesis that associations between SFP characteristics and FV consumption were confounded by SES was only partially supported. Attenuation of the significance level was seen for fruit consumption in relation to only two variables after adjustment for NSSEC5 (‘two adults per household’ and ‘takeaway once or twice per month’), while vegetable consumption became significantly associated with ‘three or more adults per household’. The majority of the food practice characteristics remained significantly associated with FV consumption even after adjusting for NSSEC5. Therefore, several food practice characteristics were important in predicting FV consumption irrespective of household socio-economic situation. Factors other than household SES may be important in driving food practices and decisions to provide fruit and vegetables to children. As suggested by previous studies, these could be parent's education, nutritional knowledge and income or affordability, but they were not tested in the current analysis.
Our results suggest that children from households where fruit and vegetables were frequently purchased have fruit frequently available at home, infrequently eat takeaway, and have higher daily FV consumption. Similar findings are seen in the literature on home food environment, where home availability and accessibility of fruit and vegetables are important determinants of consumption(Reference Wyse, Campbell and Nathan5, Reference Cullen, Baranowski and Owens31), while high availability of unhealthy foods is associated with higher consumption of those(Reference Johnson, van Jaarsveld and Wardle8, Reference Campbell, Crawford and Salmon32). It has been suggested that adolescents in two-parent families have better eating behaviours such as consumption of fruit and vegetables and regular breakfast compared with single-parent families(Reference Riediger, Shooshtari and Moghadasian4, Reference Pearson, Atkin and Biddle33), although studies did not control for the effects of SES on family structure. Our results also showed that two-adult households had higher fruit consumption, although the relationship was no longer significant after adjusting for SES. It has been found previously that as age increases, children tend to consume less fruit as well as vegetables(Reference Rasmussen, Krolner and Klepp34). Our findings suggested that children's age was inversely associated with fruit consumption only, but not for vegetables where a positive relationship was seen. The contrasting result may reflect different methodologies used in measuring FV consumption between studies. Some studies have measured fruit and vegetables together as one food category using FFQ or other means of dietary assessment, while in the present study they were assessed using food diaries, disaggregated from mixed dishes and analysed separately, as previous results indicate that fruit consumption and vegetable consumption are two distinct eating behaviours(Reference Mak, Prynne and Cole35, Reference Reinaerts, de Nooijer and Candel36).
Households with three adults or more appeared to be unfavourable for children's vegetable consumption independent of SES. To our knowledge, this has not been tested before. MFP age was found to be a strong positive predictor of FV consumption, which partially supports the finding from a recent study where maternal age was associated with higher pattern scores on the ‘healthy’ diet(Reference Brazionis, Golley and Mittinty37); however, at odds with another study on maternal age at delivery and food consumption in pre-school children, where children of mothers aged less than 25 years were less likely to eat fruit and while those of mothers aged 25–29 years were less likely to eat vegetables(Reference Rogers and Emmett38). Older MFP may have greater knowledge and experience in providing food for children than those younger and less experienced, thus making healthier choices for children compared with their younger counterparts. FV consumption in children was also predicted by organic food purchases. Organic foods are sometimes perceived to be superior and healthier than non-organic, even though they are also more expensive(Reference Makatouni39). Organic buyers may be more conscious of the health of their children than those who never buy organic foods(Reference Davies, Titterington and Cochrane40).
We have demonstrated a novel approach to studying the combined effects of correlated SFP characteristics with FV consumption, using an exploratory data-driven technique, through which we identified three distinct patterns in NDNS children. The first pattern was characterised mainly by household structure variables. In the independent analysis, very few associations were seen between household structure characteristics and FV consumption; however as a pattern, household size was associated with fruit consumption, with children from larger households having higher fruit consumption. The results suggested that a higher ratio of parents to children in the household may be more important to predict children's fruit consumption than just the size of household alone. The second pattern was also of considerable interest, as it corresponded well with a combination of household factors and food practice variables. In contrast to the first pattern regarding household size, the pattern described a fewer number of children from smaller households. It also described higher-SES households with greater fruit availability and organic food purchases. These characteristics reflected households with greater affordability of fruit and vegetables for their children's diet, and were related to higher FV consumption. The third pattern was driven by the practice of a high frequency of eating out and takeaway food. Although the independent association of eating out was not significant, the pattern suggested that the overall behaviour of frequent eating out and takeaway was unfavourable for both fruit consumption and vegetable consumption. This finding resonates with previous literature on fast food and takeaway and diet quality(Reference Timperio, Ball and Roberts41, Reference Bowman, Gortmaker and Ebbeling42).
The strength of the present study lies in the high quality of the data, collected from a nationally representative sample of UK children aged 1·5–10 years, using 4 d diet diaries and comprehensive interviews delivered by trained interviewers. The measurement of FV consumption after disaggregation provided more complete dietary data than other studies(Reference Fitt, Mak and Stephen24). The use of PCA on SFP data advances knowledge of determinants of FV consumption within the home setting, demonstrating combined effects of SFP characteristics in relation to FV consumption. A further advantage of PCA was to minimise the problem of reduced statistical power of highly correlated factors analysed together; we have demonstrated the differences in analysing the SFP characteristics using independent regression with adjustment of household SES v. patterns of these characteristics on FV consumption in children.
There are, however, limitations associated with the study. PCA is a data-driven technique and the patterns produced are dependent on the data collected and sample specific. If the same technique is applied to another sample, the patterns produced may not be directly comparable to our results. PCA is known to be inflexible in dealing with measurement error-prone data, as well as non-continuous or ordinal data. As a result, only certain variables were analysed in the current study. Another limitation is the use of NSSEC5 as proxy of SES. Although NSSEC5 is considered a superior measure of household SES compared with measures used in previous national surveys, it does not reflect other important aspects of SES including household income and parental education. These have been shown to impact eating behaviour and dietary intake and therefore may have contributed to residual confounding in the results. Furthermore, because NDNS is nationally representative of the UK population, the majority of children in the current study were white. In addition, the children sample was from relatively high socio-economic groups. These factors may have limited the findings and the patterns derived from PCA, as previous studies have suggested that low consumption due to low availability and accessibility of fruit and vegetables tends to occur in those from lower socio-economic backgrounds and possibly in ethnic minority groups.
The study provides new insights on relationships between patterns of SFP characteristics in relation to FV consumption in a nationally representative sample of UK children, and has shown combined effects of these characteristics on FV consumption. While the method used was exploratory and the results may not apply to other populations, the findings add value to current perspectives on determinants of children's diet quality at the household level. Furthermore, the results have implications for public health practice and policy. Households who eat out and eat takeaways frequently are at higher risks of low FV consumption. The government should encourage food industry and caterers to increase FV content in ready meals and takeaways, and to provide more meal options with fruit and vegetables in restaurants and other eating establishments. These are likely to benefit families who often eat in such settings. Smaller families with high parent-to-children ratios from more superior socio-economic backgrounds are in a better position to provide fruit and vegetables for their children. Although family size or composition cannot be intervened or changed, it is important for public health nutrition policy makers to target families of lower SES to reduce such diet inequality. Possible ways for intervention could be to subsidise the costs of fruit and vegetables for families in low socio-economic positions, as well as to concentrate efforts on families with low income-to-family size ratios.
Acknowledgements
Sources of funding: The National Diet and Nutrition Survey is funded by the Department of Health and the Food Standards Agency. The present study was supported by the UK Medical Research Council (MRC project no. MC_US_A090_0039). T.N.M. was supported by a Cambridge International Student Scholarship from the Cambridge Overseas Trust. Conflicts of interest: The authors declare no conflicts of interest. Authors’ contributions: T.N.M. initiated the study, developed the methodology, analysed and interpreted the data, and wrote the manuscript. C.J.P., D.C. and T.N.M. prepared the dietary data. B.B. provided the CAPI data. A.M.S. oversaw the NDNS dietary data collection, coding and analysis, and supervised and edited the manuscript. All authors read and approved the final manuscript.


