Hostname: page-component-586b7cd67f-r5fsc Total loading time: 0 Render date: 2024-11-23T22:46:40.494Z Has data issue: false hasContentIssue false

Use of schizophrenia and bipolar disorder polygenic risk scores to identify psychotic disorders

Published online by Cambridge University Press:  16 August 2018

Maria Stella Calafato*
Affiliation:
Division of Psychiatry, University College London, UK
Johan H. Thygesen
Affiliation:
Division of Psychiatry, University College London, UK
Siri Ranlund
Affiliation:
Division of Psychiatry, University College London, UK
Eirini Zartaloudi
Affiliation:
Division of Psychiatry, University College London and Institute of Psychiatry, Psychology and Neuroscience at King's College London and South London and Maudsley NHS Foundation Trust, UK
Wiepke Cahn
Affiliation:
Department of Psychiatry, Brain Centre Rudolf Magnus, University Medical Center Utrecht, the Netherlands
Benedicto Crespo-Facorro
Affiliation:
CIBERSAM, Centro Investigación Biomédica en Red Salud Mental, Madrid and Department of Psychiatry, University Hospital Marqués de Valdecilla, School of Medicine, University of Cantabria–IDIVAL, Spain
Álvaro Díez-Revuelta
Affiliation:
Division of Psychiatry, University College London, London, UK and Laboratory of Cognitive and Computational Neuroscience − Centre for Biomedical Technology (CTB), Complutense University and Technical University of Madrid, Spain
Marta Di Forti
Affiliation:
Institute of Psychiatry, Psychology and Neuroscience at King's College London and South London and Maudsley NHS Foundation Trust, UK
Mei-Hua Hall
Affiliation:
Psychosis Neurobiology Laboratory, Harvard Medical School, McLean Hospital, USA
Conrad Iyegbe
Affiliation:
Institute of Psychiatry, Psychology and Neuroscience at King's College London and South London and Maudsley NHS Foundation Trust, UK
Assen Jablensky
Affiliation:
Centre for Clinical Research in Neuropsychiatry, The University of Western Australia, Australia
Rene Kahn
Affiliation:
Department of Psychiatry, Brain Centre Rudolf Magnus, University Medical Center Utrecht, the Netherlands
Luba Kalaydjieva
Affiliation:
Harry Perkins Institute of Medical Research and Centre for Medical Research, The University of Western Australia, Australia
Eugenia Kravariti
Affiliation:
Institute of Psychiatry, Psychology and Neuroscience at King's College London and South London and Maudsley NHS Foundation Trust, UK
Kuang Lin
Affiliation:
Institute of Psychiatry, Psychology and Neuroscience, King's College London and South London and Maudsley NHS Foundation Trust and Nuffield Department of Population Health, University of Oxford, UK
Colm McDonald
Affiliation:
The Centre for Neuroimaging & Cognitive Genomics (NICOG) and NCBES Galway Neuroscience Centre, National University of Ireland Galway, Ireland
Andrew M. McIntosh
Affiliation:
Division of Psychiatry, University of Edinburgh, Royal Edinburgh Hospital and Centre for Cognitive Ageing and Cognitive Epidemiology, University of Edinburgh, UK
Andrew McQuillin
Affiliation:
Division of Psychiatry, University College London, UK
Marco Picchioni
Affiliation:
Institute of Psychiatry, Psychology and Neuroscience, King's College London and South London and Maudsley NHS Foundation Trust, UK
Dan Rujescu
Affiliation:
Department of Psychiatry, Ludwig-Maximilians University of Munich and Department of Psychiatry, Psychotherapy and Psychosomatics, University of Halle Wittenberg, Germany
Madiha Shaikh
Affiliation:
North East London Foundation Trust and Research Department of Clinical, Educational and Health Psychology, University College London, UK
Timothea Toulopoulou
Affiliation:
Institute of Psychiatry, Psychology and Neuroscience, King's College London and South London and Maudsley NHS Foundation Trust, UK and Department of Psychology, Bilkent University, Turkey
Jim Van Os
Affiliation:
Institute of Psychiatry Psychology and Neuroscience, King's College London and South London and Maudsley NHS Foundation Trust, UK and Department of Psychiatry and Psychology, Maastricht University Medical Centre, EURON, the Netherlands
Evangelos Vassos
Affiliation:
Institute of Psychiatry, Psychology and Neuroscience, King's College London and South London and Maudsley NHS Foundation Trust, UK
Muriel Walshe
Affiliation:
Division of Psychiatry, University College London and Institute of Psychiatry, Psychology and Neuroscience, King's College London and South London and Maudsley NHS Foundation Trust, UK
John Powell
Affiliation:
Institute of Psychiatry, Psychology and Neuroscience, King's College London and South London and Maudsley NHS Foundation Trust, UK
Cathryn M. Lewis
Affiliation:
Institute of Psychiatry, Psychology and Neuroscience, King's College London and South London and Maudsley NHS Foundation Trust, UK
Robin M. Murray
Affiliation:
Institute of Psychiatry, Psychology and Neuroscience, King's College London and South London and Maudsley NHS Foundation Trust, UK
Elvira Bramon
Affiliation:
Division of Psychiatry and Institute of Cognitive Neuroscience, University College London and Institute of Psychiatry, Psychology and Neuroscience, King's College London and South London and Maudsley NHS Foundation Trust, UK
Genetic Risk and Outcome of Psychosis (GROUP) consortium
Affiliation:
Division of Psychiatry, University College London, UK Division of Psychiatry, University College London, UK Division of Psychiatry, University College London, UK Division of Psychiatry, University College London and Institute of Psychiatry, Psychology and Neuroscience at King's College London and South London and Maudsley NHS Foundation Trust, UK Department of Psychiatry, Brain Centre Rudolf Magnus, University Medical Center Utrecht, the Netherlands CIBERSAM, Centro Investigación Biomédica en Red Salud Mental, Madrid and Department of Psychiatry, University Hospital Marqués de Valdecilla, School of Medicine, University of Cantabria–IDIVAL, Spain Division of Psychiatry, University College London, London, UK and Laboratory of Cognitive and Computational Neuroscience − Centre for Biomedical Technology (CTB), Complutense University and Technical University of Madrid, Spain Institute of Psychiatry, Psychology and Neuroscience at King's College London and South London and Maudsley NHS Foundation Trust, UK Psychosis Neurobiology Laboratory, Harvard Medical School, McLean Hospital, USA Institute of Psychiatry, Psychology and Neuroscience at King's College London and South London and Maudsley NHS Foundation Trust, UK Centre for Clinical Research in Neuropsychiatry, The University of Western Australia, Australia Department of Psychiatry, Brain Centre Rudolf Magnus, University Medical Center Utrecht, the Netherlands Harry Perkins Institute of Medical Research and Centre for Medical Research, The University of Western Australia, Australia Institute of Psychiatry, Psychology and Neuroscience at King's College London and South London and Maudsley NHS Foundation Trust, UK Institute of Psychiatry, Psychology and Neuroscience, King's College London and South London and Maudsley NHS Foundation Trust and Nuffield Department of Population Health, University of Oxford, UK The Centre for Neuroimaging & Cognitive Genomics (NICOG) and NCBES Galway Neuroscience Centre, National University of Ireland Galway, Ireland Division of Psychiatry, University of Edinburgh, Royal Edinburgh Hospital and Centre for Cognitive Ageing and Cognitive Epidemiology, University of Edinburgh, UK Division of Psychiatry, University College London, UK Institute of Psychiatry, Psychology and Neuroscience, King's College London and South London and Maudsley NHS Foundation Trust, UK Department of Psychiatry, Ludwig-Maximilians University of Munich and Department of Psychiatry, Psychotherapy and Psychosomatics, University of Halle Wittenberg, Germany North East London Foundation Trust and Research Department of Clinical, Educational and Health Psychology, University College London, UK Institute of Psychiatry, Psychology and Neuroscience, King's College London and South London and Maudsley NHS Foundation Trust, UK and Department of Psychology, Bilkent University, Turkey Institute of Psychiatry Psychology and Neuroscience, King's College London and South London and Maudsley NHS Foundation Trust, UK and Department of Psychiatry and Psychology, Maastricht University Medical Centre, EURON, the Netherlands Institute of Psychiatry, Psychology and Neuroscience, King's College London and South London and Maudsley NHS Foundation Trust, UK Division of Psychiatry, University College London and Institute of Psychiatry, Psychology and Neuroscience, King's College London and South London and Maudsley NHS Foundation Trust, UK Institute of Psychiatry, Psychology and Neuroscience, King's College London and South London and Maudsley NHS Foundation Trust, UK Institute of Psychiatry, Psychology and Neuroscience, King's College London and South London and Maudsley NHS Foundation Trust, UK Institute of Psychiatry, Psychology and Neuroscience, King's College London and South London and Maudsley NHS Foundation Trust, UK Division of Psychiatry and Institute of Cognitive Neuroscience, University College London and Institute of Psychiatry, Psychology and Neuroscience, King's College London and South London and Maudsley NHS Foundation Trust, UK
Psychosis Endophenotypes International Consortium (PEIC)
Affiliation:
Division of Psychiatry, University College London, UK Division of Psychiatry, University College London, UK Division of Psychiatry, University College London, UK Division of Psychiatry, University College London and Institute of Psychiatry, Psychology and Neuroscience at King's College London and South London and Maudsley NHS Foundation Trust, UK Department of Psychiatry, Brain Centre Rudolf Magnus, University Medical Center Utrecht, the Netherlands CIBERSAM, Centro Investigación Biomédica en Red Salud Mental, Madrid and Department of Psychiatry, University Hospital Marqués de Valdecilla, School of Medicine, University of Cantabria–IDIVAL, Spain Division of Psychiatry, University College London, London, UK and Laboratory of Cognitive and Computational Neuroscience − Centre for Biomedical Technology (CTB), Complutense University and Technical University of Madrid, Spain Institute of Psychiatry, Psychology and Neuroscience at King's College London and South London and Maudsley NHS Foundation Trust, UK Psychosis Neurobiology Laboratory, Harvard Medical School, McLean Hospital, USA Institute of Psychiatry, Psychology and Neuroscience at King's College London and South London and Maudsley NHS Foundation Trust, UK Centre for Clinical Research in Neuropsychiatry, The University of Western Australia, Australia Department of Psychiatry, Brain Centre Rudolf Magnus, University Medical Center Utrecht, the Netherlands Harry Perkins Institute of Medical Research and Centre for Medical Research, The University of Western Australia, Australia Institute of Psychiatry, Psychology and Neuroscience at King's College London and South London and Maudsley NHS Foundation Trust, UK Institute of Psychiatry, Psychology and Neuroscience, King's College London and South London and Maudsley NHS Foundation Trust and Nuffield Department of Population Health, University of Oxford, UK The Centre for Neuroimaging & Cognitive Genomics (NICOG) and NCBES Galway Neuroscience Centre, National University of Ireland Galway, Ireland Division of Psychiatry, University of Edinburgh, Royal Edinburgh Hospital and Centre for Cognitive Ageing and Cognitive Epidemiology, University of Edinburgh, UK Division of Psychiatry, University College London, UK Institute of Psychiatry, Psychology and Neuroscience, King's College London and South London and Maudsley NHS Foundation Trust, UK Department of Psychiatry, Ludwig-Maximilians University of Munich and Department of Psychiatry, Psychotherapy and Psychosomatics, University of Halle Wittenberg, Germany North East London Foundation Trust and Research Department of Clinical, Educational and Health Psychology, University College London, UK Institute of Psychiatry, Psychology and Neuroscience, King's College London and South London and Maudsley NHS Foundation Trust, UK and Department of Psychology, Bilkent University, Turkey Institute of Psychiatry Psychology and Neuroscience, King's College London and South London and Maudsley NHS Foundation Trust, UK and Department of Psychiatry and Psychology, Maastricht University Medical Centre, EURON, the Netherlands Institute of Psychiatry, Psychology and Neuroscience, King's College London and South London and Maudsley NHS Foundation Trust, UK Division of Psychiatry, University College London and Institute of Psychiatry, Psychology and Neuroscience, King's College London and South London and Maudsley NHS Foundation Trust, UK Institute of Psychiatry, Psychology and Neuroscience, King's College London and South London and Maudsley NHS Foundation Trust, UK Institute of Psychiatry, Psychology and Neuroscience, King's College London and South London and Maudsley NHS Foundation Trust, UK Institute of Psychiatry, Psychology and Neuroscience, King's College London and South London and Maudsley NHS Foundation Trust, UK Division of Psychiatry and Institute of Cognitive Neuroscience, University College London and Institute of Psychiatry, Psychology and Neuroscience, King's College London and South London and Maudsley NHS Foundation Trust, UK
Wellcome Trust Case Control Consortium 2 (WTCCC2)
Affiliation:
Division of Psychiatry, University College London, UK Division of Psychiatry, University College London, UK Division of Psychiatry, University College London, UK Division of Psychiatry, University College London and Institute of Psychiatry, Psychology and Neuroscience at King's College London and South London and Maudsley NHS Foundation Trust, UK Department of Psychiatry, Brain Centre Rudolf Magnus, University Medical Center Utrecht, the Netherlands CIBERSAM, Centro Investigación Biomédica en Red Salud Mental, Madrid and Department of Psychiatry, University Hospital Marqués de Valdecilla, School of Medicine, University of Cantabria–IDIVAL, Spain Division of Psychiatry, University College London, London, UK and Laboratory of Cognitive and Computational Neuroscience − Centre for Biomedical Technology (CTB), Complutense University and Technical University of Madrid, Spain Institute of Psychiatry, Psychology and Neuroscience at King's College London and South London and Maudsley NHS Foundation Trust, UK Psychosis Neurobiology Laboratory, Harvard Medical School, McLean Hospital, USA Institute of Psychiatry, Psychology and Neuroscience at King's College London and South London and Maudsley NHS Foundation Trust, UK Centre for Clinical Research in Neuropsychiatry, The University of Western Australia, Australia Department of Psychiatry, Brain Centre Rudolf Magnus, University Medical Center Utrecht, the Netherlands Harry Perkins Institute of Medical Research and Centre for Medical Research, The University of Western Australia, Australia Institute of Psychiatry, Psychology and Neuroscience at King's College London and South London and Maudsley NHS Foundation Trust, UK Institute of Psychiatry, Psychology and Neuroscience, King's College London and South London and Maudsley NHS Foundation Trust and Nuffield Department of Population Health, University of Oxford, UK The Centre for Neuroimaging & Cognitive Genomics (NICOG) and NCBES Galway Neuroscience Centre, National University of Ireland Galway, Ireland Division of Psychiatry, University of Edinburgh, Royal Edinburgh Hospital and Centre for Cognitive Ageing and Cognitive Epidemiology, University of Edinburgh, UK Division of Psychiatry, University College London, UK Institute of Psychiatry, Psychology and Neuroscience, King's College London and South London and Maudsley NHS Foundation Trust, UK Department of Psychiatry, Ludwig-Maximilians University of Munich and Department of Psychiatry, Psychotherapy and Psychosomatics, University of Halle Wittenberg, Germany North East London Foundation Trust and Research Department of Clinical, Educational and Health Psychology, University College London, UK Institute of Psychiatry, Psychology and Neuroscience, King's College London and South London and Maudsley NHS Foundation Trust, UK and Department of Psychology, Bilkent University, Turkey Institute of Psychiatry Psychology and Neuroscience, King's College London and South London and Maudsley NHS Foundation Trust, UK and Department of Psychiatry and Psychology, Maastricht University Medical Centre, EURON, the Netherlands Institute of Psychiatry, Psychology and Neuroscience, King's College London and South London and Maudsley NHS Foundation Trust, UK Division of Psychiatry, University College London and Institute of Psychiatry, Psychology and Neuroscience, King's College London and South London and Maudsley NHS Foundation Trust, UK Institute of Psychiatry, Psychology and Neuroscience, King's College London and South London and Maudsley NHS Foundation Trust, UK Institute of Psychiatry, Psychology and Neuroscience, King's College London and South London and Maudsley NHS Foundation Trust, UK Institute of Psychiatry, Psychology and Neuroscience, King's College London and South London and Maudsley NHS Foundation Trust, UK Division of Psychiatry and Institute of Cognitive Neuroscience, University College London and Institute of Psychiatry, Psychology and Neuroscience, King's College London and South London and Maudsley NHS Foundation Trust, UK
*
Correspondence: Maria Stella Calafato, Mental Health Neuroscience Research Department, Division of Psychiatry, University College London, 149 Tottenham Court Rd, London W1T 7NF, UK. Email: [email protected]
Rights & Permissions [Opens in a new window]

Abstract

Background

There is increasing evidence for shared genetic susceptibility between schizophrenia and bipolar disorder. Although genetic variants only convey subtle increases in risk individually, their combination into a polygenic risk score constitutes a strong disease predictor.

Aims

To investigate whether schizophrenia and bipolar disorder polygenic risk scores can distinguish people with broadly defined psychosis and their unaffected relatives from controls.

Method

Using the latest Psychiatric Genomics Consortium data, we calculated schizophrenia and bipolar disorder polygenic risk scores for 1168 people with psychosis, 552 unaffected relatives and 1472 controls.

Results

Patients with broadly defined psychosis had dramatic increases in schizophrenia and bipolar polygenic risk scores, as did their relatives, albeit to a lesser degree. However, the accuracy of predictive models was modest.

Conclusions

Although polygenic risk scores are not ready for clinical use, it is hoped that as they are refined they could help towards risk reduction advice and early interventions for psychosis.

Declaration of interest

R.M.M. has received honoraria for lectures from Janssen, Lundbeck, Lilly, Otsuka and Sunovian.

Type
Papers
Creative Commons
Creative Common License - CCCreative Common License - BY
This is an Open Access article, distributed under the terms of the Creative Commons Attribution licence (http://creativecommons.org/licenses/by/4.0/), which permits unrestricted re-use, distribution, and reproduction in any medium, provided the original work is properly cited.
Copyright
Copyright © The Royal College of Psychiatrists 2018

Psychotic disorders affect approximately 4% of the general population.Reference Bogren, Mattisson, Isberg and Nettelbladt1 Epidemiological and genetic studies show that they have high heritability.Reference Iyegbe, Campbell, Butler, Ajnakina and Sham2, Reference Gratten, Wray, Keller and Visscher3 A Psychiatric Genomics Consortium mega-analysis of genome-wide association studies (GWAS) for schizophrenia identified more than a hundred common single nucleotide polymorphisms (SNPs) with small individual effects conferring susceptibility to the disorder.4 A similar mega-analysis for bipolar disorder, albeit with a more modest sample size, identified common risk variants specific to bipolar disorder and some shared with schizophrenia.Reference Sklar, Ripke, Scott, Andreassen and Cichon5 Genetic epidemiology studies have shown that when compared with controls, first-degree relatives of people with schizophrenia have increased risk for bipolar disorder and first-degree relatives of people with bipolar disorder have increased risk for schizophrenia.Reference Lichtenstein, Yip, Björk, Pawitan, Cannon and Sullivan6 GWAS have now provided molecular evidence for this common genetic architecture between schizophrenia and bipolar disorder.Reference Sklar, Ripke, Scott, Andreassen and Cichon5, Reference Ruderfer, Fanous, Ripke, McQuillin, Amdur and Gejman7Reference Cardno and Owen11 Psychotic disorders are highly polygenic with thousands of contributing common genetic variants.Reference Harrison12, Reference Geschwind and Flint13 Although each individual variant has a very low predictive power, their combination into a polygenic risk score (PRS) represents a stronger predictor of disease.Reference Purcell, Wray, Stone, Visscher, O'Donovan and Sullivan8, 14Reference Vassos, Di Forti, Coleman, Iyegbe, Prata and Euesden20 Our primary aim was to evaluate whether PRSs specific for schizophrenia or bipolar disorder, could discriminate case–control status in our sample of patients with broadly defined psychosis. Our secondary aim was to investigate whether PRSs were different in the unaffected relatives of patients with broadly defined psychotic disorder compared with controls.

Method

Sample description

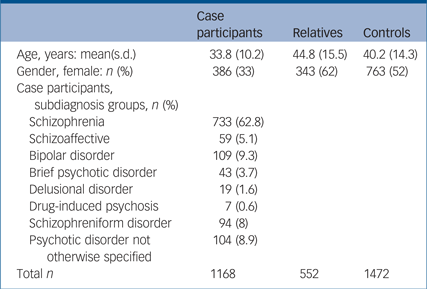
Samples were collected at research centres across Europe and Australia. Our study included patients with a range of psychotic disorders (1168), unaffected relatives of patients (552) and healthy controls with no personal or family history of psychosis (1472) (Table 1). The sample presented here was included in previous GWAS seeking to identify loci for schizophrenia or psychosis. Details of sample overlap are provided in the supplement (Supplementary Data 1; available at https://doi.org/10.1192/bjp.2018.89).4, Reference Bramon, Pirinen, Strange, Lin, Freeman and Bellenguez9, Reference Ripke, O'Dushlaine, Chambert, Moran, Kähler and Akterin21 In order to avoid any inflation of the PRS effect size, in each analysis we included only participants that were unrelated. This was achieved by random exclusion of related participants.

Table 1 Demographics in the case participants, relatives and controls
All participants provided written informed consent, and the study was approved by the respective ethical committees at each one of the participating centres.

Of the 1168 case participants in this study, 733 met criteria for schizophrenia (62.8%), 59 for schizoaffective disorder (5.1%), 104 for psychotic disorder not otherwise specified (8.9%), 94 for schizophreniform disorder (8%), 43 for brief psychotic disorder (3.7%), 19 for delusional disorder (1.6%), 7 for substance-induced psychosis (0.6%) and 109 for bipolar disorder with psychotic features (9.3%) (Table 1). Additional details are provided in Supplementary Tables 1 and 2 available at https://doi.org/10.1192/bjp.2018.89.

DNA preparation, genotyping and imputation

Genomic DNA obtained from blood was sent to the Wellcome Trust Sanger Institute (Cambridge, UK). Samples were genotyped with the Genome-wide Human SNP Array 6.0 at Affymetrix Services Laboratory as part of the Wellcome Trust Case Control Consortium round 2 project (https://www.wtccc.org.uk/). Thereafter the data quality control, imputation and statistical analyses were conducted by K.L., J.T., S.C. and E.B. at University College London. DNA preparation, genotyping and imputation are described in more details in the supplement (Supplementary Data 2) and in Bramon et al.Reference Bramon, Pirinen, Strange, Lin, Freeman and Bellenguez9

Phenotype definition

Participants were excluded from the study if they had either a history of neurological disease or head injury resulting in loss of consciousness lasting more than 5 min. DSM-IV22 diagnosis was ascertained using a structured clinical interview with one of the following three instruments: the Schedule for Affective Disorders and Schizophrenia, the Structured Clinical Interview for DSM Disorders or the Schedules for Clinical Assessment in Neuropsychiatry.Reference Wing, Babor, Brugha, Burke, Cooper and Giel23Reference Spitzer, Williams, Gibbon and First25

Population structure analysis

To investigate the genetic structure in the data, we performed principal component analysis using EIGENSOFT version 3.0 on a pruned set of SNPs.Reference Patterson, Price and Reich26 We applied the following SNP pruning filters on 695 193 SNPs, which remained after quality control: a 10% minor allele frequency, 10−3 Hardy–Weinberg equilibrium deviation threshold and all SNPs within a 1500 SNP window had to have r 2 below 0.2 (window shift of 150 used). Thus, a subset of 71 677 SNPs was selected for principal component analysisReference Patterson, Price and Reich26, Reference Price, Patterson, Plenge, Weinblatt, Shadick and Reich27 and three ancestry covariate vectors were obtained.Reference Bramon, Pirinen, Strange, Lin, Freeman and Bellenguez9 Plots can be found in Supplementary Fig.1.

PRSs calculation

We calculated the PRSs separately for schizophrenia and for bipolar disorder in all our study participants following established methodology.Reference Purcell, Wray, Stone, Visscher, O'Donovan and Sullivan8, Reference Euesden, Lewis and O'Reilly28, Reference Evans, Visscher and Wray29 Odds ratios (ORs) of allelic association tests were obtained from the most recent Psychiatric Genomics Consortium mega-analysis of GWAS for schizophrenia4 and for bipolar disorder,Reference Sklar, Ripke, Scott, Andreassen and Cichon5 excluding all samples overlapping with the current study. For schizophrenia, the used discovery sample included 31 658 case participants and 42 022 controls, and for bipolar disorder, it included 7481 case participants and 9250 controls.4, Reference Sklar, Ripke, Scott, Andreassen and Cichon5 In each discovery samples, SNPs were selected at ten significance thresholds (P T<5 × 10–08, 1 × 10−06, 1 × 10−04, 1 × 10−03, 0.01, 0.05, 0.1, 0.2, 0.5, 1). Linkage disequilibrium pruning was used to identify SNPs in linkage equilibrium with each other. The number of SNPs included at each P-value threshold is shown in Supplementary Table 4. In order to obtain PRSs in each individual, for each SNP the number of risk alleles carried by the individual (0, 1, 2) was multiplied by the log of the OR of the allelic association test. The PRS was then calculated adding up the values obtained for each SNP.

Statistical analysis

We used logistic regression, with the first three population structure principal components and the centre of ascertainment of the samples as covariates to test whether the PRSs were predictive of case–control or relative–control status in our study. The proportion of the variance explained by the PRS was calculated as Nagelkerke's pseudo-R 2, by comparing a full model (PRS plus covariates) to a reference model (covariates only). The R package pROCReference Robin, Turck, Hainard, Tiberti, Lisacek and Sanchez30 was used to calculate the area under the receiver operator characteristic curve (AUC) in both the full and reference models.

In the primary analysis, the schizophrenia PRSs and the bipolar disorder PRSs were compared between 1168 case participants and 1472 controls. In the secondary analysis, we split the 1168 case participants with broadly defined psychosis into three subcategories, depending on the DSM diagnosis: schizophrenia/schizoaffective disorder, bipolar disorder and all other psychotic disorders. We then compared both schizophrenia and bipolar disorder PRSs between 552 unaffected relatives and healthy controls. See Supplementary Table 5 for a breakdown of these secondary analysis subgroups. In order to divide case participants and controls into decile categories, we calculated Z-standardised PRSs, using the mean and s.d. of controls in each centre.

Results

Analysis of PRSs in psychotic disorders

We calculated PRSs for schizophrenia and bipolar disorder in 1472 controls and 1168 people diagnosed with a range of psychotic disorders. Density plots of schizophrenia and bipolar disorder PRSs are shown in the Supplementary Fig. 2).

Using logistic regression, we found highly significant differences for both schizophrenia and bipolar disorder PRSs between case participants with psychosis and controls (Table 2 and Supplementary Table 6). The difference was greater for increasingly liberal P-value thresholds (Table 2 and Supplementary Table 6). Compared with the bipolar disorder PRSs, the schizophrenia PRSs had a better ability to discriminate between case participants and controls.

Table 2 Comparison of schizophrenia and bipolar disorder polygenic risk scores between patients with psychotic disorders and controlsa

a. Schizophrenia polygenic risk scores and bipolar disorder polygenic risk scores were calculated using as reference, respectively, the outcome of the schizophrenia and bipolar disorder mega-analyses conducted by the Psychiatric Genomics Consortium. We then compared the scores between 1168 case participants and 1472 controls using standard logistic regression at ten different P-value thresholds (P T 5 × 10−08, 1 × 10−06, 1 × 10−04, 1 × 10−03, 0.01, 0.05, 0.1, 0.2, 0.5, 1). Regression models included the first three ancestry-based principal components and a cohort indicator as covariates. For clarity, here we report P-values and the variance explained in disease risk as measured by Nagelkerke's pseudo-R 2 at four P-value thresholds (PT 5 × 10−08, 1 × 10−04, 0.05, 1). Results at each one of the ten different thresholds are available in Supplementary Table 6.

The proportion of the variance in psychosis risk explained by the schizophrenia PRS increased with progressively more inclusive P-value thresholds, reaching a plateau of 9% variance explained at the 0.05 P-value threshold (Nagelkerke's pseudo-R 2 = 9%; P = 7.6 × 10−40) (Table 2, Supplementary Table 6 and Fig. 1). At the same P-value threshold the variance explained by the bipolar disorder PRS was only 1.7% (P T = 0.05, Nagelkerke's pseudo-R 2 = 1.7%) (Table 2, Supplementary Table 6 and Fig. 1). Results for all the P-value thresholds used are reported in Fig. 1 and in the Supplementary Table 6.
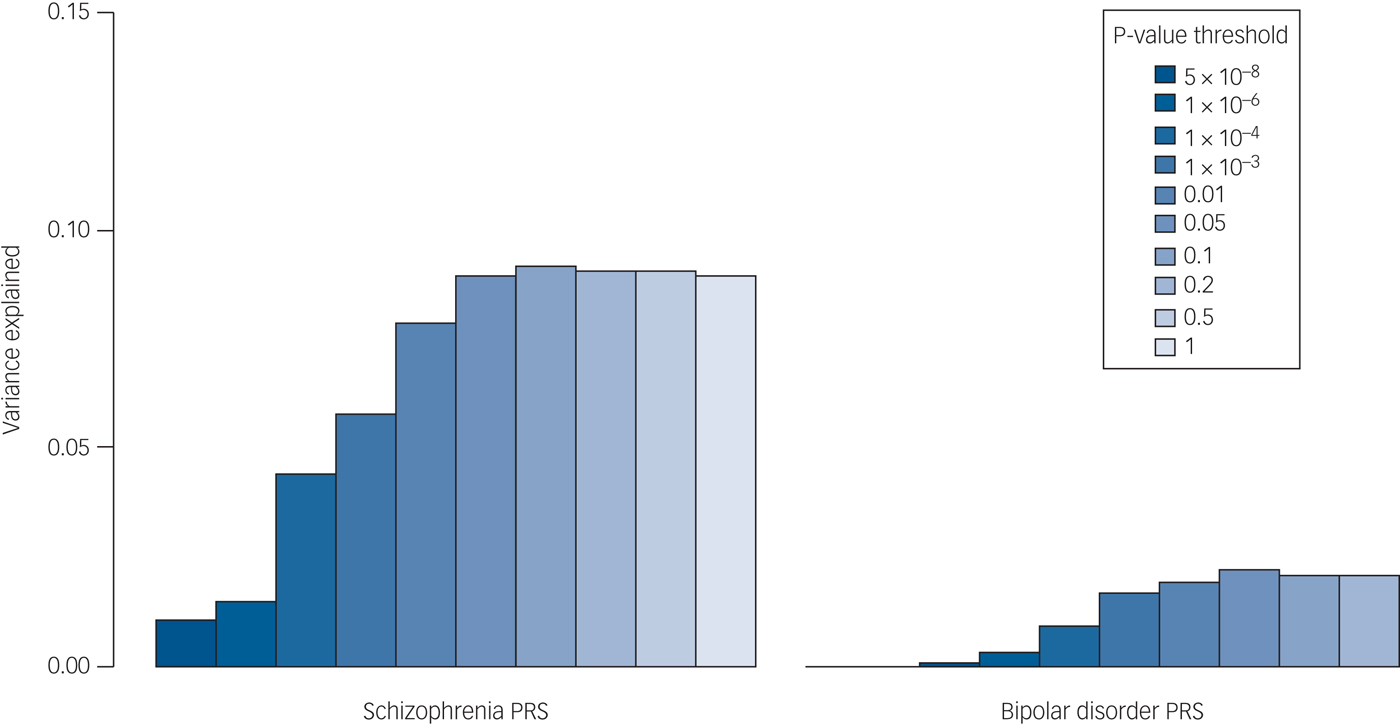
Fig. 1 Percentage of the variance in disease risk explained by the schizophrenia and the bipolar disorder polygenic risk scores (PRSs). The proportion of variance explained (calculated as Nagelkerke's pseudo-R 2) was computed by comparison of the full model (either schizophrenia-based or bipolar disorder-based PRS plus covariates) to the reduced model (covariates only). As per standard procedures,4 (ten different P-value thresholds (PT) were used to select risk alleles used in the computation of PRSs. The variance explained at each P-value threshold (5 × 10−08, 1 × 10−06, 1 × 10−04, 1 × 10−03, 0.01, 0.05, 0.1, 0.2, 0.5 and 1) is shown. Significance testing results are available in Supplementary Table S6.

Given that 68% of our case participants had a diagnosis of schizophrenia/schizoaffective disorder, to rule out the possibility that the results obtained were driven by this subgroup, we tested whether the schizophrenia and bipolar disorder PRSs were able to discriminate between case participants and controls in each of the three diagnostic subcategories included in our study (schizophrenia/schizoaffective disorder combined, bipolar disorder or other psychotic disorders). We demonstrated that even if the discriminative ability of the schizophrenia PRS was highest in the schizophrenia/schizoaffective disorder subcategory, it was also able to discriminate case participants with either bipolar disorder or other psychotic disorders from controls with highly significant group differences. At P T = 0.05 the variance in case–control status explained by the schizophrenia PRS (Nagelkerke's pseudo-R 2) in the bipolar disorder and other psychotic disorders subcategory was 3.4%, providing evidence that our results were not only driven by schizophrenia/schizoaffective disorder subcategory (Table 3 and Supplementary Table 7).

Table 3 Schizophrenia and bipolar disorder polygenic risk scores (PRSs) in the three diagnostic subgroups and in unaffected relatives v. controlsa

a. Significance of the case–control PRS difference was analysed by standard logistic regression using different P-value thresholds (P T 5 × 10−08, 1 × 10−04, 0.05 and 1). Here, P-values and Nagelkerke's R 2 obtained at P T = 0.05 are reported. Results at each one of the four different P-value thresholds (P T) are available in Supplementary Table 7. Logistic regression included the first three ancestry-based principal components and a cohort indicator as covariates. We report the proportion of the phenotypic variance explained by the risk polygenic score as measured by Nagelkerke's pseudo-R 2.

To evaluate the accuracy of the schizophrenia and bipolar disorder PRSs in the detection of broadly defined psychotic disorders, we calculated the AUC. For the model containing only covariates (cohort and three population structure principal components) the AUC was 0.63. Adding the schizophrenia PRS to the model increased the AUC to 0.7, whereas adding the bipolar PRS increased it to 0.65 (Supplementary Fig. 3).

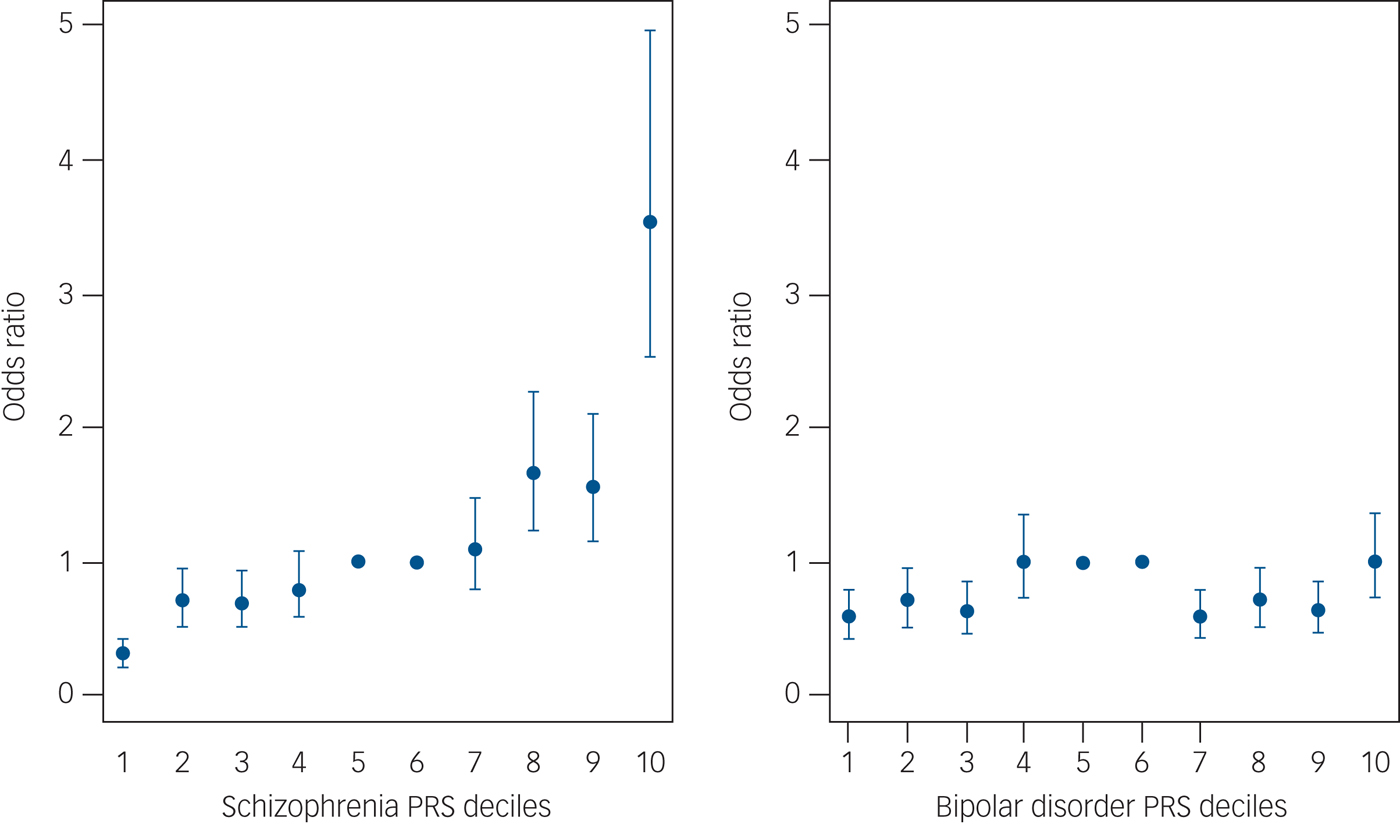
We then divided our sample into deciles based on schizophrenia and bipolar disorder PRSs and calculated the ORs for affected status for each decile using as reference the central risk deciles (fifth and sixth). As expected, we observed an increase in the case-to-control ratio in progressively higher decile categories (Fig. 2 and Supplementary Table 8). Similarly, the odds of having broadly defined psychosis increased progressively across PRS deciles. Compared with individuals in the central deciles (fifth and sixth), those at the tenth and highest decile had an OR for psychosis of 3.53 (95% CI 2.53–4.97) for schizophrenia PRS (Fig. 3 and Supplementary Table 9). For the bipolar PRS no difference was found between central and highest deciles (OR = 1, 95% CI 0.73–1.35) (Fig. 3 and Supplementary Table 9).
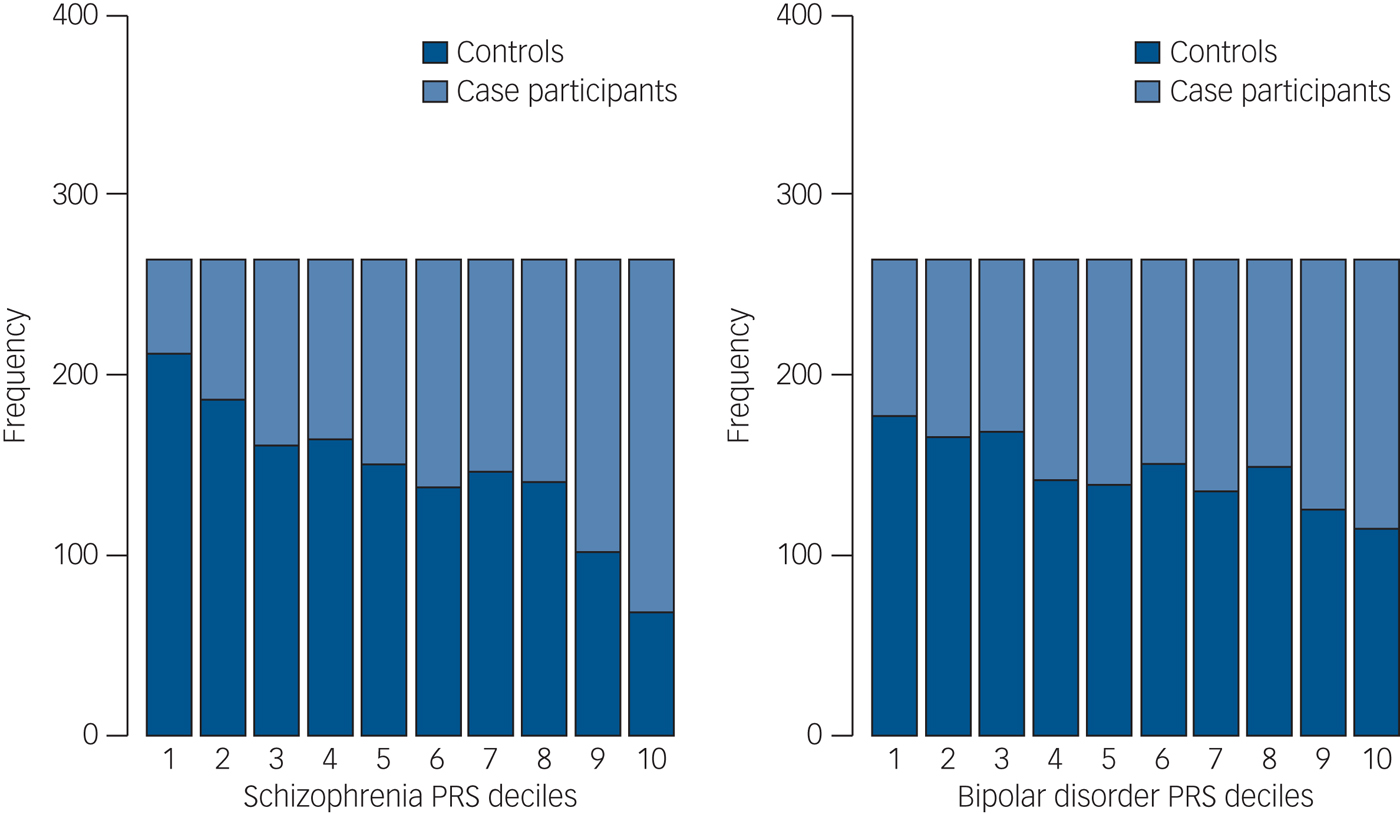
Fig. 2 Case and control distribution in the risk polygenic score (PRS) deciles. The Y-axis corresponds to the number of individuals in each PRS decile. The P-value threshold used to calculate PRS was P T = 0.05. Based on their PRS, samples were allocated to deciles (decile 1, lowest PRS; 10, highest PRS). The figure shows that especially for schizophrenia PRSs the effect is concentrated in the tails of the distribution (deciles 1–2 and 9–10). There is very little difference between the deciles 4–7 in the middle, as is expected from a normal distribution.
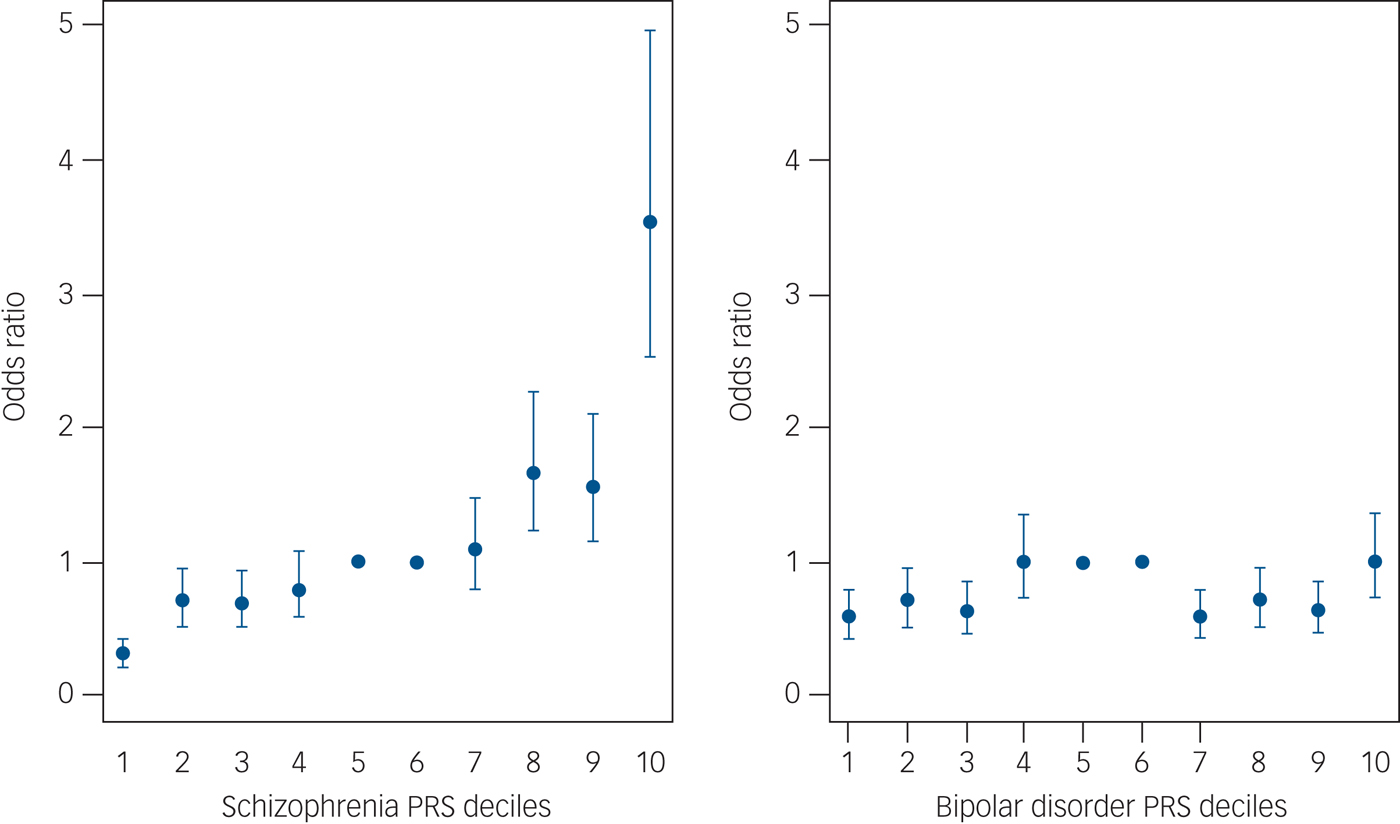
Fig. 3 Odds ratio for broadly defined psychosis by risk polygenic score (PRS). The threshold used for selecting risk alleles was P-value threshold (P T) = 0.05. Based on PRSs, samples were allocated to deciles (decile 1, lowest PRS; 10, highest PRS). A dummy variable was created to compare the central deciles 5 and 6, used as reference to the others. Odds ratio and 95% CI were estimated using logistic regression including ethnicity principal components and cohort indicator as covariates. The points represent the odds ratios. The bars represent the lower and upper CI of the odds ratios.

Analysis of PRSs in the unaffected relatives of people with psychosis

Given the established heritability of psychotic disorders, we evaluated whether schizophrenia and bipolar disorder PRSs could discriminate between unaffected relatives, who had never experienced any psychotic symptoms and healthy controls (Supplementary Fig. 4). Compared with controls, unaffected relatives had significantly higher PRSs both for schizophrenia (P = 1.2 × 10−4) and bipolar disorder (P = 2.1 × 10−2). Analyses at the P-value threshold of 0.05 are shown in Table 3 and full details are in Supplementary Table 7.

Discussion

In this study, we have shown that PRSs specific for schizophrenia or for bipolar disorder obtained from a large international cohort are also associated with broadly defined psychosis in an independent sample. Compared with controls, patients with a range of psychotic disorders have significantly higher PRSs for both schizophrenia and for bipolar disorder. The schizophrenia and bipolar disorder PRSs explained, respectively, 9 and 2% of the variance in psychosis risk, which is substantial for a single variable.

The PRS for schizophrenia had a much better performance than the PRS for bipolar disorder and this could be because of several factors. First, the schizophrenia PRS contains a more accurate measure of genetic susceptibility, as it is derived from a much larger discovery sample than the bipolar PRS.4,Reference Sklar, Ripke, Scott, Andreassen and Cichon5 The last Psychiatric Genomics Consortium schizophrenia meta-analysis provided evidence that increasing the size of discovery samples leads to a significant increase in the variance explained by PRS.4, Reference Purcell, Wray, Stone, Visscher, O'Donovan and Sullivan8, Second, our case participants with a range of psychotic disorders included a majority of patients with schizophrenia and schizoaffective disorder (68%), which drives these performance results. However, our secondary analyses subdividing in three diagnostic categories, also showed a better performance for the schizophrenia PRS in discriminating case participants with bipolar disorder and other psychotic disorders from controls. Therefore, the use of larger discovery sample sizes appears to be the best way forward to further enhance the accuracy of PRS.Reference Purcell, Wray, Stone, Visscher, O'Donovan and Sullivan8

GWAS have provided evidence for genetic overlap between schizophrenia and bipolar disorder.Reference Sklar, Ripke, Scott, Andreassen and Cichon5, Reference Ruderfer, Fanous, Ripke, McQuillin, Amdur and Gejman7Reference Cardno and Owen11, 14 Our findings add evidence to the hypothesis of shared genetic architecture across the psychosis spectrum, supporting a continuum model for the aetiology of these disorders.Reference Gratten, Wray, Keller and Visscher3Reference Bogren, Mattisson, Isberg and Nettelbladt1, Reference Gratten, Wray, Keller and Visscher3Reference Iyegbe, Campbell, Butler, Ajnakina and Sham2 The patients with bipolar disorder included in this study had type I bipolar disorder with a history of psychotic symptoms at some point in their illness. Therefore, in our sample it was not possible to make any comparison of schizophrenia and bipolar PRSs in patients with bipolar disorder with and without psychotic features. A study just published showed the existence of a gradient of schizophrenia PRSs across bipolar disorder subtypes (bipolar disorder type I with psychosis > bipolar disorder type I without psychosis > bipolar disorder type II).Reference Gratten, Wray, Keller and Visscher3Reference Gratten, Wray, Keller and Visscher3

Given the heritability and familial aggregation patterns in schizophrenia and bipolar disorder, we expected unaffected relatives to have higher PRSs than the general population.Reference Gratten, Wray, Keller and Visscher34Reference Gratten, Wray, Keller and Visscher3Reference Lichtenstein, Yip, Björk, Pawitan, Cannon and Sullivan6 In a recent study, Bigdeli et al showed that 217 healthy first-degree relatives of patients with schizophrenia and healthy controls could be distinguished by schizophrenia PRSs.Reference Gratten, Wray, Keller and Visscher3Reference Lichtenstein, Yip, Björk, Pawitan, Cannon and Sullivan6 We replicated their findings using an independent sample with 552 unaffected relatives of patients diagnosed with a wide range of psychotic disorders. Furthermore, we showed that the bipolar disorder PRS is significantly higher among healthy relatives compared with controls.

Strengths and limitations of PRSs

Even if the schizophrenia and bipolar PRSs can discriminate case participants from controls, their accuracy is currently modest, as indicated by the AUC of 0.7 and 0.65 for schizophrenia and bipolar disorder, respectively. The AUC is an estimate of diagnostic accuracy which equals to 0.5 when a diagnostic test is no better than chance and reaches 1 if the test could discriminate patients from controls to perfection.Reference Gratten, Wray, Keller and Visscher3Reference Ruderfer, Fanous, Ripke, McQuillin, Amdur and Gejman7, Reference Zou, O'Malley and Mauri38 Typically an AUC of 0.7 is considered to have moderate discriminatory power and only when reaching 0.9 it is deemed to have high discriminatory power.Reference Hajian-Tilaki39, Reference Grzybowski and Younger40 For example, the models used in general practice to estimate cardiovascular disease risk and to offer preventative interventions have reached AUCs in the range of 0.74–0.85.4Reference Bogren, Mattisson, Isberg and Nettelbladt1, 4Reference Iyegbe, Campbell, Butler, Ajnakina and Sham2 In the case of psychotic disorders, currently the moderate accuracy precludes the use of schizophrenia and bipolar PRSs as a diagnostic or prognostic tool in clinical practice.

Current genetic findings explain only about a third of the genetic variance of these disorders. The so-called ‘missing heritability’ may reside in further common variants yet to be identified, rare mutations, copy number variants and gene–gene interactions.Reference Harrison12 As larger samples are being collected through international efforts, additional common and rare genetic variants will be identified and the performance of PRSs is expected to improve.Reference Wray, Lee, Mehta, Vinkhuyzen, Dudbridge and Middeldorp17, 4Reference Gratten, Wray, Keller and Visscher3

In the future PRSs may also incorporate socioenvironmental factors as well as gene–gene and gene–environment interactions, thus eventually enabling their use in clinical practice for risk reduction advice as it is happening in cardiovascular disease.44Reference Sklar, Ripke, Scott, Andreassen and Cichon5Reference Iyegbe, Campbell, Butler, Ajnakina and Sham2 There is growing interest in the potential of PRSs in public health campaigns to reduce environmental risks and to facilitate access to early treatment for psychosis.Reference Sklar, Ripke, Scott, Andreassen and Cichon5Reference Gratten, Wray, Keller and Visscher3 Finally, PRSs constitute a powerful research tool, that combined with large epidemiological studies of environmental risks are advancing our understanding of the aetiology of psychotic disorders.

Supplementary material

Supplementary material is available online at https://doi.org/10.1192/bjp.2018.89.

Funding

This work was funded by the Medical Research Council (G0901310), the Wellcome Trust (grants 085475/B/08/Z, 085475/Z/08/Z), the European Union's Seventh Framework Programme for research, technological development and demonstration (grant 602450). This study was also supported by the NIHR Biomedical Research Centre at University College London (mental health theme) and by the NIHR Biomedical Research Centre at the South London and Maudsley NHS Foundation Trust and Institute of Psychiatry – Kings College London. Further support: NHIR Academic Clinical fellowship awarded to M.S.C.. E.B. acknowledges research funding from: BMA Margaret Temple grants 2016 and 2006, MRC – Korean Health Industry Development Institute Partnering Award (MC_PC_16014), MRC New Investigator Award and a MRC Centenary Award (G0901310), National Institute of Health Research UK post-doctoral fellowship, the Psychiatry Research Trust, the Schizophrenia Research Fund, the Brain and Behaviour Research foundation's NARSAD Young Investigator Awards 2005, 2008, Wellcome Trust Research Training Fellowship and the NIHR Biomedical Research Centre for Mental Health at the South London and Maudsley NHS Foundation Trust and Institute of Psychiatry Kings College London. The Brain and Behaviour Research foundation's (NARSAD's) Young Investigator Award (Grant 22604, awarded to C.I.). The BMA Margaret Temple grant 2016 to J.H.T. European Research Council Marie Curie award to A.D.-R.

The infrastructure for the GROUP consortium is funded through the Geestkracht programme of the Dutch Health Research Council (ZON-MW, grant number 10-000-1001), and matching funds from participating pharmaceutical companies (Lundbeck, AstraZeneca, Eli Lilly, Janssen Cilag) and universities and mental healthcare organisations. Amsterdam: Academic Psychiatric Centre of the Academic Medical Center and the mental health institutions: GGZ Ingeest, Arkin, Dijk en Duin, GGZ Rivierduinen, Erasmus Medical Centre, GGZ Noord Holland Noord. Maastricht: Maastricht University Medical Centre and the mental health institutions: GGZ Eindhoven en de kempen, GGZ Breburg, GGZ Oost-Brabant, Vincent van Gogh voor Geestelijke Gezondheid, Mondriaan Zorggroep, Prins Clauscentrum Sittard, RIAGG Roermond, Universitair Centrum Sint-Jozef Kortenberg, CAPRI University of Antwerp, PC Ziekeren Sint-Truiden, PZ Sancta Maria Sint-Truiden, GGZ Overpelt, OPZ Rekem. Groningen: University Medical Center Groningen and the mental health institutions: Lentis, GGZ Friesland, GGZ Drenthe, Dimence, Mediant, GGNet Warnsveld, Yulius Dordrecht and Parnassia psycho-medical center (The Hague). Utrecht: University Medical Center Utrecht and the mental health institutions Altrecht, GGZ Centraal, Riagg Amersfoort and Delta.

The sample from Spain was collected at the Hospital Universitario Marqués de Valdecilla, University of Cantabria, Santander, Spain, under the following grant support: Carlos III Health Institute PI020499, PI050427, PI060507, Plan Nacional de Drugs Research Grant 2005- Orden sco/3246/2004, SENY Fundació Research Grant CI 2005-0308007 and Fundación Marqués de Valdecilla API07/011. The present data were obtained at the Hospital Marqués de Valdecilla, University of Cantabria, Santander, Spain, under the following grant support: MINECO Exp.: SAF2013-46292-R.

Acknowledgements

We would like to thank all the patients, relatives and controls who took part in this research, as well as the clinical staff who facilitated their involvement. We thank Tristan Clark and the UCL Computer Science Cluster team for their ongoing support. We wish to acknowledge Biobanco HUMV-IDIVAL for hosting and managing blood samples and IDIVAL Neuroimaging Unit for imaging acquirement and analysis. We wish to thank the PAFIP researchers who helped with data collection and the participants and their families for participating in the study.

Footnotes

*

Authors who are members of the PEIC and GROUP consortia are listed in the author box, with their affiliations in Supplementary Appendix 1. Collaborators who are members of WTCCC2 are listed in Supplementary Appendix 2.

Authors who are members of the Psychosis Endophenotypes International Consortium (PEIC): Maria J. Arranz, Steven Bakker, Stephan Bender, Elvira Bramon, Wiepke Cahn, David Collier, Benedicto Crespo-Facorro, Marta Di Forti, Jeremy Hall, Mei-Hua Hall, Conrad Iyegbe, Assen Jablensky, René S. Kahn, Luba Kalaydjieva, Eugenia Kravariti, Stephen M Lawrie, Cathryn M. Lewis, Kuang Lin, Don H. Linszen, Ignacio Mata, Colm McDonald, Andrew M McIntosh, Robin M. Murray, Roel A. Ophoff, Marco Picchioni, John Powell, Dan Rujescu, Timothea Toulopoulou, Jim Van Os, Muriel Walshe, Matthias Weisbrod and Durk Wiersma. Authors who are members of the Genetic Risk and Outcome of Psychosis (GROUP) Consortium: Richard Bruggeman, Wiepke Cahn, Lieuwe de Haan, René S. Kahn, Carin Meijer, Inez Myin-Germeys, Jim van Os and Agna A. Bartels-Velthuis. Full affiliations for the members of PEIC and GROUP are available in Supplementary Appendix 1. Collaborators who are members of the WTCCC2 are listed together with their affiliations in Supplementary Appendix 2.

References

1Bogren, M, Mattisson, C, Isberg, PE, Nettelbladt, P. How common are psychotic and bipolar disorders? A 50-year follow-up of the Lundby population. Nord J Psychiatry 2009; 63: 336–46.Google Scholar
2Iyegbe, C, Campbell, D, Butler, A, Ajnakina, O, Sham, P. The emerging molecular architecture of schizophrenia, polygenic risk scores and the clinical implications for GxE research. Soc Psychiatry Psychiatr Epidemiol 2014; 49: 169–82.Google Scholar
3Gratten, J, Wray, NR, Keller, MC, Visscher, PM. Large-scale genomics unveils the genetic architecture of psychiatric disorders. Nat Neurosci 2014; 17: 782–90.Google Scholar
4Schizophrenia Working Group of the Psychiatric Genomics Consortium. Biological insights from 108 schizophrenia-associated genetic loci. Nature 2014; 511: 421–7.Google Scholar
5Sklar, P, Ripke, S, Scott, L, Andreassen, O, Cichon, S. Large-scale genome-wide association analysis of bipolar disorder identifies a new susceptibility locus near ODZ4. Nat Genet 2011; 43: 977–83.Google Scholar
6Lichtenstein, P, Yip, BH, Björk, C, Pawitan, Y, Cannon, TD, Sullivan, PF, et al. Common genetic determinants of schizophrenia and bipolar disorder in Swedish families: a population-based study. Lancet 2009; 373: 234–9.Google Scholar
7Ruderfer, DM, Fanous, AH, Ripke, S, McQuillin, A, Amdur, RL, Gejman, PV, et al. Polygenic dissection of diagnosis and clinical dimensions of bipolar disorder and schizophrenia. Mol Psychiatry 2014; 19: 1017–24.Google Scholar
8Purcell, SM, Wray, NR, Stone, JL, Visscher, PM, O'Donovan, MC, Sullivan, PF, et al. Common polygenic variation contributes to risk of schizophrenia and bipolar disorder. Nature 2009; 460: 748–52.Google Scholar
9Bramon, E, Pirinen, M, Strange, A, Lin, K, Freeman, C, Bellenguez, C, et al. A genome-wide association analysis of a broad psychosis phenotype identifies three loci for further investigation. Biol Psychiatry 2014; 75: 386–97.Google Scholar
10Neale, BM, Sklar, P. Genetic analysis of schizophrenia and bipolar disorder reveals polygenicity but also suggests new directions for molecular interrogation. Curr Opin Neurobiol 2015; 30: 131–8.Google Scholar
11Cardno, AG, Owen, MJ. Genetic relationships between schizophrenia, bipolar disorder, and schizoaffective disorder. Schizophr Bull 2014; 40: 504–15.Google Scholar
12Harrison, PJ. Recent genetic findings in schizophrenia and their therapeutic relevance. J Psychopharmacol 2015; 29: 8596.Google Scholar
13Geschwind, DH, Flint, J. Genetics and genomics of psychiatric disease. Science 2015; 349: 1489–94.Google Scholar
14Cross-Disorder Group of the Psychiatric Genomics Consortium. Identification of risk loci with shared effects on five major psychiatric disorders: a genome-wide analysis. Lancet 2013; 381: 1371–9.Google Scholar
15Derks, EM, Vorstman, JAS, Ripke, S, Kahn, RS, Ophoff, RA. Investigation of the genetic association between quantitative measures of psychosis and schizophrenia: a polygenic risk score analysis. PLoS One 2012; 7: e37852.Google Scholar
16Yu, D, Mathews, CA, Scharf, JM, Neale, BM, Davis, LK, Gamazon, ER, et al. Cross-disorder genome-wide analyses suggest a complex genetic relationship between Tourette's syndrome and OCD. Am J Psychiatry 2015; 172: 8293.Google Scholar
17Wray, NR, Lee, SH, Mehta, D, Vinkhuyzen, AAE, Dudbridge, F, Middeldorp, CM. Research review: polygenic methods and their application to psychiatric traits. J Child Psychol Psychiatry 2014; 55: 1068–87.Google Scholar
18Dudbridge, F. Power and predictive accuracy of polygenic risk scores. PLoS Genet 2013; 9: e1003348.Google Scholar
19Wray, NR, Visscher, PM. Narrowing the boundaries of the genetic architecture of schizophrenia. Schizophr Bull 2010; 36: 1423.Google Scholar
20Vassos, E, Di Forti, M, Coleman, J, Iyegbe, C, Prata, D, Euesden, J, et al. An examination of polygenic score risk prediction in individuals with first episode psychosis. Biol Psychiatry 2017; 81: 470–7.Google Scholar
21Ripke, S, O'Dushlaine, C, Chambert, K, Moran, JL, Kähler, AK, Akterin, S, et al. Genome-wide association analysis identifies 13 new risk loci for schizophrenia. Nat Genet 2013; 45: 1150–9.Google Scholar
22American Psychiatric Association. Diagnostic and Statistical Manual of Mental Disorders (4th edn) (DSM-IV). American Psychiatric Association, 2000.Google Scholar
23Wing, JK, Babor, T, Brugha, T, Burke, J, Cooper, JE, Giel, R, et al. SCAN. Schedules for Clinical Assessment in Neuropsychiatry. Arch Gen Psychiatry 1990; 47: 589–93.Google Scholar
24Endicott, J, Spitzer, RL. A diagnostic interview: the schedule for affective disorders and schizophrenia. Arch Gen Psychiatry 1978; 35: 837–44.Google Scholar
25Spitzer, RL, Williams, JB, Gibbon, M, First, MB. The structured clinical interview for DSM-III-R (SCID). I: history, rationale, and description. Arch Gen Psychiatry 1992; 49: 624–9.Google Scholar
26Patterson, N, Price, AL, Reich, D. Population structure and eigenanalysis. PLoS Genet 2006; 2: 2074–93.Google Scholar
27Price, AL, Patterson, NJ, Plenge, RM, Weinblatt, ME, Shadick, NA, Reich, D. Principal components analysis corrects for stratification in genome-wide association studies. Nat Genet 2006; 38: 904–9.Google Scholar
28Euesden, J, Lewis, CM, O'Reilly, PF. PRSice: polygenic Risk Score software. Bioinformatics 2014; 31: 1466–8.Google Scholar
29Evans, DM, Visscher, PM, Wray, NR. Harnessing the information contained within genome-wide association studies to improve individual prediction of complex disease risk. Hum Mol Genet 2009; 18: 3525–31.Google Scholar
30Robin, X, Turck, N, Hainard, A, Tiberti, N, Lisacek, F, Sanchez, J-C, et al. pROC: an open-source package for R and S+ to analyze and compare ROC curves. BMC Bioinformatics 2011; 12: 77.Google Scholar
31Kendler, KS, Walsh, D. Schizophreniform disorder, delusional disorder and psychotic disorder not otherwise specified: clinical features, outcome and familial psychopathology. Acta Psychiatr Scand 1995; 91: 370–8.Google Scholar
32Ivleva, EI, Morris, DW, Moates, AF, Suppes, T, Thaker, GK, Tamminga, CA. Genetics and intermediate phenotypes of the schizophrenia-bipolar disorder boundary. Neurosci Biobehav Rev 2010; 34: 897921.Google Scholar
33Allardyce, J, Leonenko, G, Hamshere, M, Pardiñas, AF, Forty, L, Knott, S, et al. Association between schizophrenia-related polygenic liability and the occurrence and level of mood-incongruent psychotic symptoms in bipolar disorder. JAMA Psychiatry 2018; 75: 2835.Google Scholar
34Doherty, JL, Owen, MJ. Genomic insights into the overlap between psychiatric disorders: implications for research and clinical practice. Genome Med 2014; 6: 29.Google Scholar
35Bigdeli, TB, Ripke, S, Bacanu, SA, Lee, SH, Wray, NR, Gejman, PV, et al. Genome-wide association study reveals greater polygenic loading for schizophrenia in cases with a family history of illness. Am J Med Genet Part B Neuropsychiatr Genet 2016; 171: 276–89.Google Scholar
36Bigdeli, TB, Bacanu, S-A, Webb, BT, Walsh, D, O'Neill, FA, Fanous, AH, et al. Molecular validation of the schizophrenia spectrum. Schizophr Bull 2014; 40: 60–5.Google Scholar
37Zou, KH, O'Malley, AJ, Mauri, L. Receiver-operating characteristic analysis for evaluating diagnostic tests and predictive models. Circulation 2007; 115: 654–7.Google Scholar
38Hajian-Tilaki, K. Receiver operating characteristic (ROC) curve analysis for medical diagnostic test evaluation. Casp J Intern Med 2013; 4: 627–35.Google Scholar
39Grzybowski, M, Younger, JG. Statistical methodology: III. Receiver operating characteristic (ROC) curves. Acad Emerg Med 1997; 4: 818–26.Google Scholar
40Swets, JA. Measuring the accuracy of diagnostic systems. Science 1988; 240: 1285–93.Google Scholar
41Cook, NR. Statistical evaluation of prognostic versus diagnostic models: beyond the ROC curve. Clin Chem 2008; 54: 1723.Google Scholar
42Harrison, SL, Ding, J, Tang, EYH, Siervo, M, Robinson, L, Jagger, C, et al. Cardiovascular disease risk models and longitudinal changes in cognition: a systematic review. PLoS One 2014; 9: e.0114431.Google Scholar
43Purcell, SM, Moran, JL, Fromer, M, Ruderfer, D, Solovieff, N, Roussos, P, et al. A polygenic burden of rare disruptive mutations in schizophrenia. Nature 2014; 506: 185–90.Google Scholar
44Piepoli, MF, Hoes, AW, Agewall, S, Albus, C, Brotons, C, Catapano, AL, et al. 2016 European guidelines on cardiovascular disease prevention in clinical practice. Eur Heart J 2016; 37: 2315–81.Google Scholar
45Mak, TSH, Kwan, JSH, Campbell, DD, Sham, PC. Local true discovery rate weighted polygenic scores using GWAS summary data. Behav Genet 2016; 46: 573–82.Google Scholar
46Kirkbride, JB. The emerging molecular architecture of schizophrenia, polygenic risk scores and the clinical implications for gXe research. Soc Psychiatry Psychiatr Epidemiol 2014; 49: 1531–4.Google Scholar
47Marconi, A, Di Forti, M, Lewis, CM, Murray, RM, Vassos, E. Meta-analysis of the association between the level of cannabis use and risk of psychosis. Schizophr Bull 2016; 42: 1262–9.Google Scholar
48Morgan, C, Charalambides, M, Hutchinson, G, Murray, RM. Migration, ethnicity, and psychosis: toward a sociodevelopmental model. Schizophr Bull 2010; 36: 655–64.Google Scholar
49van Os, J, Rutten, BP, Myin-Germeys, I, Delespaul, P, Viechtbauer, W, van Zelst, C et al. Identifying gene-environment interactions in schizophrenia: contemporary challenges for integrated, large-scale investigations. Schizophr Bull 2014; 40: 729–36.Google Scholar
50Agerbo, E, Sullivan, PF, Vilhjálmsson, BJ, Pedersen, CB, Mors, O, Børglum, AD, et al. Polygenic risk score, parental socioeconomic status, family history of psychiatric disorders, and the risk for schizophrenia: a Danish population-based study and meta-analysis. JAMA Psychiatry 2015; 72: 635–41.Google Scholar
51Mcgrath, JJ, Mortensen, PB, Visscher, PM, Wray, NR. Where GWAS and epidemiology meet: opportunities for the simultaneous study of genetic and environmental risk factors in schizophrenia. Schizophr Bull 2013; 39: 955–9.Google Scholar
52Tzeng, JY, Zhang, D, Pongpanich, M, Smith, C, McCarthy, MI, Sale, MM, et al. Studying gene and gene-environment effects of uncommon and common variants on continuous traits: a marker-set approach using gene-trait similarity regression. Am J Hum Genet 2011; 89: 277–88.Google Scholar
53Vinkhuyzen, AAE, Wray, NR. Novel directions for G × E analysis in psychiatry. Epidemiol Psychiatr Sci 2015; 24: 12–9.Google Scholar
Figure 0

Table 1 Demographics in the case participants, relatives and controls

Figure 1

Table 2 Comparison of schizophrenia and bipolar disorder polygenic risk scores between patients with psychotic disorders and controlsa

Figure 2

Fig. 1 Percentage of the variance in disease risk explained by the schizophrenia and the bipolar disorder polygenic risk scores (PRSs). The proportion of variance explained (calculated as Nagelkerke's pseudo-R2) was computed by comparison of the full model (either schizophrenia-based or bipolar disorder-based PRS plus covariates) to the reduced model (covariates only). As per standard procedures,4 (ten different P-value thresholds (PT) were used to select risk alleles used in the computation of PRSs. The variance explained at each P-value threshold (5 × 10−08, 1 × 10−06, 1 × 10−04, 1 × 10−03, 0.01, 0.05, 0.1, 0.2, 0.5 and 1) is shown. Significance testing results are available in Supplementary Table S6.

Figure 3

Table 3 Schizophrenia and bipolar disorder polygenic risk scores (PRSs) in the three diagnostic subgroups and in unaffected relatives v. controlsa

Figure 4

Fig. 2 Case and control distribution in the risk polygenic score (PRS) deciles. The Y-axis corresponds to the number of individuals in each PRS decile. The P-value threshold used to calculate PRS was PT = 0.05. Based on their PRS, samples were allocated to deciles (decile 1, lowest PRS; 10, highest PRS). The figure shows that especially for schizophrenia PRSs the effect is concentrated in the tails of the distribution (deciles 1–2 and 9–10). There is very little difference between the deciles 4–7 in the middle, as is expected from a normal distribution.

Figure 5

Fig. 3 Odds ratio for broadly defined psychosis by risk polygenic score (PRS). The threshold used for selecting risk alleles was P-value threshold (PT) = 0.05. Based on PRSs, samples were allocated to deciles (decile 1, lowest PRS; 10, highest PRS). A dummy variable was created to compare the central deciles 5 and 6, used as reference to the others. Odds ratio and 95% CI were estimated using logistic regression including ethnicity principal components and cohort indicator as covariates. The points represent the odds ratios. The bars represent the lower and upper CI of the odds ratios.

Supplementary material: File

Calafato et al. supplementary material

Calafato et al. supplementary material 1

Download Calafato et al. supplementary material(File)
File 340.5 KB
Submit a response

eLetters

No eLetters have been published for this article.