There is increasing pressure on mental health services to adopt assessment and outcome measures that can be used routinely in mental health settings (Department of Health, 2001). Measures need to be appropriate for specific patient populations but also be capable of ‘following the patient’ through the various tiers of mental health services. The Clinical Outcomes in Routine Evaluation - Outcome Measure (CORE-OM; Barkham et al, Reference Barkham, Evans and Margison1998, Reference Barkham, Margison and Leach2001; Reference Evans, Connell and BarkhamEvans et al, 2002) has become a widely used patient self-report measure across service settings delivering psychological treatments, together with a practitioner-completed component termed the CORE-Assessment (CORE-A; Reference Mellor-Clark, Barkham and ConnellMellor-Clark et al, 1999; Reference Mellor-Clark, Barkham, Feltham and HortonMellor-Clark & Barkham, 2000). However, there has been no test to compare the CORE-OM and CORE-A in assessing the severity of presenting problems in bona fide primary versus secondary care settings. Accordingly, first we investigate whether the CORE-OM and CORE-A are appropriate as assessment tools in both service settings, and then we identify whether they reflect differences between the two settings.
METHOD
The data
This study reports on data collected by 49 National Health Service (NHS) sites routinely using the CORE-OM to monitor patients at intake to their services. The data were anonymised and aggregated and are independent of data set out in a previous study reporting psychometric properties of the CORE-OM (Reference Evans, Connell and BarkhamEvans et al, 2002). In total, 32 sites were primary care based, providing counselling or psychology services within primary care groups or trusts. The remaining 17 sites were secondary care based and provided clinical psychology and psychotherapy services. The majority of referrals were from general practitioners, accounting for 93.3% of referrals to primary care sites and 64.5% to secondary care sites. Data (CORE-OM and/or CORE-A) were completed for 6610 primary care patients and 2311 secondary care patients in total.
Patient samples
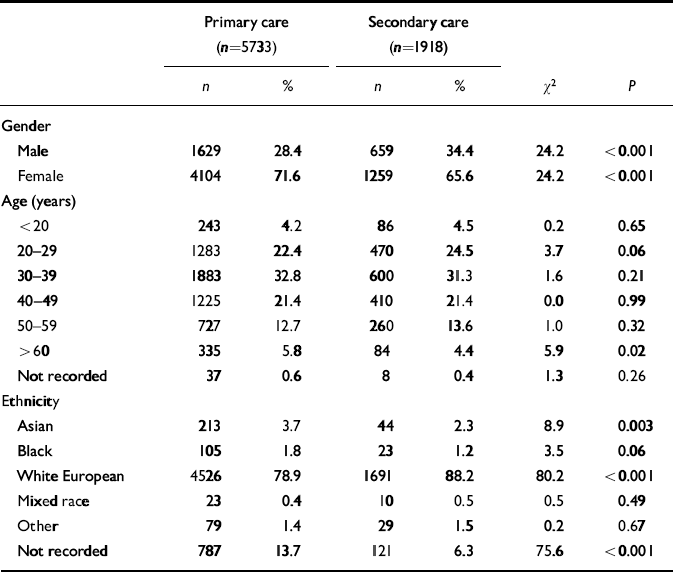
Patients not completing the CORE-OM or missing more than three items from the 34-item measure were excluded from the mean score calculations. Using these criteria, 5733 primary care patients and 1918 secondary care patients were selected for inclusion. Table 1 presents demographic information for the two patient samples.
Table 1 Patient sample demographics
| Primary care (n=5733) | Secondary care (n=1918) | |||||
|---|---|---|---|---|---|---|
| n | % | n | % | χ2 | P | |
| Gender | ||||||
| Male | 1629 | 28.4 | 659 | 34.4 | 24.2 | <0.001 |
| Female | 4104 | 71.6 | 1259 | 65.6 | 24.2 | <0.001 |
| Age (years) | ||||||
| <20 | 243 | 4.2 | 86 | 4.5 | 0.2 | 0.65 |
| 20–29 | 1283 | 22.4 | 470 | 24.5 | 3.7 | 0.06 |
| 30–39 | 1883 | 32.8 | 600 | 31.3 | 1.6 | 0.21 |
| 40–49 | 1225 | 21.4 | 410 | 21.4 | 0.0 | 0.99 |
| 50–59 | 727 | 12.7 | 260 | 13.6 | 1.0 | 0.32 |
| > 60 | 335 | 5.8 | 84 | 4.4 | 5.9 | 0.02 |
| Not recorded | 37 | 0.6 | 8 | 0.4 | 1.3 | 0.26 |
| Ethnicity | ||||||
| Asian | 213 | 3.7 | 44 | 2.3 | 8.9 | 0.003 |
| Black | 105 | 1.8 | 23 | 1.2 | 3.5 | 0.06 |
| White European | 4526 | 78.9 | 1691 | 88.2 | 80.2 | <0.001 |
| Mixed race | 23 | 0.4 | 10 | 0.5 | 0.5 | 0.49 |
| Other | 79 | 1.4 | 29 | 1.5 | 0.2 | 0.67 |
| Not recorded | 787 | 13.7 | 121 | 6.3 | 75.6 | <0.001 |
Measures
Patient-completed measure: CORE-OM
The CORE-OM comprises 34 items addressing domains of subjective well-being (4 items), symptoms (12 items), functioning (12 items) and risk (6 items; 4 ‘risk to self’ items and 2 ‘risk to others’ items). Within the symptom domain ‘item clusters’ address anxiety (4 items), depression (4 items), physical problems (2 items) and trauma (2 items). The functioning domain item clusters address general functioning (4 items), close relationships (4 items) and social relationships (4 items).
Items are scored on a five-point scale from 0 (‘not at all’) to 4 (‘all the time’). Half of the items focus on low-intensity problems (e.g. ‘I feel anxious/nervous’) and half focus on high-intensity problems (e.g. ‘I feel panic/terror’). Eight items are keyed positively.
All services in the study asked patients to complete the CORE-OM as a measure of distress at intake (i.e. before any intervention). In practice, the CORE-OM was completed during screening or assessment by 73.8% of primary care patients and 87.3% of secondary care patients, and completed at the first therapy session by the remaining 26.2% in primary care and 12.7% in secondary care.
Practitioner-completed measure: CORE-A
The CORE-A enables the collection of referral information, demographics, assessment, outcome, and data on presenting problem severity and duration. The CORE-A lists the following 14 problems: depression, anxiety, psychosis, personality problems, cognitive/learning difficulties, eating disorder, physical problems, addictions, trauma/abuse, bereavement, self-esteem, interpersonal problems, living/welfare and work/academic. At initial assessment, practitioners recorded the presence or absence of these problems and rated the severity of each presenting problem on a scale from 1’ (‘minimal’) to 4 (‘severe’). The duration of problems was recorded under four categories: <6 months, 6-12 months, >12 months or recurring/continuous.
Data analysis
All data were scanned optically using FOR-MIC software (Formic Design and Automatic Data Capture, 1996). Statistical analyses were carried out using the Statistical Package for the Social Sciences for Windows (version 11). The CORE-OM overall mean scores and non-risk scores were calculated using ‘pro-rating’, where up to three items were missed (i.e. if two items were not completed, the total score would be divided by 32 rather than 34). Domain mean scores were not ‘pro-rated’ if more than one item was missing from that domain.
Completion rates (n clients completing the CORE-OM) and missing items were analysed using the full data-set (n=6610 primary care and n=2311 secondary care). All subsequent analyses were carried out on the samples of patients completing the CORE-OM and fulfilling the criteria for pro-rating (n=5733 primary care and n=1918 secondary care).
Internal consistency of the CORE-OM was calculated using Cronbach's coefficient α (Reference CronbachCronbach, 1951). Statistical power was high due to the large sample sizes, therefore differences in mean scores between samples are reported using confidence intervals (Reference Gardner and AltmanGardner & Altman, 1986) and effect sizes (Reference CohenCohen, 1988) rather than significance tests. An ‘effect size’ represents a standard deviation unit and is calculated as the difference between means divided by the pooled standard deviation. The standard guide to the effect size differences denotes three bands: 0.2 (small) 0.5 (medium) and 0.8 (large). On the basis of Cohen (Reference Cohen1988), noting that a 0.2 effect size involved an 85% overlap between distributions, it has been suggested that an effect size of 0.4 (involving a 73% overlap) be used as the criterion for clinically meaningful differences (Reference Elliott, Stiles, Shapiro and GilesElliott et al, 1993). Chisquared analysis was used to test proportional differences between samples (e.g. demographic characteristics).
To facilitate comparisons regarding the range of severity, we applied two cut-offs to the CORE-OM data that reflected differing levels of severity (for details, see Reference Jacobson and TruaxJacobson & Truax, 1991). The first cut-off on the CORE-OM, termed ‘clinical’, was defined as a score of 1.19 for men and 1.29 for women and was derived from calculating the CORE-OM score that would best demarcate membership of the general population (i.e. a lower score) or a clinical population (i.e. a higher score) using the following formula (see Reference Evans, Connell and BarkhamEvans et al, 2002):
The second cut-off, termed ‘severe’, was a CORE-OM score of 2.50 (both men and women) that approximated to a score of 1 s.d. above the mean for a clinical population and differentiated a mild/moderate clinical population from a severe clinical population (see Reference Barkham, Margison and LeachBarkham et al, 2001). Odds ratio analysis was applied to estimate the caseness rate ratio using clinical cut-off points for the CORE-OM. Effect sizes and confidence intervals for proportions (Reference WilsonWilson, 1927) were calculated using Microsoft Excel 2000.
RESULTS
Acceptability
In order to assess whether the CORE-OM was acceptable to clients in both primary and secondary care settings, we examined completion rates (i.e. number of clients completing the CORE-OM) and missed items at intake assessment. Of the total, 5833 (88.3%) primary care patients and 1940 (84.0%) secondary care patients completed the CORE-OM. The completion rate was significantly higher for the primary care sample (χ2=28.2, P<0.001, 95% CI difference 2.7-6.0%). However, the proportion of completed measures with fewer than three items missing (i.e. within the criteria for pro-rating) was similar in both settings: 5733 (98.3%) in primary care and 1918 (98.9%) in secondary care (χ2=3.2, P=0.08, 95% CI – 1.0 to 0.1%).
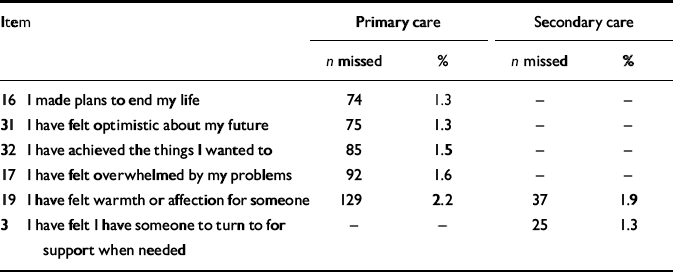
The most commonly missed item in both primary and secondary settings was no. 19 (‘I have felt warmth and affection for someone’). The overall item omission rates were 0.9% (95% CI 0.7-1.2%) for primary care and 0.8% (95% CI 0.5-1.3%) for secondary care. In the primary care sample, five items had missing cases above the upper threshold (1.2%) of the 95% confidence interval. In the secondary care sample, two items had missing cases above the threshold (1.3%). Table 2 summarises the items above the threshold in each sample.
Table 2 The CORE–Outcome Measure items above the 95% CI omission threshold1
| Item | Primary care | Secondary care | ||
|---|---|---|---|---|
| n missed | % | n missed | % | |
| 16 I made plans to end my life | 74 | 1.3 | - | - |
| 31 I have felt optimistic about my future | 75 | 1.3 | - | - |
| 32 I have achieved the things I wanted to | 85 | 1.5 | - | - |
| 17 I have felt overwhelmed by my problems | 92 | 1.6 | - | - |
| 19 I have felt warmth or affection for someone | 129 | 2.2 | 37 | 1.9 |
| 3 I have felt I have someone to turn to for support when needed | - | - | 25 | 1.3 |
Internal consistency
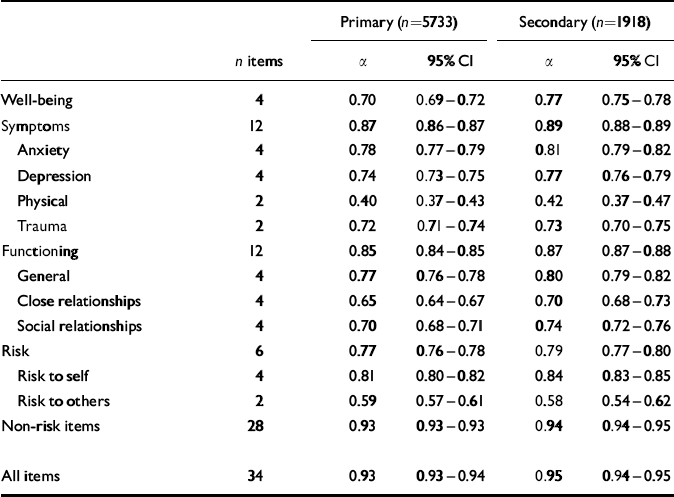
We used Cronbach's coefficient α to calculate the internal reliability of the CORE-OM domains and item clusters within domains for both primary and secondary care settings. Although the item clusters were originally selected to represent the range of patient experience and not intended to be used as sub-scales, we calculated α values for them in order to test the robustness of the components within each domain. The α value indicates the proportion of covariance between items. Table 3 illustrates that all domains showed good internal reliability, with α >0.70 and <0.97 in each setting. In both primary and secondary care, the well-being domain had the lowest internal consistency. Values of α exceeded 0.70 for six of the nine item clusters - anxiety, depression, trauma, general functioning, social relationships, and risk to self - whereas for close relationships α was 0.65-0.70. Only for physical problems and risk to others (both of which comprised just two items) was α<0.60.
Table 3 Internal consistency of CORE–Outcome Measure by service setting (Cronbach's α)
| Primary (n=5733) | Secondary (n=1918) | ||||
|---|---|---|---|---|---|
| n items | α | 95% CI | α | 95% CI | |
| Well-being | 4 | 0.70 | 0.69–0.72 | 0.77 | 0.75–0.78 |
| Symptoms | 12 | 0.87 | 0.86–0.87 | 0.89 | 0.88–0.89 |
| Anxiety | 4 | 0.78 | 0.77–0.79 | 0.81 | 0.79–0.82 |
| Depression | 4 | 0.74 | 0.73–0.75 | 0.77 | 0.76–0.79 |
| Physical | 2 | 0.40 | 0.37–0.43 | 0.42 | 0.37–0.47 |
| Trauma | 2 | 0.72 | 0.71–0.74 | 0.73 | 0.70–0.75 |
| Functioning | 12 | 0.85 | 0.84–0.85 | 0.87 | 0.87–0.88 |
| General | 4 | 0.77 | 0.76–0.78 | 0.80 | 0.79–0.82 |
| Close relationships | 4 | 0.65 | 0.64–0.67 | 0.70 | 0.68–0.73 |
| Social relationships | 4 | 0.70 | 0.68–0.71 | 0.74 | 0.72–0.76 |
| Risk | 6 | 0.77 | 0.76–0.78 | 0.79 | 0.77–0.80 |
| Risk to self | 4 | 0.81 | 0.80–0.82 | 0.84 | 0.83–0.85 |
| Risk to others | 2 | 0.59 | 0.57–0.61 | 0.58 | 0.54–0.62 |
| Non-risk items | 28 | 0.93 | 0.93–0.93 | 0.94 | 0.94–0.95 |
| All items | 34 | 0.93 | 0.93–0.94 | 0.95 | 0.94–0.95 |
The CORE-OM profile of severity of problems
Overall scores
To compare the overall CORE-OM scores in primary and secondary care settings, we generated notched boxplots and histograms presenting the distribution of CORE-OM mean scores for all items (see Figs 1 and 2). In terms of overall mean scores, the two settings showed a strikingly similar distribution. Figure 1 shows that there were four outliers in the primary care sample scoring above the maximum secondary care score of 3.65 and no patient in either setting scored 4. As illustrated in Fig. 2, the distributions are near symmetrical although different in total frequency as a result of the different n in each sample.
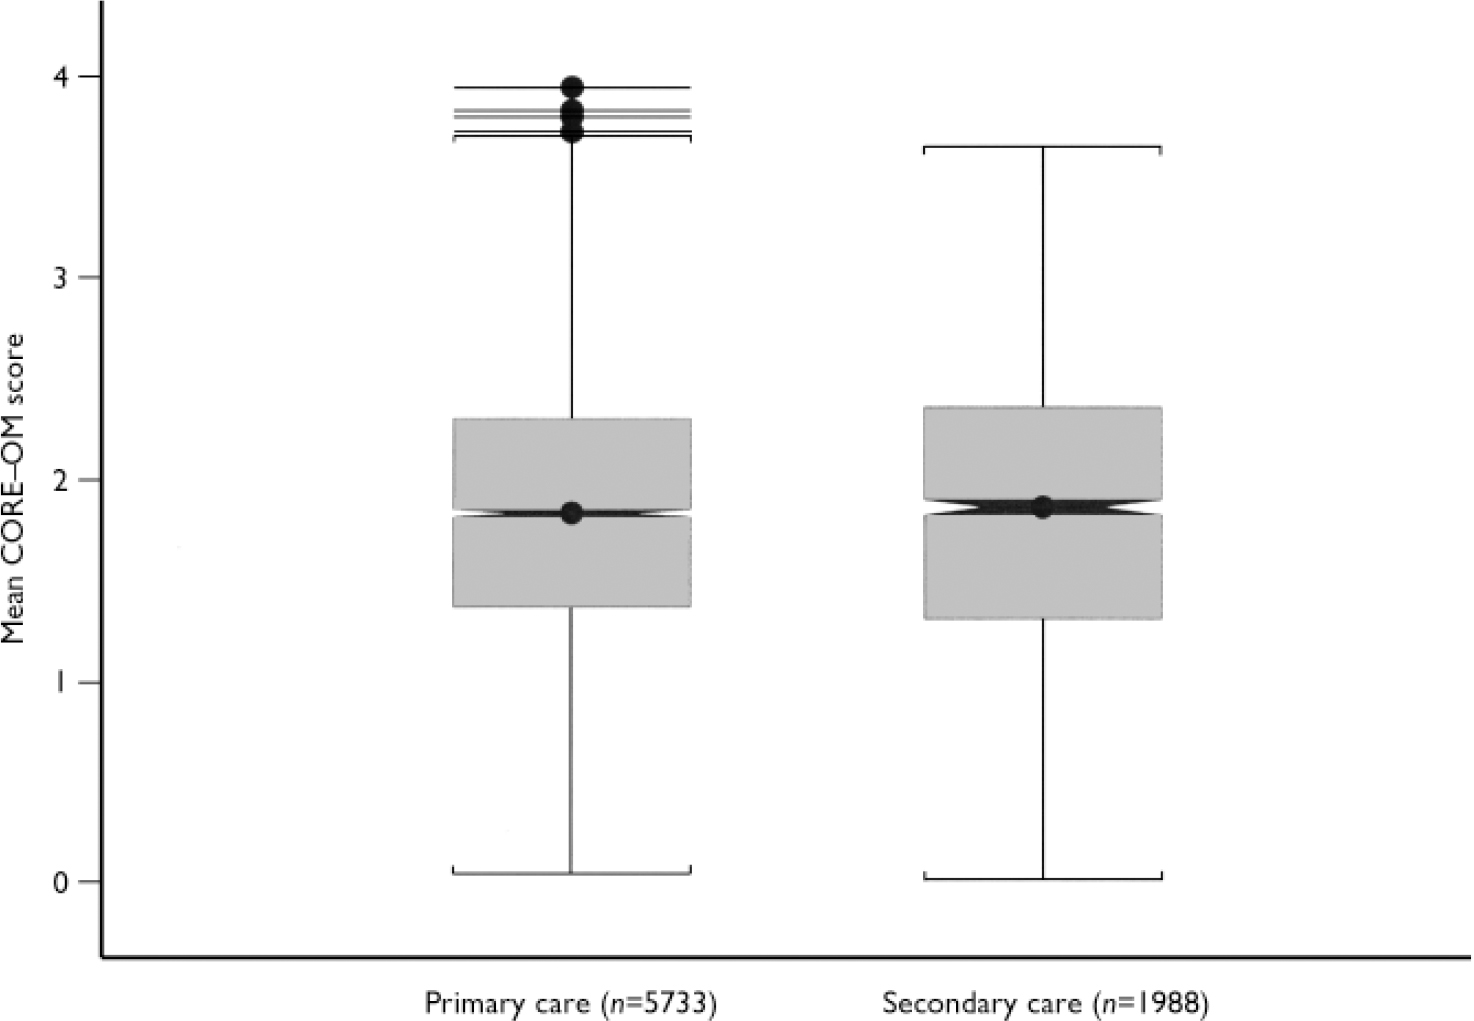
Fig. 1 The box encloses the interquartile range (i.e. the middle 50% of scores). The notch is centred around the sample median and the shading around the notch shows the 95% confidence interval. The whiskers extend to the minimum score below the box, and for the secondary care sample extend to the maximum score above the box. The primary care sample has four outliers (1.5-3 times the interquartile range above the 75 centile) shown above the whisker.
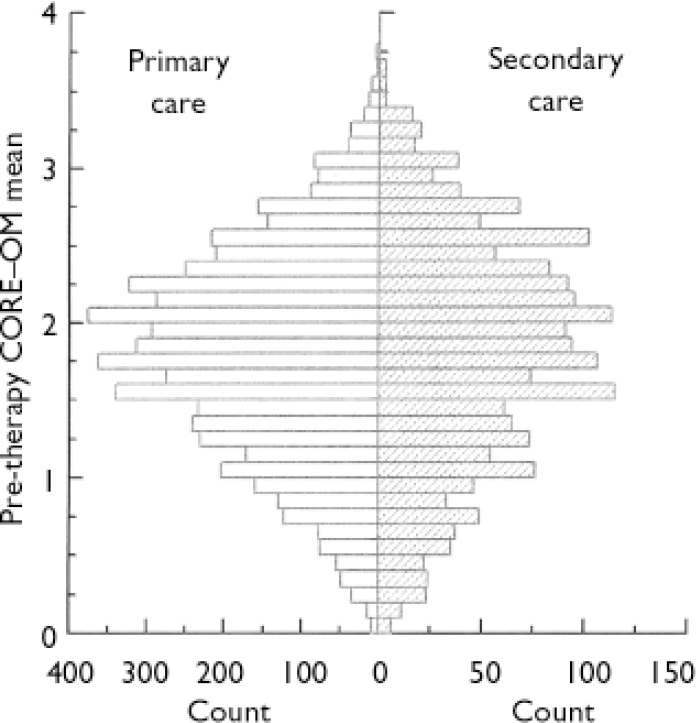
Fig. 2 The distributions for primary care and secondary care samples appear to the left and right, respectively, of the central y-axis.
Domain scores
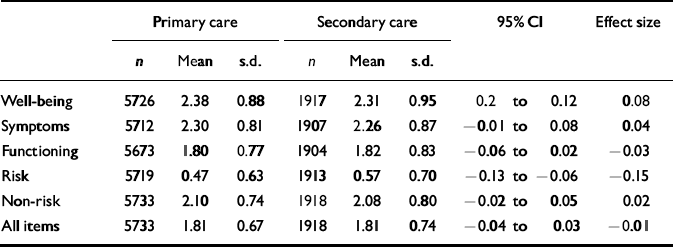
We calculated mean scores for each domain to determine whether patients in primary and secondary care settings showed a different profile of scores. Table 4 presents CORE-OM scores by domain for the two service settings, together with effect sizes indicating the degree of difference between populations. Although all effect size differences were ‘small’ (i.e. appreciably below 0.20), secondary patients did report higher levels of risk (effect size -0.15). The well-being domain showed the opposite trend, with primary care patients reporting poorer subjective well-being than secondary care patients (effect size 0.08).
Table 4 The CORE–Outcome Measure domain scores by service setting
| Primary care | Secondary care | 95% CI | Effect size | |||||
|---|---|---|---|---|---|---|---|---|
| n | Mean | s.d. | n | Mean | s.d. | |||
| Well-being | 5726 | 2.38 | 0.88 | 1917 | 2.31 | 0.95 | 0.2 to 0.12 | 0.08 |
| Symptoms | 5712 | 2.30 | 0.81 | 1907 | 2.26 | 0.87 | -0.01 to 0.08 | 0.04 |
| Functioning | 5673 | 1.80 | 0.77 | 1904 | 1.82 | 0.83 | -0.06 to 0.02 | -0.03 |
| Risk | 5719 | 0.47 | 0.63 | 1913 | 0.57 | 0.70 | -0.13 to -0.06 | -0.15 |
| Non-risk | 5733 | 2.10 | 0.74 | 1918 | 2.08 | 0.80 | -0.02 to 0.05 | 0.02 |
| All items | 5733 | 1.81 | 0.67 | 1918 | 1.81 | 0.74 | -0.04 to 0.03 | -0.01 |
Item scores
We analysed the mean scores for each of the 34 CORE-OM items across the two service settings to establish whether any items appeared to function differently in these patient groups. Comparison of the mean item scores using Cohen's effect size methodology indicated that secondary care patients scored higher than primary care patients on all four ‘risk to self’ items: item 9 ‘I have thought of hurting myself’ (effect size -0.14), item 16 ‘I have made plans to end my life’ (effect size -0.12), item 24 ‘I have thought it would be better if I were dead’ (effect size -0.14) and item 34 ‘I have hurt myself physically or taken dangerous risks with my health’ (effect size -0.15). There was no difference between primary and secondary care patients on the two ‘risk to others’ items: item 6 ‘I have been physically violent to others’ (effect size 0.00) and item 22 ‘I have threatened or intimidated another person’ (effect size -0.03). Primary care patients scored higher than secondary patients on item 14 ‘I have felt like crying’ (effect size 0.22) and item 18 ‘I have had difficulty getting to sleep or staying asleep’ (effect size 0.13).
Application of clinical cut offs
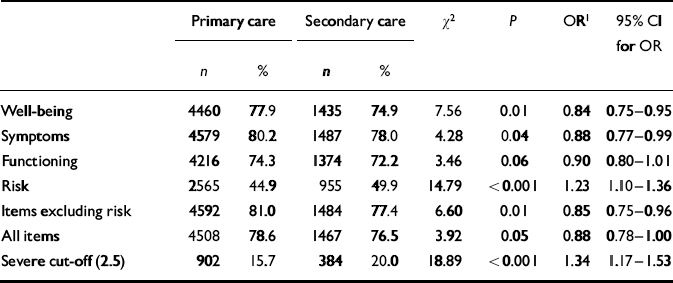
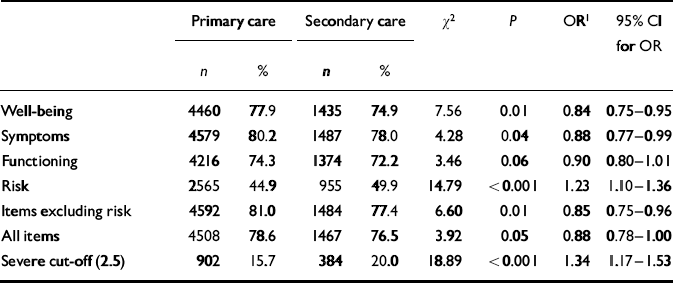
We applied the two cut-off thresholds to the data and Table 5 presents the proportion of patients in each setting above or equal to the cut-off thresholds. Chi-squared tests showed that a significantly higher proportion of primary care patients than secondary care patients were above the clinical cut-off for the well-being domain and non-risk items (P<0.01). However, as noted in the methodology, the statistical power of the data-set was high due to the large n, increasing the likelihood of statistical significance for small differences. Odds ratio (OR) analysis showed that secondary care patients were only marginally less likely to be above these cut-offs (OR=0.84 for well-being; OR=0.85 for non-risk items). Secondary care patients were more likely than primary care patients to be above the risk cut-off (OR=1.23, CI 1.10-1.36) and more likely to be above the ‘severe’ threshold (OR=1.34, CI 1.17-1.53).
Table 5 Proportion of patients above or equal to clinical cut-off thresholds
| Primary care | Secondary care | χ2 | P | OR1 | 95% CI for OR | |||
|---|---|---|---|---|---|---|---|---|
| n | % | n | % | |||||
| Well-being | 4460 | 77.9 | 1435 | 74.9 | 7.56 | 0.01 | 0.84 | 0.75–0.95 |
| Symptoms | 4579 | 80.2 | 1487 | 78.0 | 4.28 | 0.04 | 0.88 | 0.77–0.99 |
| Functioning | 4216 | 74.3 | 1374 | 72.2 | 3.46 | 0.06 | 0.90 | 0.80–1.01 |
| Risk | 2565 | 44.9 | 955 | 49.9 | 14.79 | <0.001 | 1.23 | 1.10–1.36 |
| Items excluding risk | 4592 | 81.0 | 1484 | 77.4 | 6.60 | 0.01 | 0.85 | 0.75–0.96 |
| All items | 4508 | 78.6 | 1467 | 76.5 | 3.92 | 0.05 | 0.88 | 0.78–1.00 |
| Severe cut-off (2.5) | 902 | 15.7 | 384 | 20.0 | 18.89 | <0.001 | 1.34 | 1.17–1.53 |
Patient-rated CORE-OM severity and presenting problems
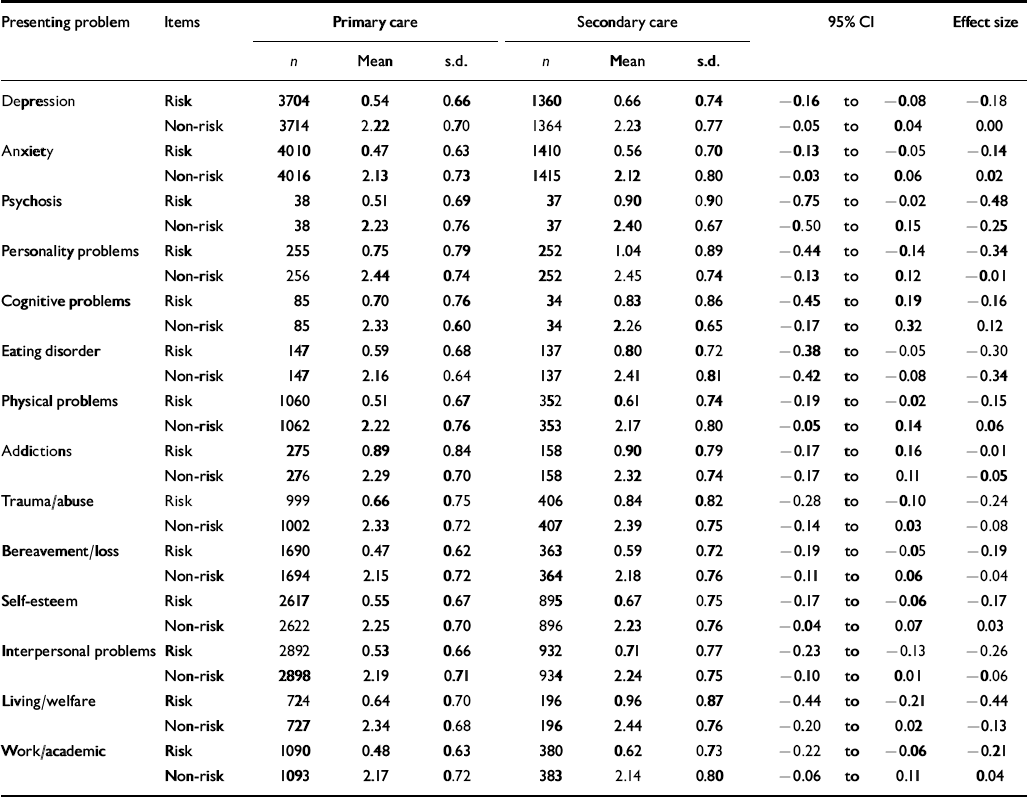
We used the practitioner rating provided on the CORE-A form to determine patients' presenting problems. We classified each problem as present if given any rating by the practitioner from 1 (‘minimal’) to 4 (‘severe’) and absent if no rating was given. Table 6 presents the mean CORE-OM scores for patients grouped by presenting problem. Groups were not independent because many patients were rated as presenting with more than one problem.
Table 6 The CORE–Outcome Measure risk and non-risk scores by presenting problem
| Presenting problem | Items | Primary care | Secondary care | 95% CI | Effect size | ||||
|---|---|---|---|---|---|---|---|---|---|
| n | Mean | s.d. | n | Mean | s.d. | ||||
| Depression | Risk | 3704 | 0.54 | 0.66 | 1360 | 0.66 | 0.74 | – 0.16 to –0.08 | – 0.18 |
| Non-risk | 3714 | 2.22 | 0.70 | 1364 | 2.23 | 0.77 | – 0.05 to 0.04 | 0.00 | |
| Anxiety | Risk | 4010 | 0.47 | 0.63 | 1410 | 0.56 | 0.70 | – 0.13 to –0.05 | – 0.14 |
| Non-risk | 4016 | 2.13 | 0.73 | 1415 | 2.12 | 0.80 | – 0.03 to 0.06 | 0.02 | |
| Psychosis | Risk | 38 | 0.51 | 0.69 | 37 | 0.90 | 0.90 | – 0.75 to –0.02 | – 0.48 |
| Non-risk | 38 | 2.23 | 0.76 | 37 | 2.40 | 0.67 | – 0.50 to 0.15 | – 0.25 | |
| Personality problems | Risk | 255 | 0.75 | 0.79 | 252 | 1.04 | 0.89 | – 0.44 to –0.14 | – 0.34 |
| Non-risk | 256 | 2.44 | 0.74 | 252 | 2.45 | 0.74 | – 0.13 to 0.12 | – 0.01 | |
| Cognitive problems | Risk | 85 | 0.70 | 0.76 | 34 | 0.83 | 0.86 | – 0.45 to 0.19 | – 0.16 |
| Non-risk | 85 | 2.33 | 0.60 | 34 | 2.26 | 0.65 | – 0.17 to 0.32 | 0.12 | |
| Eating disorder | Risk | 147 | 0.59 | 0.68 | 137 | 0.80 | 0.72 | – 0.38 to –0.05 | – 0.30 |
| Non-risk | 147 | 2.16 | 0.64 | 137 | 2.41 | 0.81 | – 0.42 to –0.08 | – 0.34 | |
| Physical problems | Risk | 1060 | 0.51 | 0.67 | 352 | 0.61 | 0.74 | – 0.19 to –0.02 | – 0.15 |
| Non-risk | 1062 | 2.22 | 0.76 | 353 | 2.17 | 0.80 | – 0.05 to 0.14 | 0.06 | |
| Addictions | Risk | 275 | 0.89 | 0.84 | 158 | 0.90 | 0.79 | – 0.17 to 0.16 | – 0.01 |
| Non-risk | 276 | 2.29 | 0.70 | 158 | 2.32 | 0.74 | – 0.17 to 0.11 | – 0.05 | |
| Trauma/abuse | Risk | 999 | 0.66 | 0.75 | 406 | 0.84 | 0.82 | – 0.28 to –0.10 | – 0.24 |
| Non-risk | 1002 | 2.33 | 0.72 | 407 | 2.39 | 0.75 | – 0.14 to 0.03 | – 0.08 | |
| Bereavement/loss | Risk | 1690 | 0.47 | 0.62 | 363 | 0.59 | 0.72 | – 0.19 to –0.05 | – 0.19 |
| Non-risk | 1694 | 2.15 | 0.72 | 364 | 2.18 | 0.76 | – 0.11 to 0.06 | – 0.04 | |
| Self-esteem | Risk | 2617 | 0.55 | 0.67 | 895 | 0.67 | 0.75 | – 0.17 to –0.06 | – 0.17 |
| Non-risk | 2622 | 2.25 | 0.70 | 896 | 2.23 | 0.76 | – 0.04 to 0.07 | 0.03 | |
| Interpersonal problems | Risk | 2892 | 0.53 | 0.66 | 932 | 0.71 | 0.77 | – 0.23 to –0.13 | – 0.26 |
| Non-risk | 2898 | 2.19 | 0.71 | 934 | 2.24 | 0.75 | – 0.10 to 0.01 | – 0.06 | |
| Living/welfare | Risk | 724 | 0.64 | 0.70 | 196 | 0.96 | 0.87 | – 0.44 to –0.21 | – 0.44 |
| Non-risk | 727 | 2.34 | 0.68 | 196 | 2.44 | 0.76 | – 0.20 to 0.02 | – 0.13 | |
| Work/academic | Risk | 1090 | 0.48 | 0.63 | 380 | 0.62 | 0.73 | – 0.22 to –0.06 | – 0.21 |
| Non-risk | 1093 | 2.17 | 0.72 | 383 | 2.14 | 0.80 | – 0.06 to 0.11 | 0.04 | |
The effect size analysis in Table 6 shows that CORE-OM risk scores were a key factor in differentiating secondary care patients from primary care patients across the presenting problems. Secondary care patients had higher risk scores than primary care patients for all presenting problems, except addictions where both primary and secondary patients had relatively high mean risk scores. For patients with psychosis, personality problems and eating disorders (problems traditionally seen in specialist services), risk scores were substantially higher in secondary than in primary care (effect size >0.3). In addition, patients with psychosis, eating disorders and living/welfare problems also showed higher non-risk scores in secondary care than in primary care (i.e. higher levels of overall distress; effect size >0.1).
Practitioner-rated CORE-A profile of severity of presenting problems
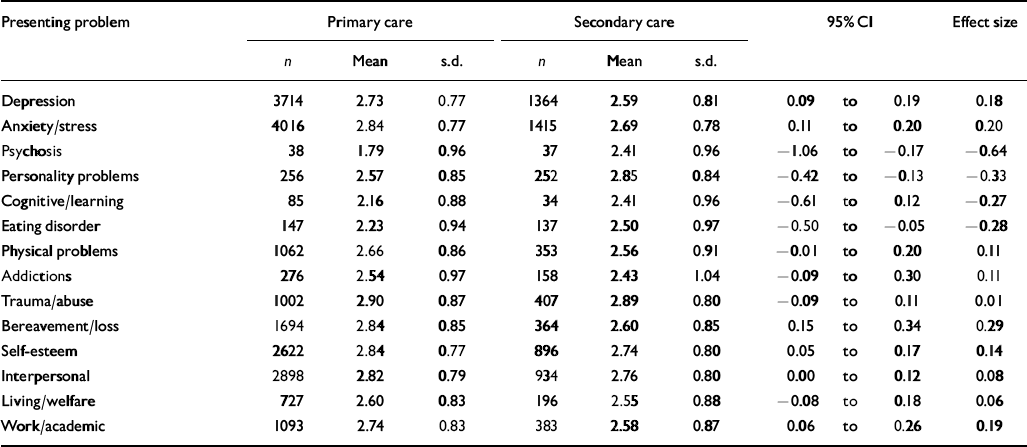
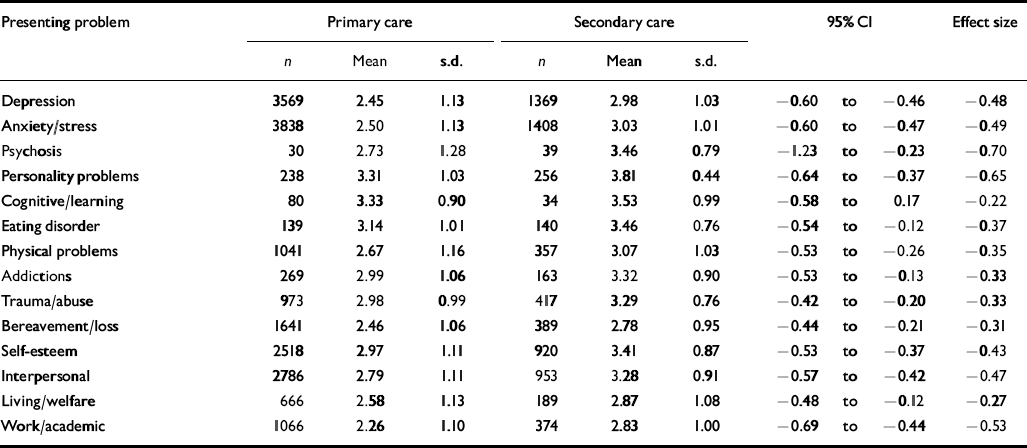
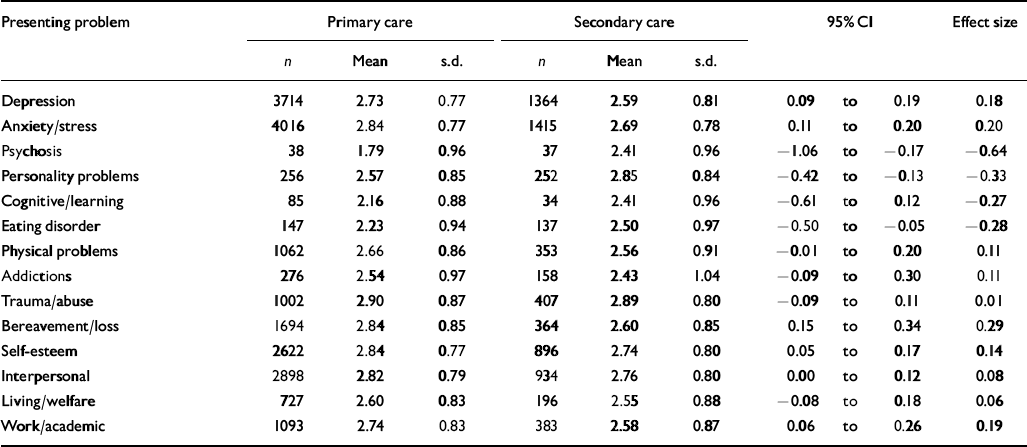
We used the CORE-A data to compare the practitioner-rated severity and duration of problems experienced in primary and secondary care settings. Table 7 presents the mean practitioner rating of the severity of the presenting problems. Effect size analysis in Table 7 shows that practitioners rated the severity of anxiety and bereavement higher in primary care than in secondary care settings (effect size >0.2), but the severity of personality problems, cognitive difficulties, eating disorder and physical problems was rated as higher in secondary care than in primary care settings (effect size >0.2). We were mindful that such differences could reflect differential anchor points in terms of perceptions of problems between practitioners from primary and secondary care settings. Accordingly, we sampled two ranges of CORE-OM scores - a lower range (CORE-OM range 1.00-1.60) and a higher range (CORE-OM range 2.20-2.80) - to check that there were no meaningful differences between primary and secondary care practitioners' ratings within these ranges. The mean effect size (low and high range) between primary and secondary care practitioners' ratings for each presenting problem fell below the 0.4 effect size criterion. Table 8 presents the mean rating of duration of the presenting problems in primary and secondary care settings. For all the presenting problems, secondary care patients were rated as having experienced the problem for a greater duration than primary care patients (all effect sizes >-0.2). The greatest difference in problem duration was for psychosis (effect size -0.7).
Table 7 Practitioner-rated CORE–Assessment profile of severity1 of presenting problems
| Presenting problem | Primary care | Secondary care | 95% CI | Effect size | ||||
|---|---|---|---|---|---|---|---|---|
| n | Mean | s.d. | n | Mean | s.d. | |||
| Depression | 3714 | 2.73 | 0.77 | 1364 | 2.59 | 0.81 | 0.09 to 0.19 | 0.18 |
| Anxiety/stress | 4016 | 2.84 | 0.77 | 1415 | 2.69 | 0.78 | 0.11 to 0.20 | 0.20 |
| Psychosis | 38 | 1.79 | 0.96 | 37 | 2.41 | 0.96 | – 1.06 to –0.17 | – 0.64 |
| Personality problems | 256 | 2.57 | 0.85 | 252 | 2.85 | 0.84 | – 0.42 to –0.13 | – 0.33 |
| Cognitive/learning | 85 | 2.16 | 0.88 | 34 | 2.41 | 0.96 | – 0.61 to 0.12 | – 0.27 |
| Eating disorder | 147 | 2.23 | 0.94 | 137 | 2.50 | 0.97 | – 0.50 to –0.05 | – 0.28 |
| Physical problems | 1062 | 2.66 | 0.86 | 353 | 2.56 | 0.91 | – 0.01 to 0.20 | 0.11 |
| Addictions | 276 | 2.54 | 0.97 | 158 | 2.43 | 1.04 | – 0.09 to 0.30 | 0.11 |
| Trauma/abuse | 1002 | 2.90 | 0.87 | 407 | 2.89 | 0.80 | – 0.09 to 0.11 | 0.01 |
| Bereavement/loss | 1694 | 2.84 | 0.85 | 364 | 2.60 | 0.85 | 0.15 to 0.34 | 0.29 |
| Self-esteem | 2622 | 2.84 | 0.77 | 896 | 2.74 | 0.80 | 0.05 to 0.17 | 0.14 |
| Interpersonal | 2898 | 2.82 | 0.79 | 934 | 2.76 | 0.80 | 0.00 to 0.12 | 0.08 |
| Living/welfare | 727 | 2.60 | 0.83 | 196 | 2.55 | 0.88 | – 0.08 to 0.18 | 0.06 |
| Work/academic | 1093 | 2.74 | 0.83 | 383 | 2.58 | 0.87 | 0.06 to 0.26 | 0.19 |
Table 8 Duration1 of presenting problems
| Presenting problem | Primary care | Secondary care | 95% CI | Effect size | ||||
|---|---|---|---|---|---|---|---|---|
| n | Mean | s.d. | n | Mean | s.d. | |||
| Depression | 3569 | 2.45 | 1.13 | 1369 | 2.98 | 1.03 | – 0.60 to –0.46 | – 0.48 |
| Anxiety/stress | 3838 | 2.50 | 1.13 | 1408 | 3.03 | 1.01 | – 0.60 to –0.47 | – 0.49 |
| Psychosis | 30 | 2.73 | 1.28 | 39 | 3.46 | 0.79 | – 1.23 to –0.23 | – 0.70 |
| Personality problems | 238 | 3.31 | 1.03 | 256 | 3.81 | 0.44 | – 0.64 to –0.37 | – 0.65 |
| Cognitive/learning | 80 | 3.33 | 0.90 | 34 | 3.53 | 0.99 | – 0.58 to 0.17 | – 0.22 |
| Eating disorder | 139 | 3.14 | 1.01 | 140 | 3.46 | 0.76 | – 0.54 to –0.12 | – 0.37 |
| Physical problems | 1041 | 2.67 | 1.16 | 357 | 3.07 | 1.03 | – 0.53 to –0.26 | – 0.35 |
| Addictions | 269 | 2.99 | 1.06 | 163 | 3.32 | 0.90 | – 0.53 to –0.13 | – 0.33 |
| Trauma/abuse | 973 | 2.98 | 0.99 | 417 | 3.29 | 0.76 | – 0.42 to –0.20 | – 0.33 |
| Bereavement/loss | 1641 | 2.46 | 1.06 | 389 | 2.78 | 0.95 | – 0.44 to –0.21 | – 0.31 |
| Self-esteem | 2518 | 2.97 | 1.11 | 920 | 3.41 | 0.87 | – 0.53 to –0.37 | – 0.43 |
| Interpersonal | 2786 | 2.79 | 1.11 | 953 | 3.28 | 0.91 | – 0.57 to –0.42 | – 0.47 |
| Living/welfare | 666 | 2.58 | 1.13 | 189 | 2.87 | 1.08 | – 0.48 to –0.12 | – 0.27 |
| Work/academic | 1066 | 2.26 | 1.10 | 374 | 2.83 | 1.00 | – 0.69 to –0.44 | – 0.53 |
DISCUSSION
The purpose of this article was to investigate the suitability and utility of the CORE-OM and CORE-A for assessing the severity of the presenting problems in primary and secondary care-based psychological therapy services.
Suitability
In relation to the appropriateness of these tools in different service settings, the findings show that CORE-OM is acceptable to clients in both settings (as evidenced by high completion rates) and is robust in its structure across different settings (as evidenced by high internal reliabilities), even to the extent of most of the item clusters. However, it is acknowledged that this evidence pertains to counselling and psychological therapy services and could differ in other service settings. In addition, a minority of patients completed their measures at their first session rather than at screening or intake assessment. However, the realities of routine practice settings probably demand reasonable flexibility in the pursuit of maximising compliance in completing the assessment measures.
In administering the same measure in both primary and secondary settings, it might be presumed that the CORE-OM would generate a ceiling effect in secondary care services. We found no evidence of this in the data that we examined. However, we distinguish clearly between patients seen in out-patient settings within secondary care services (as reported here) and patients deemed to be within a category that has been referred to as ‘serious and enduring mental illness’. For such patients, the process of understanding and completing a self-report measure might yield results that are not necessarily continuous with those reported here (e.g. they might underscore rather than produce logically higher scores). However, Whewell & Bonanno (Reference Whewell and Bonanno2000) reported that the risk sub-scale was ‘clinically valid’ in the CORE-A and CORE-OM scores matched for patients with borderline personality disorder. Where CORE-OM scores might not be considered safe, the CORE-A form completed by the practitioner would be the sole source of information.
Utility
Although we found general heterogeneity between primary and secondary care settings in self-rating on the CORE-OM, there was clear evidence that the CORE-OM discriminated between patients in secondary and primary care by showing them to be more likely to score higher on risk and be above the severe threshold. These two components support the ability of the CORE-OM to discriminate appropriately between service settings, a finding supported by the practitioners' consistent reporting of greater duration of patients' presenting problems in secondary care. These findings may provide an additional tool in the recognition by healthcare professionals of those patients potentially at risk of suicide (e.g. Reference Gunnell and HarbordGunnell & Harbord, 2003).
Our data showed primary care patients to be characterised by more acute problems (i.e. problems that received a lower duration rating). The self-severity rating may be related to the acute nature of the problems. Item analysis showed this with higher ratings on the item ‘felt like crying’, which is likely to reflect the immediacy of the problems experienced. In contrast, secondary care patients were characterised by more chronic problems (i.e. of higher duration) and higher risk scores on the CORE-OM. This agrees with the therapist-rated chronicity of problems in practice settings of counselling and clinical psychology (Reference Cape and ParhamCape & Parham, 2001). This profile of patients in secondary services appears to be a logical consequence of referral procedures and waiting times. However, we are mindful that practitioners in primary and secondary care settings may have differential anchor points in their evaluation of the severity of the presenting problems. When we controlled for patient-rated severity, we still found at least a 75% overlap in the distributions of primary- and secondary-based practitioners' ratings. Notwithstanding this overlap, our view on this is that practitioner ratings will be influenced by a myriad of professional and contextual factors that will require further research to ensure standard use in routine settings.
The use of both patient- and practitioner-completed assessment forms marks a step forward from reliance on either patient perception alone or established assessment packages using practitioner ratings alone (e.g. Health of the Nation Outcome Scales; Reference Wing, Beevor and CurtisWing et al, 1998). The use of such data provides a logical base for benchmarking service delivery systems (e.g. Reference Barkham, Margison and LeachBarkham et al, 2001) and adds to a developing literature (e.g. Reference Slade, Cahill and KelseySlade et al, 2001) providing low-cost but reliable measures that can be adopted routinely in mental health settings.
Clinical Implications and Limitations
CLINICAL IMPLICATIONS
-
▪ The CORE-Outcome Measure (CORE-OM) is suitable for assessing patient-rated severity across both primary and secondary care settings.
-
▪ The combined use of the CORE-OM and CORE-Assessment (CORE-A) enables comparison of the severity of individual presenting problems.
-
▪ There is a high level of reported risk in both primary and secondary care settings (albeit that the threshold was set low). However, risk assessment should be a key component of screening for referral of patients across primary and secondary care.
LIMITATIONS
-
▪ Services contributing to the national data-set may not be representative of all mental health services in the UK.
-
▪ The CORE-OM measures were completed at different stages of assessment (i.e. not always pre-intervention), therefore patients' self-rating in some cases may be affected by engaging with treatment.
-
▪ The CORE-A problem severity rating is subjective, therefore practitioners in primary and secondary care settings may rate severity differently. Further work is needed to assess the convergent validity of self- and practitioner-ratings of severity using the CORE-OM and CORE-A.
Acknowledgements
Authors affiliated to the Psychological Therapies Research Centre were. funded by the Priorities and Needs R&D Levy via Leeds Community Mental. Health Trust.





eLetters
No eLetters have been published for this article.