The personality factor neuroticism is highly associated with mood in both normal and patient populations (Reference Hirschfeld, Klerman and LavoriHirschfeld et al, 1989; Reference Wilson and GulloneWilson & Gullone, 1999). Neuroticism significantly predicts the amount of negative mood induction in healthy volunteers (Reference Blackburn, Cameron and DearyBlackburn et al, 1990). However, the mechanism of the association between neuroticism and mood has rarely been tested. Personality traits and mood appear to have similar biological correlates (Reference RoyRoy, 1990). Acute tryptophan depletion has been shown to result in a lowering of mood in patients in remission from depression (Reference Delgado, Charney and PriceDelgado et al, 1990) and in those with a family history of affective disorder (Reference Benkelfat, Ellenbogen and DeanBenkelfat et al, 1994). Memory, attention and executive function are also affected by tryptophan depletion (Reference Park, Coull and McShanePark et al, 1994; Reference Schmitt, Jorissen and SobczakSchmitt et al, 2000). This study was designed to test whether the personality trait neuroticism is a predictive factor for mood and cognitive change following tryptophan depletion.
METHOD
Recruitment of study group
Participants were recruited from the Edinburgh universities; all spoke English as their first language and were over 18 years of age. They were asked to complete a questionnaire pack assessing mood and personality, which took about an hour to complete. Approximately 2000 questionnaires were distributed; 1032 were completed and returned.
Individuals were selected from this pool for the experimental tryptophan depletion stage using norms from the Eysenck Personality Questionnaire — Revised (EPQ—R; Reference Eysenck, Eysenck and BarrettEysenck et al, 1985). These norms were used because recruitment and selection were performed concurrently. Initially, those who scored either above the top 10% or below the bottom 10% EPQ neroticism scale population norms were selected. After 100 questionnaires had been scored this criterion was thought to be over-inclusive, and the cut-off was raised to the top and bottom fifth percentiles of EPQ neuroticism scores. Of the 181 individuals selected for the study, 149 did not complete the study protocol. A number dropped out because they no longer wished to take part (30 low-neuroticism scores, 50 high-neuroticism scorers). A physician interviewed volunteers about their personal medical and psychiatric histories and their first-degree relatives' psychiatric histories. The volunteers also underwent physical examination; those with any significant medical or psychiatric history were excluded, for instance, if they had had an episode of major depression, panic attacks, a head injury or diabetes (10 low-neuroticism scorers, 49 high-neuroticism scorers). Two high-neuroticism scorers fainted during blood sampling, and 2 low-neuroticism and 6 high-neuroticism scorers vomited after ingestion of the amino acid drink. Fifteen low-neuroticism scorers and 17 high-neuroticism scorers completed the study. Five volunteers had a first-degree relative with a history of depression (3 female high-neuroticism scorers, 1 male and 1 female low-neuroticism scorers).
Experimental procedure
The volunteers eventually selected to participate in this double-blind, crossover study were asked to follow a low-tryptophan diet from 14.00 h on the day prior to each testing session (day 1), followed by a second day on which an amino acid drink with tryptophan or without tryptophan was given (day 2), in pseudo-random order. The drink mixtures were supplied by the University of Newcastle. The researchers were blind to drink type until completion of the experiment. The test days were separated by at least 1 week. A light, low-tryptophan lunch was given on the day of the assessment approximately 120 min after ingestion of the drink (the meals were identical to those used by Reference Smith, Fairburn and CowenSmith et al, 1997). All women who took part were in the follicular phase of their menstrual cycle.
Before and after the amino acid drinks, assessments of mood and neuropsychological function were carried out and blood samples were taken. Volunteers were given £40 to cover their expenses. All participants were given the National Adult Reading Test (NART) on the morning of the first test day as an estimate of full-scale IQ (Reference NelsonNelson, 1982).
Mood measures
Assessments were made both prior to consumption of the drink (baseline measures) and 4-6h after consumption. These are described below. An adaptation of the Hamilton Rating Scale for Depression (HRSD; further details available from the author upon request), although strictly unsuitable for this population and the time-frame concerned, was used to give a point of comparison with the lowering of mood observed in other studies of tryptophan depletion in which the population was a psychiatric one (e.g. Reference Delgado, Charney and PriceDelgado et al, 1990; Reference Smith, Fairburn and CowenSmith et al, 1997).
The Profile of Mood States (POMS) is a self-rated mood scale (Reference McNair, Lorr and DropplemanMcNair et al, 1992) consisting of 65 words which participants are asked to rate on a Likert scale of 1-4 according to how they are feeling at that moment. Items can be divided into six dimensions, and the total score is calculated by summing the sub-scales. The Positive and Negative Affect Schedule (PANAS) is a self-report mood scale (Reference Watson and ClarkWatson & Clark, 1988) consisting of 10 words relating to positive affectivity and 10 words relating to negative affectivity on a Likert scale of 1-5. Participants were asked to rate how they were feeling currently.
Psychometric tests
Cognitive tests were administered in the afternoon only. The Digit—Symbol Substitution Test (DSST) is a time-limited test (90 s) that measures psychomotor speed and coding (Reference WechslerWechsler, 1981). Participants are presented with rows of digits ranging from 1 to 9 (a total of 93) and are asked to write a corresponding symbol. Digits forward (DIGF) and Digits backward (DIGB) are tests of concentration and working memory (Reference WechslerWechsler, 1981). The person tested is read a range of numbers (1-9 inclusive) and asked to repeat them to the experimenter either as heard (DIGF) or in reverse order (DIGB). The Verbal Fluency Test is a sensitive indicator of brain dysfunction (Reference Benton and HamsherBenton & Hamsher, 1978). The person tested is required to produce as many words as possible that begin with a particular letter, excluding proper nouns and the same word with a different suffix. Parallel versions using different letters of equal frequency were administered. The Paced Auditory Serial Addition Task (PASAT) is a test of working memory, attention and planning (Reference Gronwall and WrightsonGronwall & Wrightson, 1981). Three sets of 61 numbers between 1 and 9 inclusive are given at regular intervals of 2s. The person tested is asked to add each number in the sequence to the preceding one, and to give the answer to the tester. The Visual Change Detection Task is a speed of visual processing task that also tests attention and concentration (Reference Deary, McCrimmon and BradshawDeary et al, 1997). The person is asked to indicate which one of 50 dots that appear on a screen comes up at a slight delay compared with the other 49. The time interval of the delay was in six randomly presented blocks (14ms, 29ms, 43ms, 57ms, 71ms, 86ms), with 20 trials to each block. The correctness of each detection was assessed, not the time to react.
The amino acid drink
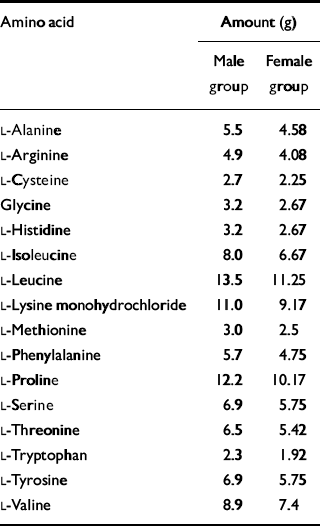
The amino acid drink was composed of 16 amino acids including tryptophan, which was omitted from the test formulations. The drink given to the women was 80% of the strength of that given to the men. The amino acid content is given in Table 1. The amino acids were suspended in water and flavoured with blackcurrant to make them more palatable. Volunteers consumed an extra-strong mint after ingestion of the drink to mask the unpleasant flavour. Before leaving the test room on day 2, volunteers were given a meal to raise their tryptophan levels before returning home.
Table 1 Composition of amino acid drink
| Amino acid | Amount (g) | |
|---|---|---|
| Male group | Female group | |
| L-Alanine | 5.5 | 4.58 |
| L-Arginine | 4.9 | 4.08 |
| L-Cysteine | 2.7 | 2.25 |
| Glycine | 3.2 | 2.67 |
| L-Histidine | 3.2 | 2.67 |
| L-Isoleucine | 8.0 | 6.67 |
| L-Leucine | 13.5 | 11.25 |
| L-Lysine monohydrochloride | 11.0 | 9.17 |
| L-Methionine | 3.0 | 2.5 |
| L-Phenylalanine | 5.7 | 4.75 |
| L-Proline | 12.2 | 10.17 |
| L-Serine | 6.9 | 5.75 |
| L-Threonine | 6.5 | 5.42 |
| L-Tryptophan | 2.3 | 1.92 |
| L-Tyrosine | 6.9 | 5.75 |
| L-Valine | 8.9 | 7.4 |
Blood tests
Total tryptophan and free tryptophan plasma levels were assessed prior to ingestion and 6h after ingestion of the drink. The blood samples were spun and stored on site at -20°C. Tryptophan levels were assessed by high-pressure liquid chromatography (Reference Marshall, Kennedy and EcclestonMarshall et al, 1987) at the University of Newcastle.
Statistical analysis
Parametric statistics were used if the data were normally distributed, had homogeneity of variance and were of at least interval level. Normality of the data was tested by inspection of frequency histograms and the skewness statistic. Homogeneity of variance was assumed if Levene's test for equality of variance was not statistically significant. The selected groups were compared on personality and mood measures using t-tests or Mann—Whitney U-tests. Tryptophan levels and mood were analysed using repeated measures analysis of variance; the within-subject variable was study day and the between-subject variable was neuroticism group. Neuro-psychological data were analysed by (2 by 2 by 2) repeated measures analysis of variance; the between-subject factors were neuroticism (high v. low scorer) and order of tests (scores on day 1 v. day 2), the within-subject factor was condition (placebo v. acute tryptophan depletion). Data on those with a family history of depression were analysed using Wilcoxon signed ranks. All results reported are two-tailed unless indicated otherwise. Significance was set at P <0.05.
RESULTS
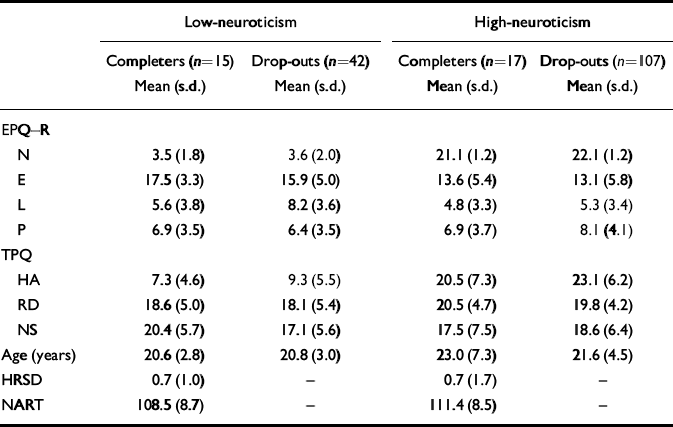
Thirty-two of the 181 people originally selected from questionnaire responses completed the two test days. Those who took part and those who dropped out were compared on personality scores (Table 2). There was no difference on any of the personality measures in the low-neuroticism scorers between those who took part and those who dropped out. The high-neuroticism scorers who dropped out had significantly higher neuroticism scores than those who took part (Mann—Whitney U-test, Z=2.95, n=123, P <0.005).
Table 2 High- and low-neuroticism scorers' personality, depression and NART-predicted IQ scores and age
| Low-neuroticism | High-neuroticism | |||
|---|---|---|---|---|
| Completers (n=15) | Drop-outs (n=42) | Completers (n=17) | Drop-outs (n=107) | |
| Mean (s.d.) | Mean (s.d.) | Mean (s.d.) | Mean (s.d.) | |
| EPQ—R | ||||
| N | 3.5 (1.8) | 3.6 (2.0) | 21.1 (1.2) | 22.1 (1.2) |
| E | 17.5 (3.3) | 15.9 (5.0) | 13.6 (5.4) | 13.1 (5.8) |
| L | 5.6 (3.8) | 8.2 (3.6) | 4.8 (3.3) | 5.3 (3.4) |
| P | 6.9 (3.5) | 6.4 (3.5) | 6.9 (3.7) | 8.1 (4.1) |
| TPQ | ||||
| HA | 7.3 (4.6) | 9.3 (5.5) | 20.5 (7.3) | 23.1 (6.2) |
| RD | 18.6 (5.0) | 18.1 (5.4) | 20.5 (4.7) | 19.8 (4.2) |
| NS | 20.4 (5.7) | 17.1 (5.6) | 17.5 (7.5) | 18.6 (6.4) |
| Age (years) | 20.6 (2.8) | 20.8 (3.0) | 23.0 (7.3) | 21.6 (4.5) |
| HRSD | 0.7 (1.0) | - | 0.7 (1.7) | - |
| NART | 108.5 (8.7) | - | 111.4 (8.5) | - |
The high-neuroticism and low-neuroticism groups who took part in the tryptophan depletion study were also compared on other personality and mood measures and on IQ, estimated by NART score (Table 2). They were matched on the EPQ lie scale, EPQ psychoticism, Tridimensional Personality Questionnaire (TPQ; Reference Cloninger, Przybeck and SvrakicCloninger et al, 1991) reward dependence and TPQ novelty-seeking. However, extraversion scores differed significantly between high-neuroticism and low-neuroticism scorers (Mann—Whitney U-test, Z=1.97, n=32, P=0.049), with the low-neuroticism scorers having higher extraversion scores. The two groups were matched on IQ (t=0.926, d.f.=30, P=0.36). There were five men in the low-neuroticism group and seven in the high-neuroticism group, and ten women in each group.
The effect of tryptophan depletion on biochemical measures
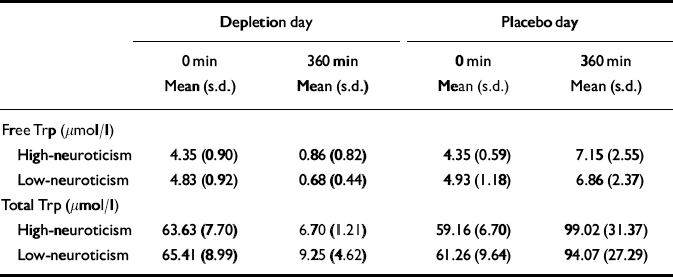
Blood could not be collected from three participants (1/15 low-neuroticism scorers and 2/17 high-neuroticism scorers) owing to excess discomfort or technical difficulties. Table 3 lists the means and standard deviations for total and free tryptophan plasma levels by neuroticism score.
Table 3 Plasma free and total tryptophan (Trp) levels by neuroticism at baseline and after an amino acid drink
| Depletion day | Placebo day | |||
|---|---|---|---|---|
| 0 min | 360 min | 0 min | 360 min | |
| Mean (s.d.) | Mean (s.d.) | Mean (s.d.) | Mean (s.d.) | |
| Free Trp (μmol/l) | ||||
| High-neuroticism | 4.35 (0.90) | 0.86 (0.82) | 4.35 (0.59) | 7.15 (2.55) |
| Low-neuroticism | 4.83 (0.92) | 0.68 (0.44) | 4.93 (1.18) | 6.86 (2.37) |
| Total Trp (μmol/l) | ||||
| High-neuroticism | 63.63 (7.70) | 6.70 (1.21) | 59.16 (6.70) | 99.02 (31.37) |
| Low-neuroticism | 65.41 (8.99) | 9.25 (4.62) | 61.26 (9.64) | 94.07 (27.29) |
For all the remaining participants, mean plasma free and total tryptophan (Trp) levels were not significantly different at baseline by study day (free Trp, F 1,27=0.374, P=0.79; total Trp, F 1,27=0.49, P=0.49). The high-neuroticism and low-neuroticism groups did not differ at baseline (free Trp, F 1,27=3.663, P=0.07; total Trp, F 1,27= 0.662, P=0.42). There was no significant interaction effect of neuroticism group and study day (free Trp, F 1,27=0.057, P=0.81; total Trp, F 1,27=0.43, P=0.52). The degree of change between morning and afternoon samples was computed by subtracting the morning concentration value from the afternoon concentration (i.e. tryptophan increases are positive).
After the low-tryptophan drink, both total and free mean plasma levels of tryptophan fell significantly (free Trp change, F 1,27= 176.187, P<0.001; total Trp change, F 1,27=304.111, P<0.001). Plasma free tryptophan was depleted by 83% and plasma total tryptophan by 88%. There was no significant effect of neuroticism group on tryptophan depletion levels (free Trp, F 1,27=2.116, P=0.157; total Trp, F 1,27=0.315, P= 0.579). There was no significant interaction effect of neuroticism and condition on tryptophan depletion levels (free Trp change, F 1,27=0.050, P=0.825; total Trp change, F 1,27=0.542, P=0.468). After the balanced amino acid drink, plasma free tryptophan levels were on average increased to 156% of the baseline values, plasma total tryptophan levels to 162%.
Mood measures
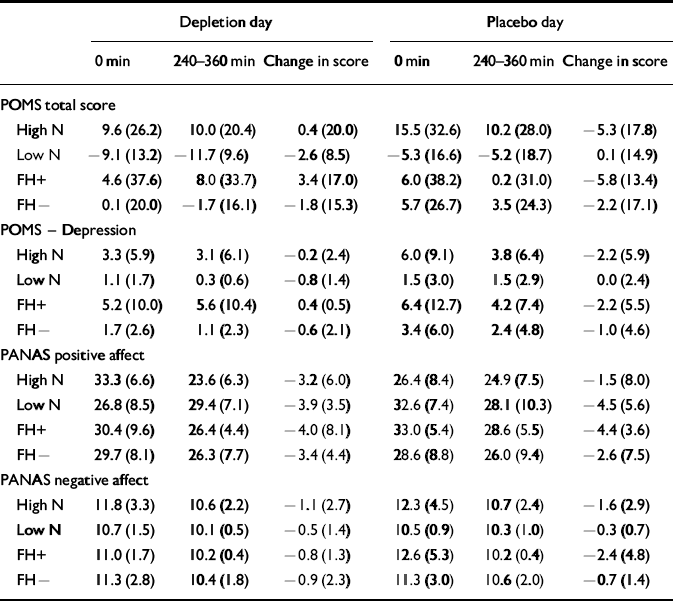
In order to compare the effect of the low-tryptophan drink with that of the placebo drink in the two groups, change scores were calculated by subtracting the morning score from the afternoon score. The change scores control for individual differences in baseline scores (Table 4). At baseline (before consumption of the amino acid drinks) there was no effect of neuroticism or study day between scores on the POMS depression scale (POMS—D) or on negative affectivity. However, at baseline there was a significant main effect of neuroticism on POMS total scores (F 1,30=5.92, P=0.02) and a significant effect of study day (F 1,30=4.26, P=0.048). Both neuroticism groups had higher scores on the morning of the placebo day compared with the depletion day, and the high-neuroticism scorers had higher scores than the low-neuroticism scorers on both days; the high-neuroticism scorers had more negative affect. At baseline there were group effects on positive affectivity of the PANAS, with the high-neuroticism scorers having less positive affect (F 1,30= 5.97, P=0.02) on both days (t=2.38, d.f.=30, P=0.02 and t=2.2, d.f.=30, P=0.04, respectively).
Table 4 The effect of the amino acid drink on mood scores (mean (s.d.))
| Depletion day | Placebo day | |||||
|---|---|---|---|---|---|---|
| 0 min | 240-360 min | Change in score | 0 min | 240-360 min | Change in score | |
| POMS total score | ||||||
| High N | 9.6 (26.2) | 10.0 (20.4) | 0.4 (20.0) | 15.5 (32.6) | 10.2 (28.0) | -5.3 (17.8) |
| Low N | -9.1 (13.2) | -11.7 (9.6) | -2.6 (8.5) | -5.3 (16.6) | -5.2 (18.7) | 0.1 (14.9) |
| FH+ | 4.6 (37.6) | 8.0 (33.7) | 3.4 (17.0) | 6.0 (38.2) | 0.2 (31.0) | -5.8 (13.4) |
| FH- | 0.1 (20.0) | -1.7 (16.1) | -1.8 (15.3) | 5.7 (26.7) | 3.5 (24.3) | -2.2 (17.1) |
| POMS - Depression | ||||||
| High N | 3.3 (5.9) | 3.1 (6.1) | -0.2 (2.4) | 6.0 (9.1) | 3.8 (6.4) | -2.2 (5.9) |
| Low N | 1.1 (1.7) | 0.3 (0.6) | -0.8 (1.4) | 1.5 (3.0) | 1.5 (2.9) | 0.0 (2.4) |
| FH+ | 5.2 (10.0) | 5.6 (10.4) | 0.4 (0.5) | 6.4 (12.7) | 4.2 (7.4) | -2.2 (5.5) |
| FH- | 1.7 (2.6) | 1.1 (2.3) | -0.6 (2.1) | 3.4 (6.0) | 2.4 (4.8) | -1.0 (4.6) |
| PANAS positive affect | ||||||
| High N | 33.3 (6.6) | 23.6 (6.3) | -3.2 (6.0) | 26.4 (8.4) | 24.9 (7.5) | -1.5 (8.0) |
| Low N | 26.8 (8.5) | 29.4 (7.1) | -3.9 (3.5) | 32.6 (7.4) | 28.1 (10.3) | -4.5 (5.6) |
| FH+ | 30.4 (9.6) | 26.4 (4.4) | -4.0 (8.1) | 33.0 (5.4) | 28.6 (5.5) | -4.4 (3.6) |
| FH- | 29.7 (8.1) | 26.3 (7.7) | -3.4 (4.4) | 28.6 (8.8) | 26.0 (9.4) | -2.6 (7.5) |
| PANAS negative affect | ||||||
| High N | 11.8 (3.3) | 10.6 (2.2) | -1.1 (2.7) | 12.3 (4.5) | 10.7 (2.4) | -1.6 (2.9) |
| Low N | 10.7 (1.5) | 10.1 (0.5) | -0.5 (1.4) | 10.5 (0.9) | 10.3 (1.0) | -0.3 (0.7) |
| FH+ | 11.0 (1.7) | 10.2 (0.4) | -0.8 (1.3) | 12.6 (5.3) | 10.2 (0.4) | -2.4 (4.8) |
| FH- | 11.3 (2.8) | 10.4 (1.8) | -0.9 (2.3) | 11.3 (3.0) | 10.6 (2.0) | -0.7 (1.4) |
Condition (acute tryptophan depletion v. placebo) had no significant effect on any of the mood scales — that is, there was no effect of tryptophan depletion on the mood scales (POMS—D, F 1,30=0.393, P=0.536, Cohen's f=0.10; positive affectivity, F 1,30= 0.200, P=0.658, Cohen's f=0.05; negative affectivity, F 1,30=0.058, P=0.811, Cohen's f<0.05). The neuroticism group by condition interaction was not significant for any of the mood scales (POMS—D, F 1,30=2.139, P=0.154, Cohen's f=0.25; positive affectivity, F 1,30=0.978, P=0.330, Cohen's f=0.18; negative affectivity, F 1,30=0.759, P=0.391, Cohen's f=0.05). Figure 1 illustrates the change in scores on the POMS—D sub-scale by group.
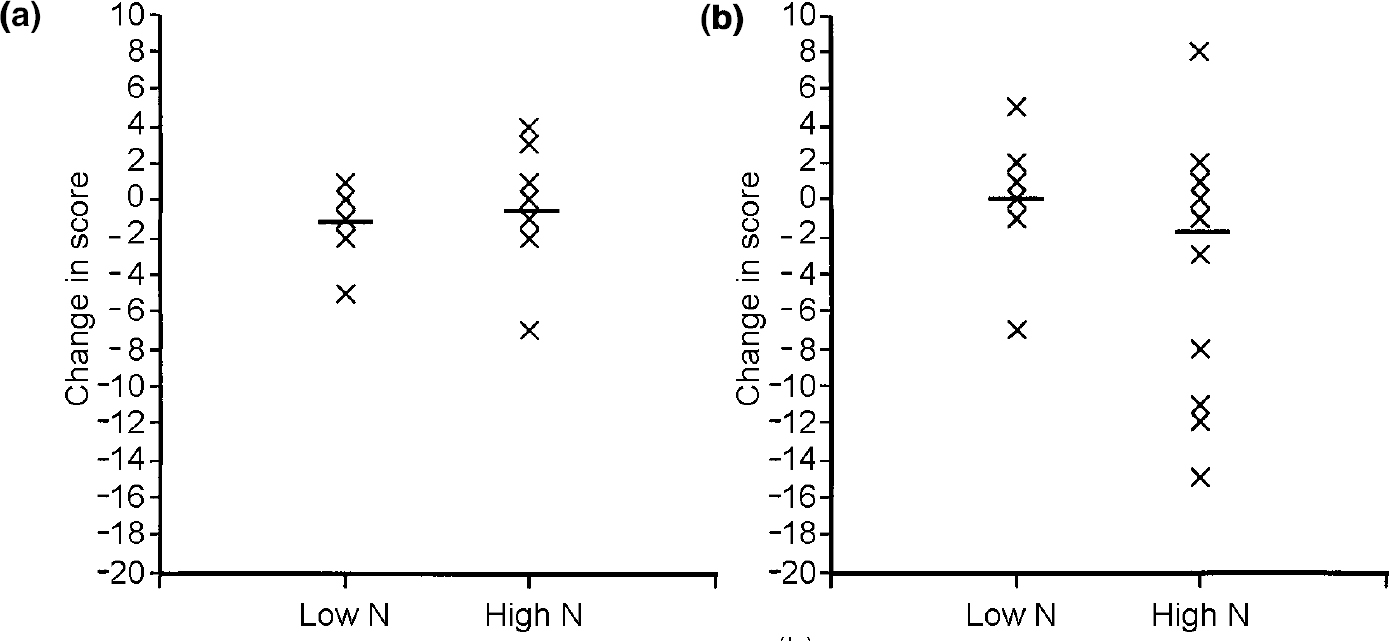
Fig. 1 Change in scores on the Profile of Mood States — Depression scale (negative scores indicate improvement in mood) (a) on the day of tryptophan depletion and (b) on the day of placebo drink for participants with high or low scores for neuroticism (N). — denotes mean score.
Psychometric ability tests
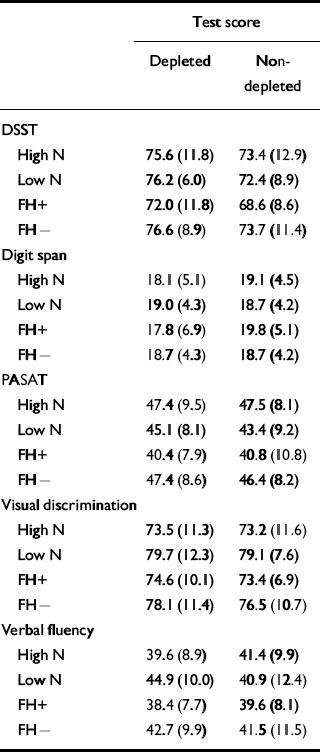
The hypothesis to be tested was that the high-neuroticism scorers would show worse performance in the psychometric tests on the depletion day compared with the placebo day. Table 5 displays the means and standard deviations for the two conditions. In the main, the hypothesis was not supported. A generalised learning effect would be expected on the psychometric tests and this was shown on the digit span measures DIGF and DIGB (F 1,28=13.174, P=0.001, Cohen's f=0.66), the DSST (F 1,28=31.784, P<0.001, Cohen's f=1.00), the PASAT (F 1,28=32.888, P<0.001, Cohen's f=1.00) and on the visual discrimination task (F 1,28=26.266, P<0.001, Cohen's f=1.00), with an improvement shown on day 2 compared with day 1 but with no improvement between the days on verbal fluency (F 1,28=3.588, P=0.069, Cohen's f=0.33). There was no effect of condition or neuroticism group on digit span, on the PASAT or on the visual discrimination task. There was also no significant interaction of condition by neuroticism group on these tests. There was a main effect of condition on the DSST (F 1,28=9.041, P=0.006, Cohen's f=0.55), both groups performing better on the depletion day than on the placebo day (t=2.74, d.f.=31, P=0.01). There was no interaction of condition by neuroticism group (F 1,28=0.016, P=0.901, Cohen's f<0.05).
Table 5 The effect of tryptophan depletion on psychometric test scores (mean (s.d.))
| Test score | ||
|---|---|---|
| Depleted | Non-depleted | |
| DSST | ||
| High N | 75.6 (11.8) | 73.4 (12.9) |
| Low N | 76.2 (6.0) | 72.4 (8.9) |
| FH+ | 72.0 (11.8) | 68.6 (8.6) |
| FH- | 76.6 (8.9) | 73.7 (11.4) |
| Digit span | ||
| High N | 18.1 (5.1) | 19.1 (4.5) |
| Low N | 19.0 (4.3) | 18.7 (4.2) |
| FH+ | 17.8 (6.9) | 19.8 (5.1) |
| FH- | 18.7 (4.3) | 18.7 (4.2) |
| PASAT | ||
| High N | 47.4 (9.5) | 47.5 (8.1) |
| Low N | 45.1 (8.1) | 43.4 (9.2) |
| FH+ | 40.4 (7.9) | 40.8 (10.8) |
| FH- | 47.4 (8.6) | 46.4 (8.2) |
| Visual discrimination | ||
| High N | 73.5 (11.3) | 73.2 (11.6) |
| Low N | 79.7 (12.3) | 79.1 (7.6) |
| FH+ | 74.6 (10.1) | 73.4 (6.9) |
| FH- | 78.1 (11.4) | 76.5 (10.7) |
| Verbal fluency | ||
| High N | 39.6 (8.9) | 41.4 (9.9) |
| Low N | 44.9 (10.0) | 40.9 (12.4) |
| FH+ | 38.4 (7.7) | 39.6 (8.1) |
| FH- | 42.7 (9.9) | 41.5 (11.5) |
Effects were also found in the verbal fluency task. There was an interaction of neuroticism group and condition (F 1,28=6.803, P=0.014, Cohen's f=0.45). The low-neuroticism scorers performed significantly better following depletion than after the placebo drink (t=3.82, d.f.=14, P=0.002). Figure 2 shows performance on the depletion and placebo days by group. There was no main effect of condition with this test (F 1,28=0.391, P=0.537, Cohen's f=0.10).

Fig. 2 Verbal fluency scores (a) on the day of tryptophan depletion and (b) on the day of placebo drink for participants with high or low scores for neuroticism (N). — denotes mean score.
Volunteers with a family history of depression
For the five volunteers with a family history of depression, the experimental condition (acute tryptophan depletion v. placebo) had a significant effect on POMS total scores (Wilcoxon signed ranks Z=2.03, P=0.042). Volunteers with a family history had higher scores on these scales following tryptophan depletion compared with placebo. Within this subgroup there was no effect on the psychometric tests.
DISCUSSION
In this study we examined whether neuroticism was a vulnerability factor for mood change after tryptophan depletion. There was no significant difference following tryptophan depletion on any of the self-report mood scales. However, two of the cognitive tests showed a significant effect following acute tryptophan depletion. Surprisingly, both high-neuroticism and low-neuroticism scorers performed better on the DSST and the low-neuroticism scorers performed significantly better on the Verbal Fluency Test when depleted. Neuroticism was, therefore, not a strong predictor of mood change following tryptophan depletion, but did differentially affect performance on a cognitive test. Family history of affective disorders did predict mood change following acute tryptophan depletion.
Adequate depletion
A potential criticism of tryptophan depletion studies is that adequate depletion of tryptophan was not achieved, but this does not appear to be the case in this study. In this group both free or unbound tryptophan and total plasma tryptophan levels were decreased by over 80%, which was consistent with reductions described in studies that have found effects on mood (Reference Delgado, Charney and PriceDelgado et al, 1990).
Selection bias
Many more high-neuroticism scorers were excluded from the study than low-neuroticism scorers. Significantly more high-neuroticism scorers (57 out of a total of 124 (46%)) compared with low-neuroticism scorers (12 out of a total of 57 (21%)) were excluded for medical or psychiatric reasons (χ2=3.86, d.f.=1, P < 0.05). Interestingly, within the high-neuroticism group the individuals who were excluded had significantly higher neuroticism scores than those who completed the two test days. It is possible that the group who completed both days might be less susceptible to serotonergic change.
Inadequate power
The POMS depression scale has been shown to be sensitive to mood change following tryptophan depletion (Reference Benkelfat, Ellenbogen and DeanBenkelfat et al, 1994). The weak predictive power of neuroticism is perhaps surprising. However, those with a family history of affective disorders did show a significant mood change in line with previous research (Reference Benkelfat, Ellenbogen and DeanBenkelfat et al, 1994). Both male and female healthy volunteers have shown mood change following tryptophan depletion (Reference Klaassen, Riedel and DeutzKlaassen et al, 1999), although this effect has been inconsistent (Reference Schmitt, Jorissen and SobczakSchmitt et al, 2000). There is as yet no explanation why some individuals are susceptible and some are not.
Cognitive measures
Two of the cognitive tasks showed effects of depletion: the DSST and Verbal Fluency Test. It may be that the PASAT, visual discrimination and digit span tests were simply not sensitive enough to detect any change and there was insufficient statistical power in the numbers recruited within thi study. It is also possible that acute tryptophan depletion has modality-specific effects.
There was a main effect of condition for the DSST, i.e. both neuroticism groups performed better following depletion compared with placebo. The DSST tests psychomotor speed and coding. If speed of processing only were affected, then tryptophan depletion would also show an effect on the visual discrimination task, which measures speed of information processing. The DSST in addition requires some coding or planning. It could be that tryptophan depletion affected mainly these components, or that the test requires a number of processes, which makes it more sensitive.
The low-neuroticism scorers performed significantly better on the Verbal Fluency Test following depletion compared with placebo. Serotonin has a dampening effect on the noradrenergic and dopaminergic arousal systems (Reference Baumgarten and GrozdanovicBaumgarten & Grozdanovic, 1994). The decrease in levels of serotonin following tryptophan depletion may increase cortical arousal, with behavioural activation due to release of the noradrenergic and dopaminergic systems. This may have a differential effect on high- and low-neuroticism scorers, improving the low-neuroticism group and impairing the high-neuroticism group.
Clinical implications
Studies have assessed whether personality traits are predictive of antidepressant response (Reference Ansseau, Troisfontaines and PapartAnsseau et al, 1991); however, these studies have not tested directly whether personality is related to a particular monoamine system, and the changes that occurred within these studies are not selective. This study suggests that neuroticism is not strongly linked to mood through serotonin. Neuroticism appears to be related to cognitive function: altering serotonin levels affects those at either end of the neuroticism spectrum in different ways. This is important from a number of perspectives. Personality may affect cognitive side-effects of antidepressant treatment, and this in turn may affect compliance with drug therapy.
The question remains: how can we identify a ‘vulnerable’ serotonergic system? Although a previous history of a major depressive episode and a family history of affective disorders are not necessary or sufficient, they appear to be good predictors. The reasons why some individuals and not others suffer a mood change have still not been explained.
CLINICAL IMPLICATIONS
-
▪ This study suggests that if neuroticism is linked to mood, this is unlikely to operate through strong serotonergic mechanisms.
-
▪ Altering serotonin levels by tryptophan depletion affects cognitive performance of those at either end of the neuroticism spectrum in different ways.
-
▪ By implication, personality may moderate cognitive side-effects of antidepressant treatment.
LIMITATIONS
-
▪ The selection process eliminated high-neuroticism scorers with a history of affective disorder. It may be this subgroup who show a stronger serotonergic connection between neuroticism and low mood.
-
▪ By implication, ‘normal’ changes in mood might be categorically different from pathological depression, so that examination of healthy volunteers does not provide insight into the pathophysiology of depressive disorder.
-
▪ A positive family history of affective disorders may be a more powerful predictor of mood change following acute tryptophan depletion than is neuroticism.
Acknowledgements
We thank the volunteers who took part in this study, Mel Leitch and Eddie Alderson who provided the tryptophan drinks and performed the chromatography, Sharon Battersby, Margaret Van Beck, Carol Swanson and Anne McIntosh who helped with preparation of the blood samples. We thank Alan Doris, Polash Shajahan and Prem Shah for their clinical assistance, George Fink for supervision and the Medical Research Council for funding the project.


eLetters
No eLetters have been published for this article.