Mental well-being is linked to many aspects of health and social functioning including survival. Reference Danner, Snowdon and Friesen1–Reference Wood and Joseph3 Although growing in economic importance, Reference Beddington, Cooper, Field, Goswami, Huppert and Jenkins4,Reference Oswald and Wu5 it remains relatively new in health and social care. Robust empirical evidence on individual and societal associations with mental well-being, and the ways that this might be enhanced remains limited. Reference Strandberg, Strandberg, Pitkala, Salomaa, Tilvis and Miettinen6 This is partly due to lack of consensus about definition and measurement. Reference Manderscheid, Ryff, Freeman, McKnight-Eily, Dhingra and Strine7 Although economists often quantify mental well-being using single-item ‘happiness’ measures, Reference Blanchflower and Oswald8 most theoretically informed research views well-being as comprising two components: hedonic well-being (happiness, life satisfaction and interest in life) Reference Westerhof and Keyes9 and eudaemonic well-being (optimal psychological functioning, positive relationships with others and personal growth). Reference Manderscheid, Ryff, Freeman, McKnight-Eily, Dhingra and Strine7 Keyes Reference Keyes10 and others Reference Lamers, Westerhof, Bohlmeijer, Ten Klooster and Keyes11 also distinguish social well-being from other types of eudaemonic well-being. The former is described as optimal social functioning, including awareness of wider social processes, sense of belonging to a community and social participation. This view is echoed by the World Health Organization (WHO) and the UK Foresight Mental Capital and Wellbeing Project, Reference Beddington, Cooper, Field, Goswami, Huppert and Jenkins4 and was supported in recent empirical research. Reference Lamers, Westerhof, Bohlmeijer, Ten Klooster and Keyes11,Reference Gallagher, Lopez and Preacher12
Our aims were: to identify a set of mental well-being indicators within the limitation of item coverage in a survey of mental disorders; to describe the factor structure of mental well-being in a general population sample; to validate these indicators by demonstrating associations in the expected direction between mental well-being and self-rated health status, income and employment status; and to test the hypothesis that scores on these indices will be relatively independent of symptoms of mental illness.
Method
We undertook a secondary analysis of the 2007 Adult Psychiatric Morbidity Survey (APMS). Reference McManus, Meltzer, Brugha and Bebbington13
Setting and participants
The 2007 APMS recruited adults aged 16 and over living in private households in England Reference McManus, Meltzer, Brugha and Bebbington13 using two-stage sampling. The phase one sample was representative of the population of England living in private households. Details of survey methodology and recruitment are reported elsewhere. Reference McManus, Meltzer, Brugha and Bebbington13 Delivery points (households) were sampled and one person was selected at random to take part within eligible households. Phase-one data, on which this study is based, were collected by lay interviewers. At phase one, 57% of those eligible agreed to take part, resulting in a sample of 7461 respondents.
Measures
Well-being terminology is often confusing, and ‘mental health’ and ‘mental well-being’ are often used interchangeably with ‘positive mental health’. In keeping with UK policy nomenclature 14 we take ‘mental health’ to mean the full spectrum of mental health states; ‘mental illness’ refers to pathological disease states and ‘mental well-being’ covers the positive end of the spectrum.
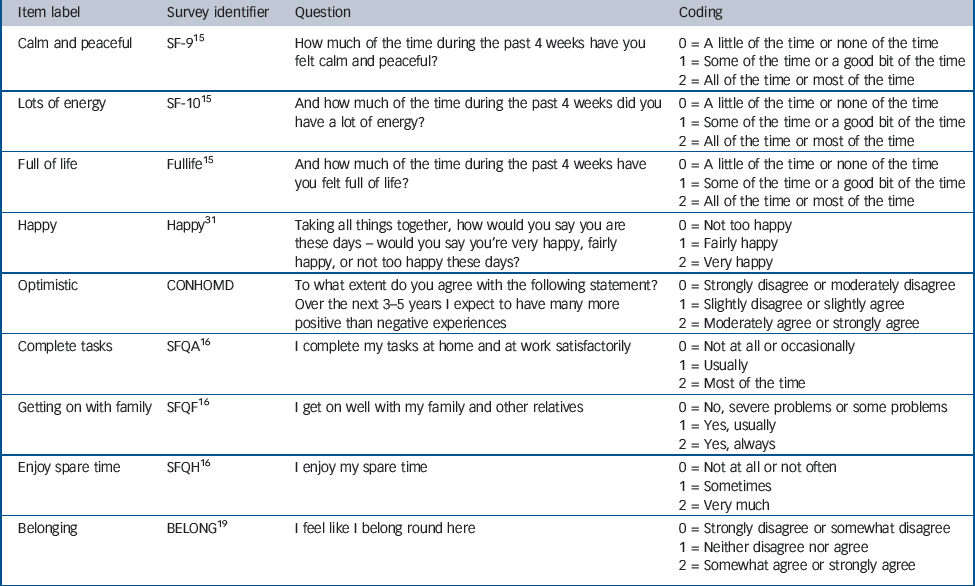
No established measures of well-being were included in the survey. Instead, survey items were selected on the basis of their a priori correspondence to well-being constructs. The APMS data-set was searched to identify all items with face validity as indicators of well-being that were about a positive state (rather than pathology), and reflected optimal occupational and social functioning, self-efficacy, eudaemonic flourishing, satisfactory or rewarding interpersonal relationships, happiness, optimism, satisfaction with life or resilience. Nine items were identified that met these criteria. All were assessed by self-report (Table 1). Of these, three items were taken from the 12-item Short Form Health Survey (SF-12), Reference Jenkinson, Layte, Jenkinson, Lawrence, Petersen and Paice15 three were from the Social Functioning Questionnaire (SFQ), Reference Tyrer, Nur, Crawford, Karlsen, MacLean and Rao16 one item about happiness was from previous international surveys, Reference Blanchflower and Oswald17 one item concerning optimism about the future was derived from the Whitehall II study, Reference Singh-Manoux, Guéguen, Martikainen, Ferrie, Marmot and Shipley18 and one item about belonging was taken from a social capital survey. Reference Dunstan, Weaver, Araya, Bell, Lannon and Lewis19 All were asked face to face except for the SFQ items, which were administered by self-completion. Higher item scores indicated greater levels of well-being.
Common mental disorders were ascertained using the Revised Clinical Interview Schedule (CIS-R). Reference Lewis, Pelosi, Araya and Dunn20 Scores are obtained for each of the 14 symptoms based on frequency, duration and severity in the past week. Individual symptom scores were summed to provide an overall score for the level of neurotic symptoms, and a diagnostic algorithm was used to generate ICD-10 diagnoses. Reference McManus, Meltzer, Brugha and Bebbington13 Respondents who met criteria for any ICD-10 non-psychotic psychiatric disorder (depressive episodes, generalised anxiety disorder, mixed anxiety and depressive disorder, panic disorder, phobias, obsessive–compulsive disorder) were deemed to have a common mental disorder.
Gross annual household income (before tax and National Insurance deductions) was ascertained using show cards (including weekly and monthly amounts for incomes <£36 000). This was adjusted to take account of the number, ages and relationships of people living in the household using McClements weights. Reference McManus, Meltzer, Brugha and Bebbington13 Respondents were allocated to the quintile
Table 1 Well-being items, questions and codings from the Adult Psychiatric Morbidity Survey 2007
| Item label | Survey identifier | Question | Coding |
|---|---|---|---|
| Calm and peaceful | SF-915 | How much of the time during the past 4 weeks have you felt calm and peaceful? | 0 = A little of the time or none of the time |
| 1 = Some of the time or a good bit of the time | |||
| 2 = All of the time or most of the time | |||
| Lots of energy | SF-1015 | And how much of the time during the past 4 weeks did you have a lot of energy? | 0 = A little of the time or none of the time |
| 1 = Some of the time or a good bit of the time | |||
| 2 = All of the time or most of the time | |||
| Full of life | Fullife15 | And how much of the time during the past 4 weeks have you felt full of life? | 0 = A little of the time or none of the time |
| 1 = Some of the time or a good bit of the time | |||
| 2 = All of the time or most of the time | |||
| Happy | Happy31 | Taking all things together, how would you say you are these days – would you say you're very happy, fairly happy, or not too happy these days? | 0 = Not too happy |
| 1 = Fairly happy | |||
| 2 = Very happy | |||
| Optimistic | CONHOMD | To what extent do you agree with the following statement? Over the next 3–5 years I expect to have many more positive than negative experiences | 0 = Strongly disagree or moderately disagree |
| 1 = Slightly disagree or slightly agree | |||
| 2 = Moderately agree or strongly agree | |||
| Complete tasks | SFQA16 | I complete my tasks at home and at work satisfactorily | 0 = Not at all or occasionally |
| 1 = Usually | |||
| 2 = Most of the time | |||
| Getting on with family | SFQF16 | I get on well with my family and other relatives | 0 = No, severe problems or some problems |
| 1 = Yes, usually | |||
| 2 = Yes, always | |||
| Enjoy spare time | SFQH16 | I enjoy my spare time | 0 = Not at all or not often |
| 1 = Sometimes | |||
| 2 = Very much | |||
| Belonging | BELONG19 | I feel like I belong round here | 0 = Strongly disagree or somewhat disagree |
| 1 = Neither disagree nor agree | |||
| 2 = Somewhat agree or strongly agree | |||
representing their household. Employment status was classified as employed, unemployed (and looking for work) or economically inactive. Self-rated health was assessed using a question from the SF-12. Reference Jenkinson, Layte, Jenkinson, Lawrence, Petersen and Paice15
Analysis
We used principal component analysis (PCA) to investigate and describe the underlying factor structure of putative well-being items. The number of factors was determined by examination of scree plots and particularly by eigenvalue size. After factor extraction, orthogonal (varimax) rotation was made to achieve a simpler factor structure. We chose 0.4 as a cut-off for the level of factor loading to be interpreted. Reference Tabachnik and Fidell21 The greater the factor loading, the more the item is a pure measure of the factor. Data reduction was undertaken by dropping items with loadings below the cut-off and re-running PCA. The internal reliability of different combinations of the selected items was assessed by means of Cronbach’s alpha. Reference Carmines and Zeller22
Survey weights were applied to adjust for the probability of selection and for non-response. Reference McManus, Meltzer, Brugha and Bebbington13 The survey weights used in this paper were derived by the APMS team in three stages: (1) a household level weight was calculated using logistic regression to correct for factors associated with household non-response; this was then multiplied by (2) a sample weight reflecting the different probabilities of selecting respondents in different sized house-holds; and finally (3) weights were applied to the data-set using calibration weighting based on age, gender and region to weight the data to represent the age and gender structure of the national and regional populations (using the Office for National Statistics 2006 mid-year household population estimates). As a result of this calibration, the APMS 2007 weighted data match exactly the estimated population across these three dimensions. Details of survey response and the final regression model on which weights were based are shown in the main survey report. Reference McManus, Meltzer, Brugha and Bebbington13
To reflect the clustered nature of the sample, analyses were undertaken using survey commands which adjust standard errors and χ2 statistics for clustering (autocorrelation) within regions and postcode sectors. Associations with scores on the derived well-being scales were estimated using linear least squares regression. All analyses were undertaken using Stata version 10 for Windows.
Results
Complete data on all nine of the selected study items were available for 7108 respondents, 95.3% of those who took part in the survey. This sample comprised 3076 men (43.3%) and 4032 women (56.7%). Mean age was 50.5 years (s.d. = 18.4) and mean CIS-R score 5.53 (s.d. = 7.46). Mean equivalised annual household income was £22 636 (s.d. = £29 196).
Data reduction
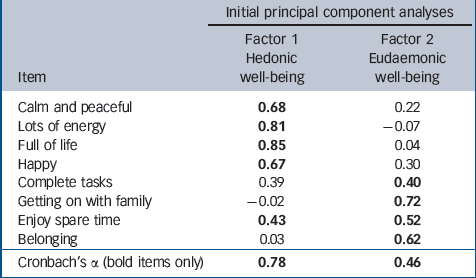
Initial PCA resulted in two factors with eigenvalues >1. One of the nine items, optimism, had factor loadings of <0.4 on both the first (0.30) and second factor (–0.07). On repeating the analysis without this item (n = 7293), two components with eigenvalues >1 were found, explaining 36.9% and 14.3% of the variance in item scores respectively, before rotation. Factor loadings after rotation are shown inTable 2. The first factor was characterised by very strong (>0.8) positive loadings on items concerned with ‘having lots of energy’ and ‘feeling full of life’, strong (>0.6) positive loadings for ‘feeling calm and peaceful’ and ‘being happy’, and moderately strong positive loading (>0.4) for ‘enjoying spare time’; a borderline positive loading (0.39) was observed for ‘completing tasks satisfactorily’. The second factor was characterised by strong positive loadings for ‘getting on well with family and relatives’ (0.72) and ‘belonging’ (0.62), and moderately strong loadings for ‘enjoying spare time’ (0.52) and ‘completing tasks satisfactorily’ (0.40). We labelled the first factor ‘hedonic well-being’ and the second factor ‘eudaemonic well-being’.
Figure 1 shows segregation in loadings for six of the eight items. Two items, ‘enjoy spare time’ and ‘completing tasks satisfactorily’, had similar loadings on both factors. Of the remaining items, four had high hedonic and low eudaemonic loadings and two had high eudaemonic and low hedonic loadings. Cronbach’s alpha was 0.74 for all eight retained items, 0.78 for the five hedonic well-being items and 0.46 for the four eudaemonic well-being items inTable 2.
Table 2 Results of principal component analyses showing item loadings on the retained factors after Varimax rotation
| Initial principal component analyses | ||
|---|---|---|
| Item | ||
| Factor 1 Hedonic well-being | Factor 2 Eudaemonic well-being | |
| Calm and peaceful | 0.68 | 0.22 |
| Lots of energy | 0.81 | –0.07 |
| Full of life | 0.85 | 0.04 |
| Happy | 0.67 | 0.30 |
| Complete tasks | 0.39 | 0.40 |
| Getting on with family | – 0.02 | 0.72 |
| Enjoy spare time | 0.43 | 0.52 |
| Belonging | 0.03 | 0.62 |
| Cronbach's α (bold items only) | 0.78 | 0.46 |
We therefore constructed separate hedonic and eudaemonic well-being scales based on five and four items respectively. For ease of interpretation and to increase comparability with findings from future studies, we undertook these analyses by summing raw item scores.
After applying survey weights, mean hedonic well-being score was 6.85 (s.e. = 0.03) (range 0–10), and mean eudaemonic well-being score was 6.48 (s.e. = 0.02) (range 0–8). The correlation between hedonic and eudaemonic well-being scores was + 0.49. Correlations with CIS-R score were –0.61 for hedonic and –0.45 for eudaemonic well-being respectively.
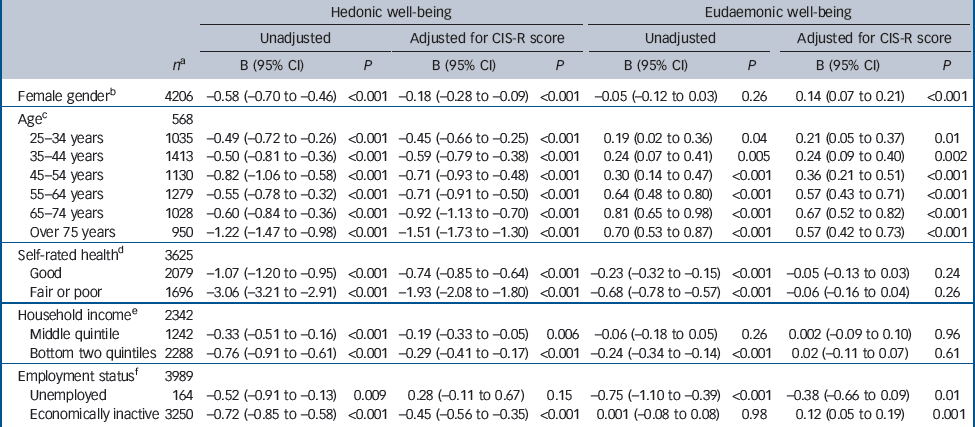
Table 3 shows associations between scores on hedonic and eudaemonic well-being scales and age, gender, self-rated health, household income and employment status before and after adjusting for CIS-R score. Associations with age differed for hedonic and eudaemonic well-being, the former falling with age and the latter increasing (albeit with a slight decrease in the very oldest group). These patterns persisted, and became clearer for hedonic well-being, after adjusting for CIS-R score. Female gender was associated with lower hedonic but not eudaemonic well-being scores, and women had higher scores than men on the latter scale after adjusting for CIS-R score. Lower income was associated with lower hedonic well-being scores, but the association with eudaemonic well-being was less evident and disappeared on adjusting for CIS-R score.
Unemployment was more closely associated with (lower) eudaemonic than hedonic well-being, and the former (but not the latter) was wholly confounded by the association between unemployment and mental disorder. People who were economically inactive had very low hedonic scores but higher eudaemonic well-being scores than those in work. Closer investigation revealed that the latter finding was due to high eudaemonic scores among the retired (mean = 6.91, s.e. = 0.03) (compared with a mean of 6.50 (s.e. = 0.02) for those who were employed). Compared with the employed, regression coefficients for eudaemonic well-being were –0.22 (95% CI –0.34 to –0.10) (P<0.001) for non-retired economically inactive people and 0.36 (95% CI 0.29 to 0.42) (P<0.001) for those who were retired, after adjusting for CIS-R score.
With one or two notable exceptions (e.g. unemployment and hedonic well-being), associations with well-being were only moderately altered by adjusting for CIS-R score, and this rarely altered levels of statistical significance.
We explored the association between well-being and psychiatric morbidity by comparing scores for those with and
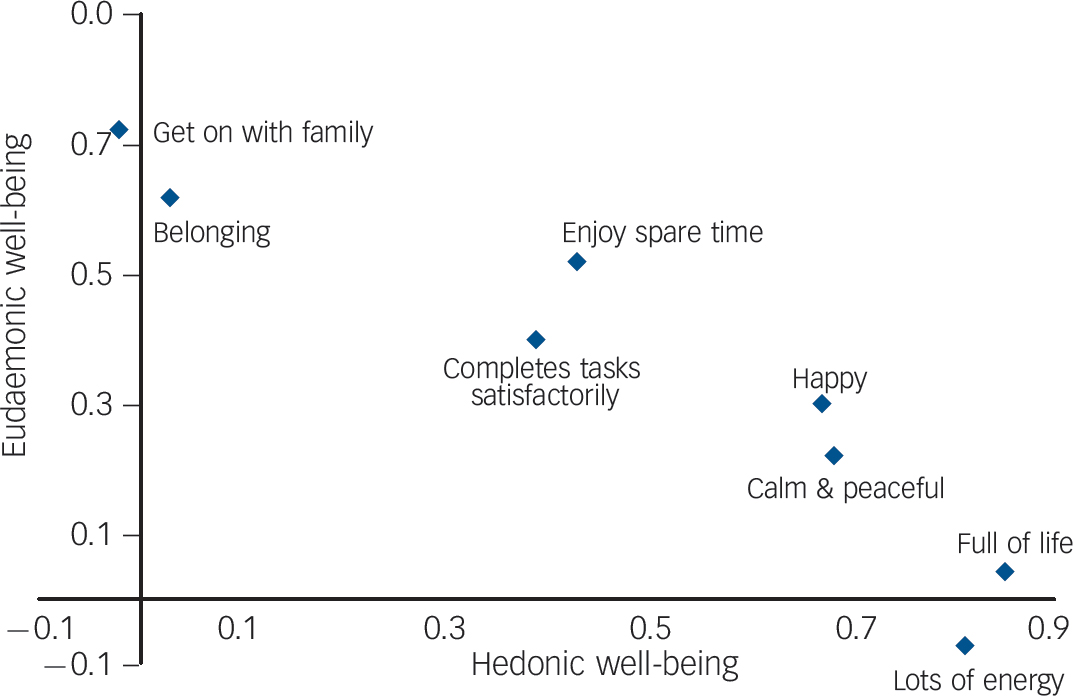
Fig. 1 Scatter plot showing distribution of eight well-being items by loadings for each on the hedonic and eudaemonic well-being factors.
Table 3 Associations with scores on the hedonic and eudaemonic well-being scales showing regression coefficients (with 95% confidence intervals) before and after adjusting for CIS-R score
| Hedonic well-being | Eudaemonic well-being | ||||||||
|---|---|---|---|---|---|---|---|---|---|
| Unadjusted | Adjusted for CIS-R score | Unadjusted | Adjusted for CIS-R score | ||||||
| n a | B (95% CI) | P | B (95% CI) | P | B (95% CI) | P | B (95% CI) | P | |
| Female genderb | 4206 | –0.58 (–0.70 to –0.46) | <0.001 | –0.18 (–0.28 to –0.09) | <0.001 | –0.05 (–0.12 to 0.03) | 0.26 | 0.14 (0.07 to 0.21) | <0.001 |
| Agec | 568 | ||||||||
| 25–34 years | 1035 | –0.49 (-0.72 to –0.26) | <0.001 | –0.45 (–0.66 to –0.25) | <0.001 | 0.19 (0.02 to 0.36) | 0.04 | 0.21 (0.05 to 0.37) | 0.01 |
| 35–44 years | 1413 | –0.50 (–0.81 to –0.36) | <0.001 | –0.59 (–0.79 to –0.38) | <0.001 | 0.24 (0.07 to 0.41) | 0.005 | 0.24 (0.09 to 0.40) | 0.002 |
| 45–54 years | 1130 | –0.82 (–1.06 to –0.58) | <0.001 | –0.71 (–0.93 to –0.48) | <0.001 | 0.30 (0.14 to 0.47) | <0.001 | 0.36 (0.21 to 0.51) | <0.001 |
| 55–64 years | 1279 | –0.55 (–0.78 to –0.32) | <0.001 | –0.71 (–0.91 to –0.50) | <0.001 | 0.64 (0.48 to 0.80) | <0.001 | 0.57 (0.43 to 0.71) | <0.001 |
| 65–74 years | 1028 | –0.60 (–0.84 to –0.36) | <0.001 | –0.92 (–1.13 to –0.70) | <0.001 | 0.81 (0.65 to 0.98) | <0.001 | 0.67 (0.52 to 0.82) | <0.001 |
| Over 75 years | 950 | –1.22 (–1.47 to –0.98) | <0.001 | –1.51 (–1.73 to –1.30) | <0.001 | 0.70 (0.53 to 0.87) | <0.001 | 0.57 (0.42 to 0.73) | <0.001 |
| Self-rated healthd | 3625 | ||||||||
| Good | 2079 | –1.07 (–1.20 to –0.95) | <0.001 | –0.74 (–0.85 to –0.64) | <0.001 | –0.23 (–0.32 to –0.15) | <0.001 | –0.05 (–0.13 to 0.03) | 0.24 |
| Fair or poor | 1696 | –3.06 (–3.21 to –2.91) | <0.001 | –1.93 (–2.08 to –1.80) | <0.001 | –0.68 (–0.78 to –0.57) | <0.001 | –0.06 (–0.16 to 0.04) | 0.26 |
| Household incomee | 2342 | ||||||||
| Middle quintile | 1242 | –0.33 (–0.51 to –0.16) | <0.001 | –0.19 (–0.33 to –0.05) | 0.006 | –0.06 (–0.18 to 0.05) | 0.26 | 0.002 (–0.09 to 0.10) | 0.96 |
| Bottom two quintiles | 2288 | –0.76 (–0.91 to –0.61) | <0.001 | –0.29 (–0.41 to –0.17) | <0.001 | –0.24 (–0.34 to –0.14) | <0.001 | 0.02 (–0.11 to 0.07) | 0.61 |
| Employment statusf | 3989 | ||||||||
| Unemployed | 164 | –0.52 (–0.91 to –0.13) | 0.009 | 0.28 (–0.11 to 0.67) | 0.15 | –0.75 (–1.10 to –0.39) | <0.001 | –0.38 (–0.66 to 0.09) | 0.01 |
| Economically inactive | 3250 | –0.72 (–0.85 to –0.58) | <0.001 | –0.45 (–0.56 to –0.35) | <0.001 | 0.001 (–0.08 to 0.08) | 0.98 | 0.12 (0.05 to 0.19) | 0.001 |
CIS-R, Revised Clinic Interview Schedule.
a Numbers total are the total for the sample; exact numbers used for the two sets of analyses vary somewhat – data available on request.
b Versus male.
c Versus 16–24 years.
d Versus excellent or very good.
e Versus top two quintiles.
f Versus employed.
without common mental disorders (Figs2 and3). These show that in the presence of common mental disorders, scores for well-being were shifted to the left, but much more so for hedonic than eudaemonic well-being. These figures also show that many people with common mental disorders report moderately high levels of hedonic well-being and even higher levels of eudaemonic well-being. The greatest disparities between the two subgroups were observed at the far right-hand side of each distribution, with very few individuals with common mental disorders reporting high levels of well-being.
Discussion
Main findings
Our findings demonstrate that well-being and mental disorder are correlated but independent dimensions. Most associations with
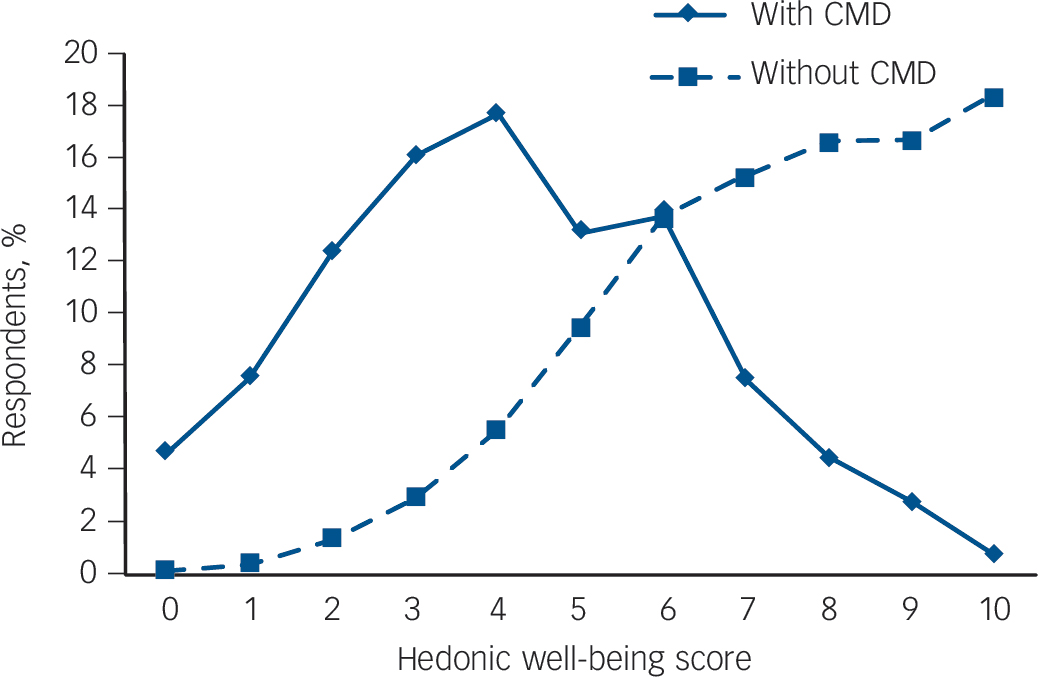
Fig. 2 Distribution of hedonic well-being scores for those with and without common mental disorder (CMD).
well-being were only moderately altered by adjusting for severity of mental disorder, and this rarely altered levels of statistical significance. These analyses also provide further support for the view that hedonic and eudaemonic well-being are distinct but complementary components of well-being. Reference Lamers, Westerhof, Bohlmeijer, Ten Klooster and Keyes11,Reference Huppert and Whittington23,Reference Hu, Stewart-Brown, Twigg and Weich24
Principal component analysis results indicated a two-factor structure for well-being, with partial but incomplete separation of the hedonic and eudaemonic items and strong loadings for eight out of nine study items. When the items in question were summed to create two well-being scale scores, we found distinct patterns of association between hedonic and eudaemonic well-being and age, gender and employment status. The associations with age and gender stand out. Hedonic well-being (feeling full of life and having lots of energy) declined with age (especially after adjusting for CIS-R score), while eudaemonic well-being (getting on well with family and friends, and having a sense of belonging)
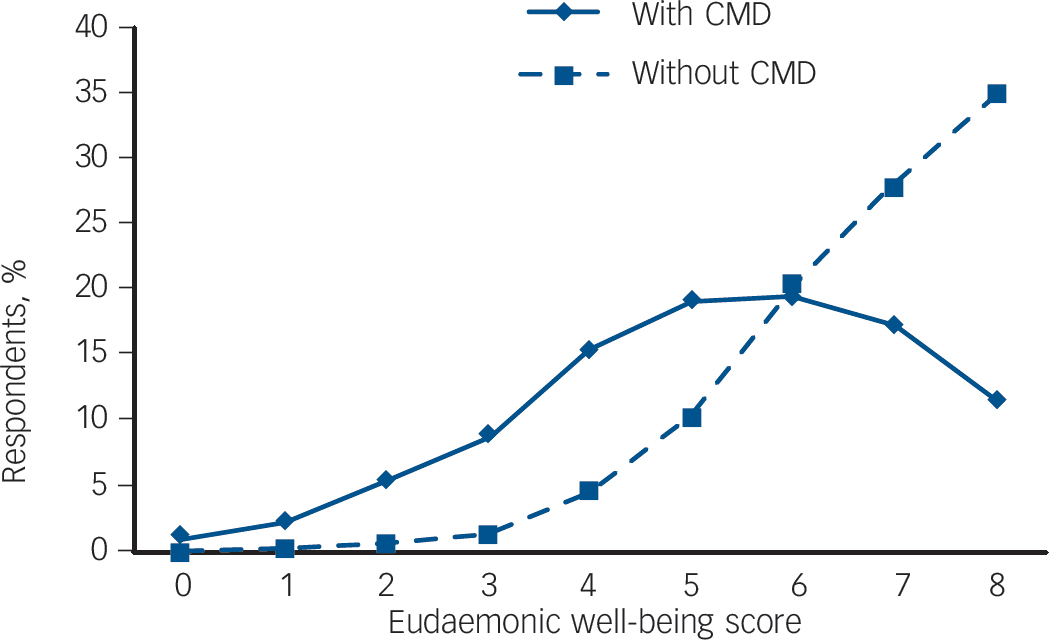
Fig. 3 Distribution of eudaemonic well-being scores for those with and without common mental disorder (CMD).
rose steadily across the age span. Those who were retired had high eudaemonic well-being scores (but low levels of hedonic well-being) even after adjusting for CIS-R score and for age. Women had significantly lower scores than men on hedonic but not eudaemonic well-being, although both associations were confounded by women’s higher CIS-R scores. After adjusting for the latter, women had significantly higher eudaemonic well-being scores than men.
Comparison with previous research
Most empirical research has focused on hedonic (happiness and life satisfaction) and eudaemonic (optimal psychological functioning and self-efficacy) well-being, with the latter generally being judged to include social well-being – including maturity (the capacity to move from self-interest to community participation) and emotional intelligence (the capacity for rewarding close personal relationships). Our results indicate two broad well-being domains, corresponding to the hedonic and eudaemonic traditions, albeit with a degree of item and scale overlap. In our data-set, the eudaemonic items also included one that might be viewed as hedonic (enjoying spare time) and another (belonging) that corresponds to Keyes’ social well-being. Reference Keyes10 Although we had insufficient items to distinguish between two- and three-factor models, our findings are consistent with studies reporting weak correlations between hedonic and social aspects of well-being and strong associations between eudaemonic and social well-being. Reference Lamers, Westerhof, Bohlmeijer, Ten Klooster and Keyes11,Reference Gallagher, Lopez and Preacher12 These findings suggest that maturity (indicated by a sense of belonging) and satisfying social relationships (getting on with family) are at least partly independent of hedonic tone (feeling happy and full of life).
Although studies of happiness report a U-shaped association with age, Reference Blanchflower and Oswald8 associations between age and eudaemonic and social well-being are far more complex. Reference Westerhof and Keyes9 Hedonic well-being declined in middle age (especially in the 45- to 54-year-old group). However, the steep fall among the oldest participants – perhaps due to inclusion of items such as feeling full of life – meant that this was not the U-shape reported in samples using single-item ‘life satisfaction’ measures. Reference Blanchflower and Oswald8 The slight rise in hedonic well-being in later middle and early old age (ages 55–74 years) disappeared on adjusting for psychiatric morbidity (CIS-R score), resulting in a pattern of steady decline in this aspect of well-being across the age span. By contrast, eudaemonic well-being increased markedly and steadily across most of the age range, dipping only very slightly in the oldest group. Contrasting patterns of individual item responses argue against any simple reporting bias.
Our results suggest that different aspects of well-being may predominate at different life stages. Our findings concur in part with socioemotional selectivity theory, which views time horizons (and their salience with advancing age) as critical for human motivation. Reference Carstensen25 According to socioemotional selectivity theory, older persons attend to and process positive rather than negative experiences. Those with limited time horizons invest little in new experiences and extending social networks, instead targeting short-term goals and optimising positive emotional states by concentrating energies on satisfying areas of life. This might explain the consistently low rates of mental disorder in older people in general population surveys, which have led some to question whether older people are reluctant to report mental distress. Reference Cooper, Bebbington, King, Jenkins, Farrell and Brugha26 Although this may reflect social desirability bias, it may be that older people pay less attention to negative experiences or feelings. Selection effects may also pertain, with mortality being greatest in those with the lowest levels of well-being. Our results are also in keeping with the notion of eudaemonic well-being as being where one wants to be and being motivated to do something worthwhile, Reference Waterman, Schwartz, Zamboangac, Ravert, Williams and Agochae27 both of which probably require judgements borne of age and experience.
This view was further supported by evidence from associations between well-being and employment status. Unemployment was associated more with (lower) eudaemonic than hedonic well-being, which fits with the view that the former is a measure of purpose and fulfilment. Our results also revealed that people who were economically inactive had very low hedonic scores but higher eudaemonic well-being scores than those in work – in particular, the latter finding reflecting very high eudaemonic well-being scores among the retired. Those who were economically inactive but not retired (e.g. owing to ill-health) had low levels of eudaemonic well-being. It was also notable that unemployment was associated both with (lower) hedonic well-being and eudaemonic well-being scores (to statistically significant degrees), but the former (and not the latter) was wholly confounded on adjusting for CIS-R score. These findings suggest that eudaemonic well-being is harder to maintain in the face of unemployment than hedonic well-being. Overall, our results are in keeping with most but not all Reference Uher and Goodman28 evidence that mental well-being and mental illness are highly correlated (r≥0.5) but distinct dimensions. Reference Westerhof and Keyes9,Reference Lamers, Westerhof, Bohlmeijer, Ten Klooster and Keyes11,Reference Huppert and Whittington23,Reference Hu, Stewart-Brown, Twigg and Weich24
Comparison with other brief well-being measures
Although there are many well-being measures (excluding single-item assessments), three are brief enough for use in population-based studies: the Warwick–Edinburgh Mental Well-Being Scale (WEMWBS), Reference Tennant, Hiller, Fishwick, Platt, Joseph and Weich29 the Mental Health Continuum – Short Form (MHC-SF) Reference Lamers, Westerhof, Bohlmeijer, Ten Klooster and Keyes11 and the WHO Well-being Index (WHO-5). Reference Bech, Olsen, Kjoller and Rasmussen30 The WHO-5 items are predominantly hedonic: feeling cheerful, calm and relaxed, vigorous, life filled with things of interest and waking feeling rested. The WEMWBS comprises 7- and 14-item versions, and includes hedonic (e.g. ‘I’ve been feeling cheerful’) and eudaemonic (e.g. ‘I’ve been dealing with problems well’) items. The MHC-SF includes 14 items covering emotional, psychological and social well-being. In the present study we report lower internal scale reliability (0.78 and 0.46) compared with those reported for WEMWBS (0.91) and MHC-SF (0.89) (both 14-item scales), and very low factor loadings for the item concerning optimism about the future, which features in many well-being measures. Despite its face validity, optimism about the future did not contribute significantly to the assessment of mental well-being in the present study. It may be that the most appropriate place for this variable remains in the assessment of personality, or the severity of depression and suicidal risk.
Strengths and limitations
We did not set out to create an improved well-being measure, and the main limitation of this research arose from reliance on secondary data and post hoc item identification. The survey was commissioned and planned in 2005/6 before well-being had been prioritised in research and policy agendas. The main strengths of this study lie in the large, nationally representative population sample and in the quality of data on psychiatric morbidity, general health and socioeconomic status. One notable limitation is the relatively weak internal reliability of the eudaemonic well-being scale, which is partly explained by the small number of items. We chose to retain this (separate) well-being domain in order to make full use of the extra information that arose from distinguishing between two distinct but complementary aspects of mental well-being.
Implications
Mental well-being comprises hedonic and eudaemonic elements, and these can be assessed using a brief set of survey questions. Both aspects of well-being are distinct from but correlated with symptoms of mental disorder. This means that mental well-being, including feelings of happiness and a sense of purpose and belonging, can remain even in the presence of mental suffering. The most important finding of our study with regard to present debates about measuring well-being is that single items about total happiness or life satisfaction are of limited value for monitoring well-being or identifying targets for intervention. The psychometric properties of the two well-being scales constructed from the survey items available to us justifies the use of the scale in further analyses of the correlates of mental well-being in APMS 2007.
Acknowledgements
S.W. had final responsibility for the decision to submit for publication. All authors had access to the study data, which are publicly available.


eLetters
No eLetters have been published for this article.