Depression is one of the most common mental disorders among adults. Reference Hasin, Goodwin, Stinson and Grant1,Reference Waraich, Goldner, Somers and Hsu2 Major depression in particular ranks currently fourth in disease burden worldwide, and is expected to rank first in high-income countries by 2030. Reference Mathers and Loncar3 In addition, depression is an enormous societal burden due to high healthcare use and reduced work performance. Reference Olesen, Gustavsson, Svensson, Wittchen and Jonsson4–Reference Greenberg, Kessler, Birnbaum, Leong, Lowe and Berglund6 Furthermore, depression is associated with substantial impairments in quality of life. Reference Saarni, Suvisaari, Sintonen, Pirkola, Koskinen and Aromaa7,Reference Ustun, Ayuso-Mateos, Chatterji, Mathers and Murray8 Quality of life (QoL) is a broad concept that comprises a range of life domains of the individual, such as social relationships, physical abilities, mental health functioning, role functioning and engagement in daily activities. Deficits in all these domains have been identified in people experiencing depressive symptoms. Reference Papakostas, Petersen, Mahal, Mischoulon, Nierenberg and Fava9 Several meta-analyses have shown the effectiveness of different psychotherapies in reducing depressive symptoms compared with control conditions. Reference Cuijpers, Geraedts, van Oppen, Andersson, Markowitz and van Straten10,Reference Cuijpers, Smit, Bohlmeijer, Hollon and Andersson11 Even though it is often postulated that improvements in depressive symptoms during treatment coincide with improvements in QoL, evidence to support the effectiveness of depression treatment on QoL is limited. Reference Ezquiaga, Garcia-Lopez, de Dios, Leiva, Bravo and Montejo12 Research indicates that QoL and depressive symptoms are moderately correlated at post-treatment assessment but suggest a weaker relationship in the long term. Reference McKnight and Kashdan13 Additionally, research suggests that people in remission from depression experience persistent deficits in QoL. Reference Ishak, Greenberg, Balayan, Kapitanski, Jeffrey and Fathy14,Reference Zimmerman, Chelminski, McGlinchey and Young15 Therefore, clinical remission, as well as overall well-being, defined exclusively by the absence of depressive symptoms, may be insufficient. To date, no meta-analysis has quantified the effects of psychotherapy for depression on QoL. Therefore, we examined how the effects of psychotherapy for depression compared with control conditions on global QoL and on two specific domains of QoL, namely mental and physical health.
Method
Initially, we searched an existing database (www.evidencebasedpsychotherapies.org) that has previously been used in a series of meta-analyses and contains 1476 randomised controlled trials (RCTs). Reference Cuijpers, van Straten, Warmerdam and Andersson16 This database was developed through a systematic literature search (from 1966 to 1 January 2013) and is periodically updated. Additionally, a systematic literature search was conducted in PubMed, EMBASE, PsycINFO and the Cochrane Central Register of Controlled Trials from 1 January 2013 to 1 January 2015.
Study selection
We included published RCTs in which psychotherapy for depression was compared with a control condition, for participants 18 years old or over, and which reported a measure of QoL at post-treatment assessment. Psychotherapy was defined as an intervention in which the core element was verbal communication between a participant and a therapist, or as a systematic psychological treatment in the form of a website or book which the participant worked through more or less independently but with personal support from a therapist. Reference Cuijpers, van Straten, Warmerdam and Andersson16 The control condition was defined as waiting list, care as usual, placebo or another minimal treatment. Studies were included if participants were diagnosed with a depressive disorder on the basis of a structured clinical interview or if they reported elevated depressive symptoms based on a standardised measurement of depressive symptom severity. A measure of QoL was defined as any patient-reported measure aiming to assess perceived health status, well-being or effective performance in daily life. Reference Higgins and Green17 These measures could provide a global (overall) score, or separate scores for different domains or components. We differentiated between two components, namely mental health and physical health. The mental health component of QoL was defined as personal satisfaction with the current psychological state, whereas the physical health component was defined as the perceived competence for performance and functioning in various everyday activities. Reference Higgins and Green17 Our search was restricted to studies written in English and German. Studies regarding treatment maintenance were excluded. Comorbid psychiatric or medical disorders were not used as an exclusion criterion. Finally, we excluded studies for which we did not have sufficient statistics to perform the meta-analysis.
Quality assessment
The validity of the studies was assessed following the guidelines provided by the Cochrane Collaboration's tool for assessing risk of bias. Reference Higgins, Altman, Gotzsche, Juni, Moher and Oxman18 Risk of bias was examined in four domains: random sequence generation, allocation concealment, blinding (masking) of outcome assessment and intention-to-treat analysis. Two authors (S.K. and A.K.) conducted the assessment. Disagreements between the two reviewers were resolved by discussion until consensus was reached.
Statistical analysis
For the univariate analyses we used the Comprehensive Meta-Analysis (CMA) software package. Reference Borenstein, Hedges, Higgins and Rothstein19 For the multivariate analyses we used the metareg module within Stata, Reference Harbord and Higgins20 because these analyses cannot be performed with CMA. We calculated the effect size following the procedure described by Hedges & Olkin to correct for small sample size bias. Reference Hedges and Olkin21 We estimated the pooled effect sizes using the random effects model to account for heterogeneity among studies. Reference Hedges and Vevea22 Heterogeneity was examined with the I 2 statistic, where a value of 25% determines low heterogeneity, 50% moderate heterogeneity and 75% high heterogeneity. Reference Higgins, Thompson, Deeks and Altman23 We further calculated the 95% confidence intervals around I 2 statistic, Reference Ioannidis, Patsopoulos and Evangelou24 by using the non-central χ2-based approach within the heterogi module for Stata. Reference Orsini, Bottai, Higgins and Buchan25 Finally, publication bias was examined by visual inspection of the funnel plot and by implementing Duval & Tweedie's trim and fill procedure, which is a test of symmetry of the funnel plot. In addition, the method developed by Duval & Tweedie yields an adjusted pooled effect size after accounting for missing studies due to publication bias. Reference Duval and Tweedie26 We conducted a number of subgroup analyses to identify potential moderators of the outcome using the mixed effects model, in which studies within the subgroups are pooled with the random effects model and the tests for significant differences between the subgroups are carried out with the fixed effects model. Reference Borenstein, Hedges, Higgins and Rothstein27 Subgroup analyses were performed when at least three studies were available for each group. Moreover, we conducted sensitivity analyses because a number of studies compared more than one experimental group with the same control condition, and therefore the assumption of independency was violated. In the sensitivity analyses we first included the largest effect size for each study and then the lowest effect size for each study.
We used univariate and multivariate meta-regression analyses to examine the relationship between changes in QoL and depressive symptom severity. The meta-regressions were undertaken using the mixed effects model. Reference Viechtbauer28 For the univariate meta-regressions the effect size of QoL was set as the dependent variable and the effect size of depressive symptom severity as the predictor. For the multivariate meta-regressions a number of potential confounder variables were added simultaneously as predictors alongside the effect size for depressive symptoms.
Power calculation
We presumed that a limited number of studies would have administered QoL measures. Thus, we carried out a power calculation to estimate whether the included studies would provide sufficient statistical power to detect small effect sizes, according to the recommendations of Borenstein et al. Reference Borenstein, Hedges, Higgins and Rothstein27 Although there is no consensus about a clear definition, we defined a small effect size as g = 0.20. Reference Cohen29 We conservatively assumed a high level of between-study variance (τ2), a statistical power of 0.80 and an alpha value of 0.05. The power calculation demonstrated that we would need 20 studies with a mean sample size of 40 participants or 15 studies with 54 participants.
Results
The databases search resulted in 20 461 titles. We retrieved the full text of 1764 studies, from which 44 studies were included in this meta-analysis (Fig. 1).
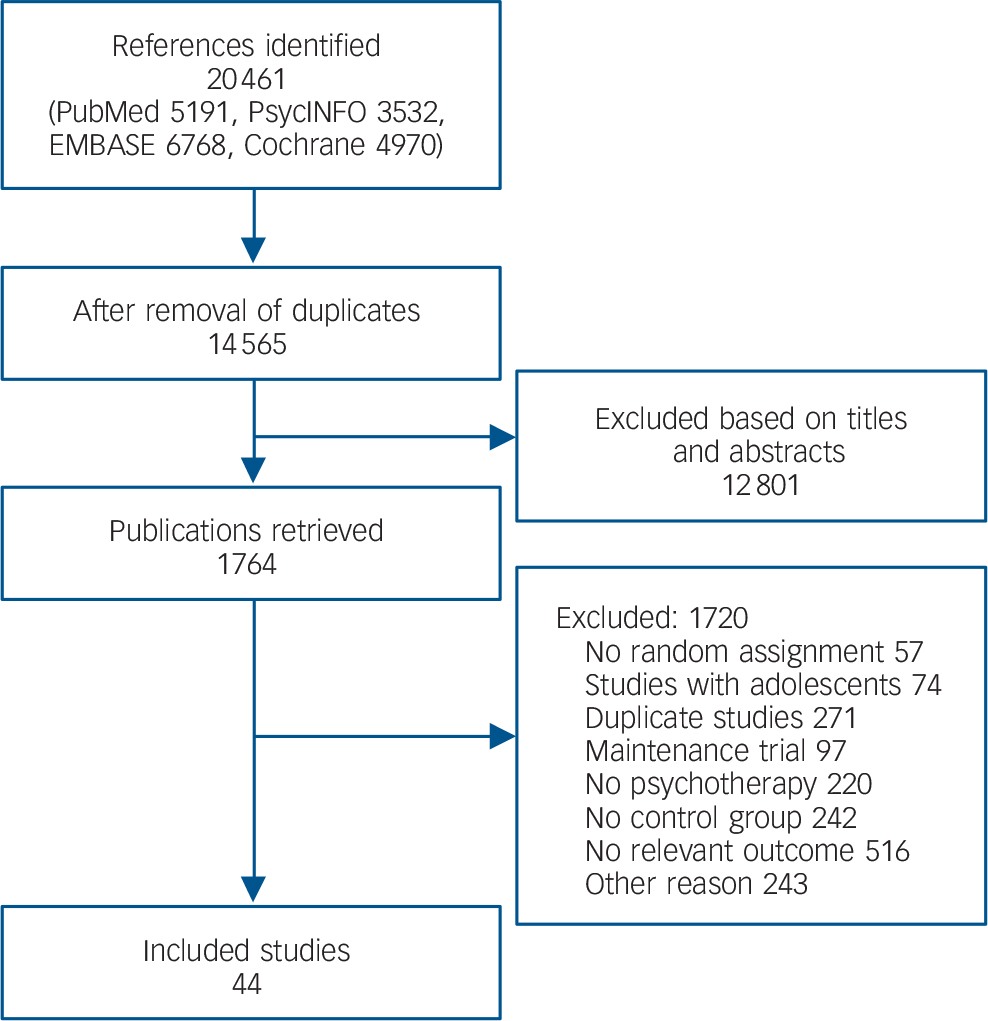
Fig. 1 Study selection.
Study characteristics
The 44 studies included in total 5264 patients: 2907 in the intervention group and 2357 in the control group (see online Table DS1). More specifically, the meta-analysis of global QoL included 27 studies with 2448 patients, the meta-analysis of the mental health component included 18 studies with 2463 patients and that of the physical health component included 13 studies with 1561 patients. Psychotherapies that could be clustered in the cognitive–behavioural group (i.e. cognitive–behavioural therapy, mindfulness-based cognitive therapy and coping with depression) were provided in 25 studies (56%). Life review was offered in five studies (14%), problem-solving treatment in three studies (8%), acceptance and commitment therapy in three studies (8%) and interpersonal psychotherapy in two studies (5%). Care as usual was the most common control condition and was included in 20 studies (45%). It consisted mainly of psychotherapy, antidepressant medication or combination treatments, but was only superficially described in the published papers. Therefore, we did not have enough information to cluster usual treatments based on their modality. Waiting-list groups were included in 17 studies (39%). Other types of control conditions were included in 7 studies (16%), and consisted of discussion groups, psychoeducation, a 20 min educational video or placebo pill. The mean number of treatment sessions was 10 (median 9, range 1–25). All the quality criteria were met by 24 studies (55%) and at least three out of four criteria were met by 33 studies (75%). Finally, 36 studies (82%) reported a method of handling incomplete outcome data. The characteristics of the participants varied among the studies. Adult patients (both men and women) were included in 27 studies (61%), older adults in 11 studies (25%) and exclusively women in six studies (14%). Eighteen studies (41%) included participants diagnosed with major depressive disorder. Patients with comorbid physical or mental health symptoms were included in 15 studies (34%).
Global QoL
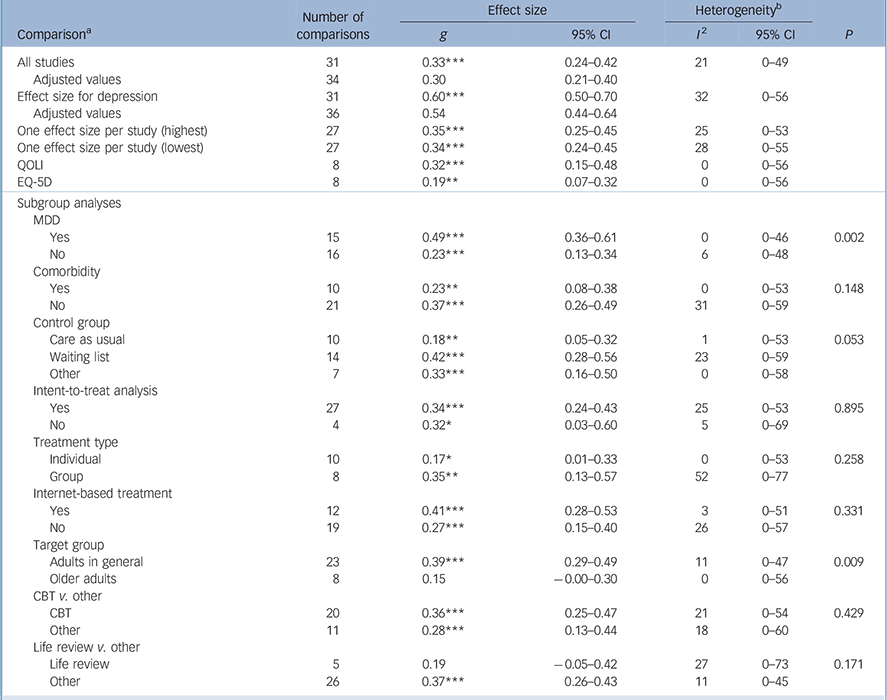
Thirty-one comparisons were included in the meta-analysis of global QoL (Fig. 2). The mean effect size (Hedges' g) was 0.33 (95% CI 0.24–0.42). We detected low between-study heterogeneity (I 2 = 21, 95% CI 0–49). After adjusting for publication bias using the trim and fill procedure the mean effect size was g = 0.30 (95% CI 0.21–0.40), with three imputed studies (Table 1). Moreover, meta-analysis including only the largest effect size of each study resulted in an overall effect size of g = 0.35 (95% CI 0.25–0.45). When only the smallest effect size was included the pooled effect size was g = 0.34 (95% CI 0.24–0.45). We also calculated the effect sizes separately for scores on the Quality of Life Inventory (QOLI; g = 0.32, 95% CI 0.15–0.48) and the EuroQol EQ-5D (g = 0.19, 95% CI 0.07–0.32). Studies including people with major depressive disorder resulted in larger effect sizes (g = 0.49, 95% CI 0.36–0.61) than studies including people without such a diagnosis (g = 0.23, 95% CI 0.13–0.34, P = 0.002). Studies including adults reported larger effect sizes (g = 0.39, 95% CI 0.29–0.49) than studies including older adults (g = 0.15, 95% CI 0.00–0.30, P = 0.009). Other study characteristics were not significantly related to the effect size of global QoL.

Fig. 2 Standardised effect sizes (Hedges' g) of psychotherapy for depression compared with control conditions on global quality of life. CBT, cognitive–behavioural therapy (em, email therapy; sh, guided self-help; st, standard treatment; tai, tailored treatment); PST, problem-solving therapy; SUP, supportive therapy.
Table 1 Global quality of life: effect sizes in meta-analysis of studies comparing psychotherapy with a control group
| Number of comparisons |
Effect size | Heterogeneity b | ||||
|---|---|---|---|---|---|---|
| Comparison a | g | 95% CI | I 2 | 95% CI | P | |
| All studies | 31 | 0.33*** | 0.24–0.42 | 21 | 0–49 | |
| Adjusted values | 34 | 0.30 | 0.21–0.40 | |||
| Effect size for depression | 31 | 0.60*** | 0.50–0.70 | 32 | 0–56 | |
| Adjusted values | 36 | 0.54 | 0.44–0.64 | |||
| One effect size per study (highest) | 27 | 0.35*** | 0.25–0.45 | 25 | 0–53 | |
| One effect size per study (lowest) | 27 | 0.34*** | 0.24–0.45 | 28 | 0–55 | |
| QOLI | 8 | 0.32*** | 0.15–0.48 | 0 | 0–56 | |
| EQ-5D | 8 | 0.19** | 0.07–0.32 | 0 | 0–56 | |
| Subgroup analyses | ||||||
| MDD | ||||||
| Yes | 15 | 0.49*** | 0.36–0.61 | 0 | 0–46 | 0.002 |
| No | 16 | 0.23*** | 0.13–0.34 | 6 | 0–48 | |
| Comorbidity | ||||||
| Yes | 10 | 0.23** | 0.08–0.38 | 0 | 0–53 | 0.148 |
| No | 21 | 0.37*** | 0.26–0.49 | 31 | 0–59 | |
| Control group | ||||||
| Care as usual | 10 | 0.18** | 0.05–0.32 | 1 | 0–53 | 0.053 |
| Waiting list | 14 | 0.42*** | 0.28–0.56 | 23 | 0–59 | |
| Other | 7 | 0.33*** | 0.16–0.50 | 0 | 0–58 | |
| Intent-to-treat analysis | ||||||
| Yes | 27 | 0.34*** | 0.24–0.43 | 25 | 0–53 | 0.895 |
| No | 4 | 0.32* | 0.03–0.60 | 5 | 0–69 | |
| Treatment type | ||||||
| Individual | 10 | 0.17* | 0.01–0.33 | 0 | 0–53 | 0.258 |
| Group | 8 | 0.35** | 0.13–0.57 | 52 | 0–77 | |
| Internet-based treatment | ||||||
| Yes | 12 | 0.41*** | 0.28–0.53 | 3 | 0–51 | 0.331 |
| No | 19 | 0.27*** | 0.15–0.40 | 26 | 0–57 | |
| Target group | ||||||
| Adults in general | 23 | 0.39*** | 0.29–0.49 | 11 | 0–47 | 0.009 |
| Older adults | 8 | 0.15 | −0.00–0.30 | 0 | 0–56 | |
| CBT v. other | ||||||
| CBT | 20 | 0.36*** | 0.25–0.47 | 21 | 0–54 | 0.429 |
| Other | 11 | 0.28*** | 0.13–0.44 | 18 | 0–60 | |
| Life review v. other | ||||||
| Life review | 5 | 0.19 | −0.05–0.42 | 27 | 0–73 | 0.171 |
| Other | 26 | 0.37*** | 0.26–0.43 | 11 | 0–45 | |
CBT, cognitive–behavioural therapy; MDD, major depressive disorder; QoL, quality of life; QOLI, Quality of Life Inventory.
a. The data presented here are from analysis using the random effects model.
b. Variance between studies as a proportion of the total variance; heterogeneity tested using the I 2 statistic.
* P<0.05,
** P<0.01,
*** P<0.001.
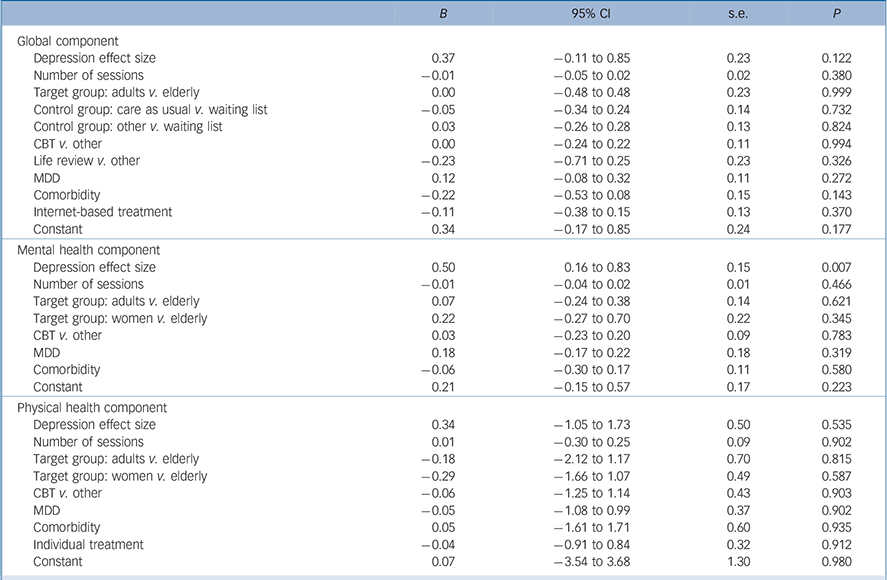
The mean effect size for depressive symptoms was g = 0.60 (95% CI 0.50–0.70) and therefore considerably larger than that for global QoL. Heterogeneity was moderate (I 2 = 32%, 95% CI 0–56). After adjusting for publication bias the mean effect size decreased to g = 0.54 (95% CI 0.44–0.64), with five imputed studies. The univariate meta-regression analysis indicated a significant relationship between the effect size of global QoL and the effect size of depressive symptoms (slope 0.52, 95% CI 0.21–0.84, P = 0.002), suggesting that with each increase in effect size of depressive symptom severity by 1 the effect size for global QoL increased by 0.52. The effect size of global QoL was not significantly associated with the number of treatment sessions (slope 0.00, 95%CI −0.03 to 0.03, P = 0.803). The multivariate meta-regression results showed that none of the predictors included in the model was significantly related to the effect of psychotherapy on global QoL at post-treatment assessment (see Table 4).
Mental health
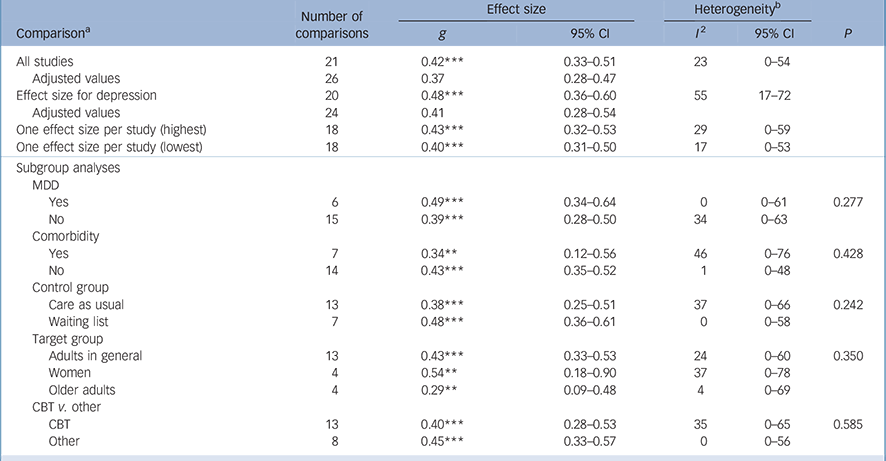
Twenty-one comparisons were included in the meta-analysis of the effects of psychotherapy for depression on the mental health component of QoL compared with a control condition. The mean effect size was g = 0.42 (95% CI 0.33–0.51). We detected low between-study heterogeneity (I 2 = 3, 95% CI 0–54). After adjustment for publication bias the mean effect size was g = 0.37 (95% CI 0.28–0.47), with five imputed studies (Table 2). Additionally, we performed a meta-analysis including the largest effect size of each study, which resulted in an overall effect size of g = 0.43 (95% CI 0.32–0.53). When the smallest effect size was included the pooled effect size was g = 0.40 (95% CI 0.31–0.50). Finally we conducted a series of subgroup analyses, but none of the included moderators was significantly related to the effect size of the mental health component (Table 2). For this group of studies the mean effect size for depressive symptoms was g = 0.48 (95% CI 0.36–0.60). Between-study heterogeneity was moderate to high (I 2 = 55, 95% CI 17–72). After adjusting for publication bias the effect size decreased (g = 0.41, 95% CI 0.28–0.54), with four missing studies.
Table 2 Mental health component of quality of life: effect sizes in meta-analysis of studies comparing psychotherapy with a control group
| Number of comparisons |
Effect size | Heterogeneity b | ||||
|---|---|---|---|---|---|---|
| Comparison a | g | 95% CI | I 2 | 95% CI | P | |
| All studies | 21 | 0.42*** | 0.33–0.51 | 23 | 0–54 | |
| Adjusted values | 26 | 0.37 | 0.28–0.47 | |||
| Effect size for depression | 20 | 0.48*** | 0.36–0.60 | 55 | 17–72 | |
| Adjusted values | 24 | 0.41 | 0.28–0.54 | |||
| One effect size per study (highest) | 18 | 0.43*** | 0.32–0.53 | 29 | 0–59 | |
| One effect size per study (lowest) | 18 | 0.40*** | 0.31–0.50 | 17 | 0–53 | |
| Subgroup analyses | ||||||
| MDD | ||||||
| Yes | 6 | 0.49*** | 0.34–0.64 | 0 | 0–61 | 0.277 |
| No | 15 | 0.39*** | 0.28–0.50 | 34 | 0–63 | |
| Comorbidity | ||||||
| Yes | 7 | 0.34** | 0.12–0.56 | 46 | 0–76 | 0.428 |
| No | 14 | 0.43*** | 0.35–0.52 | 1 | 0–48 | |
| Control group | ||||||
| Care as usual | 13 | 0.38*** | 0.25–0.51 | 37 | 0–66 | 0.242 |
| Waiting list | 7 | 0.48*** | 0.36–0.61 | 0 | 0–58 | |
| Target group | ||||||
| Adults in general | 13 | 0.43*** | 0.33–0.53 | 24 | 0–60 | 0.350 |
| Women | 4 | 0.54** | 0.18–0.90 | 37 | 0–78 | |
| Older adults | 4 | 0.29** | 0.09–0.48 | 4 | 0–69 | |
| CBT v. other | ||||||
| CBT | 13 | 0.40*** | 0.28–0.53 | 35 | 0–65 | 0.585 |
| Other | 8 | 0.45*** | 0.33–0.57 | 0 | 0–56 | |
a. CBT, cognitive–behavioural therapy; MDD, major depressive disorder.
a. The data presented here are from analysis using the random effects model.
b. Variance between studies as a proportion of the total variance; heterogeneity tested using the I 2 statistic.
* P<0.05,
** P<0.01,
*** P<0.001.
Meta-regression analysis indicated a significant association between the effect size of the mental health component of QoL and the effect size of depressive symptoms at post-treatment measurement (slope 0.49, 95% CI 0.19–0.80, P = 0.003). The results suggested that with each increase in effect size of depressive symptom severity by 1 the effect size for the mental health component of QoL increased by 0.49 (Fig. 3). The effect size of the mental health component was not significantly related to the number of treatment sessions (slope 0.01, 95% CI −0.01 to 0.03, P = 0.544). The multivariate meta-regression analysis demonstrated that only the effect size of depression severity was a significant predictor of the effect of psychotherapy on the mental health component QoL (b = 0.50, 95% CI 0.16–0.83, P = 0.007; see Table 4).
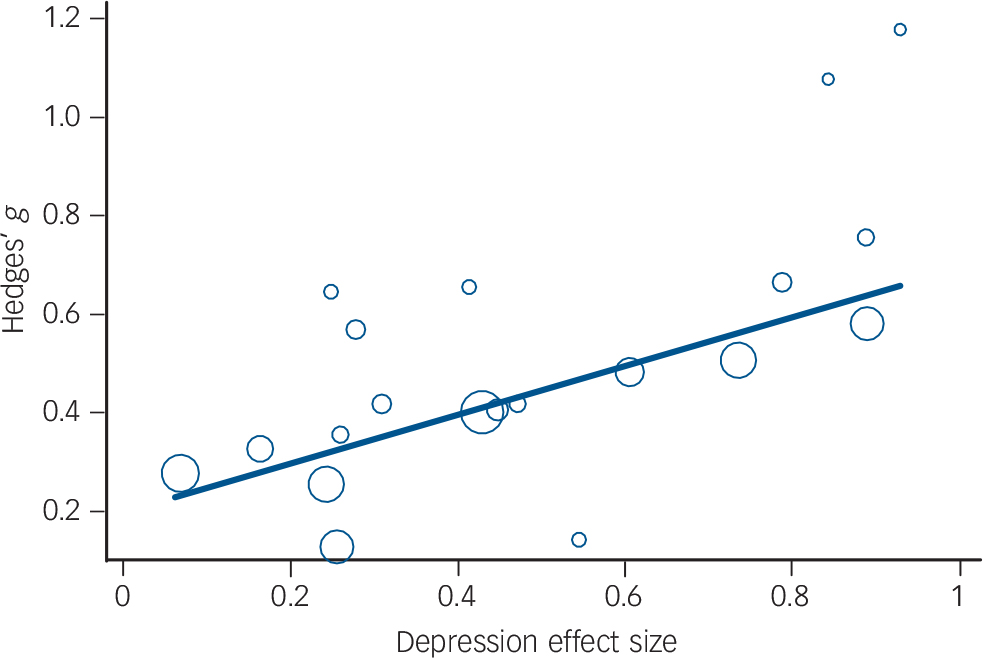
Fig. 3 Relationship between effect sizes for depressive symptom severity and the mental health component of quality of life.
Physical health
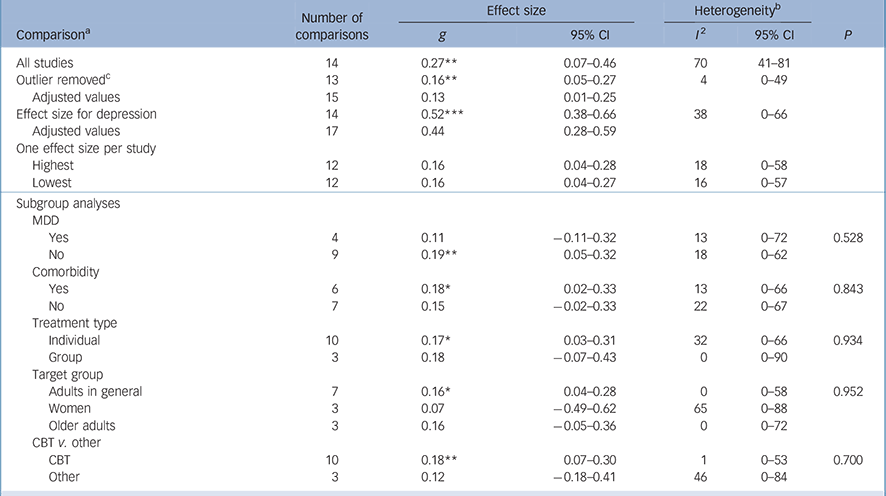
Fourteen comparisons were included in the meta-analysis of the physical health component of QoL (Table 3). The mean effect size was g = 0.27 (95% CI 0.07–0.46). We detected high between-study heterogeneity (I 2 = 70, 95% CI 41–81). We repeated the analysis after removing an outlier with an effect size of g = 2.16. Reference Scheidt, Waller, Endorf, Schmidt, Konig and Zeeck30 The pooled effect size decreased (g = 0.16, 95% CI 0.05–0.27); in addition heterogeneity was low (I 2 = 4, 95% CI 0–49). We adjusted for publication bias and the mean effect size decreased to g = 0.13 (95% CI 0.01–0.25), with two studies missing The meta-analysis including the largest effect sizes of each study resulted in an overall effect size of g = 0.16 (95% CI 0.04–0.28). Next we included the smallest effect sizes, resulting in an overall effect size of g = 0.16 (95% CI 0.04–0.27). Finally we conducted a number of subgroup analyses, but none of the included moderators was significantly associated with the effect size of the physical health component of QoL. The mean effect size of depression severity was g = 0.52 (95% CI 0.38–0.66). Heterogeneity was moderate (I 2 = 38, 95% CI 0–66). After adjustment for publication bias the mean effect size decreased to g = 0.44 (95% CI 0.28–0.59), with three missing studies.
Table 3 Physical health component of quality of life: effect sizes in meta-analysis of studies comparing psychotherapy with a control group
| Number of comparisons |
Effect size | Heterogeneity b | ||||
|---|---|---|---|---|---|---|
| Comparison a | g | 95% CI | I 2 | 95% CI | P | |
| All studies | 14 | 0.27** | 0.07–0.46 | 70 | 41–81 | |
| Outlier removed c | 13 | 0.16** | 0.05–0.27 | 4 | 0–49 | |
| Adjusted values | 15 | 0.13 | 0.01–0.25 | |||
| Effect size for depression | 14 | 0.52*** | 0.38–0.66 | 38 | 0–66 | |
| Adjusted values | 17 | 0.44 | 0.28–0.59 | |||
| One effect size per study | ||||||
| Highest | 12 | 0.16 | 0.04–0.28 | 18 | 0–58 | |
| Lowest | 12 | 0.16 | 0.04–0.27 | 16 | 0–57 | |
| Subgroup analyses | ||||||
| MDD | ||||||
| Yes | 4 | 0.11 | −0.11–0.32 | 13 | 0–72 | 0.528 |
| No | 9 | 0.19** | 0.05–0.32 | 18 | 0–62 | |
| Comorbidity | ||||||
| Yes | 6 | 0.18* | 0.02–0.33 | 13 | 0–66 | 0.843 |
| No | 7 | 0.15 | −0.02–0.33 | 22 | 0–67 | |
| Treatment type | ||||||
| Individual | 10 | 0.17* | 0.03–0.31 | 32 | 0–66 | 0.934 |
| Group | 3 | 0.18 | −0.07–0.43 | 0 | 0–90 | |
| Target group | ||||||
| Adults in general | 7 | 0.16* | 0.04–0.28 | 0 | 0–58 | 0.952 |
| Women | 3 | 0.07 | −0.49–0.62 | 65 | 0–88 | |
| Older adults | 3 | 0.16 | −0.05–0.36 | 0 | 0–72 | |
| CBT v. other | ||||||
| CBT | 10 | 0.18** | 0.07–0.30 | 1 | 0–53 | 0.700 |
| Other | 3 | 0.12 | −0.18–0.41 | 46 | 0–84 | |
CBT, cognitive–behavioural therapy; MDD, major depressive disorder.
a. The data presented here are from analysis using the random effects model.
b. Variance between studies as a proportion of the total variance; heterogeneity tested using the I 2 statistic.
c. Outlier's effect size g=2.16 (Scheidt et al). Reference Scheidt, Waller, Endorf, Schmidt, Konig and Zeeck30
* P<0.05,
** P<0.01,
*** P<0.001.
Univariate meta-regressions showed no significant association between the effect size of physical health component and the effect size of depressive symptoms (slope 0.35, 95% CI −0.12 to 0.82, P = 0.129) or the number of treatment sessions (slope 0.00, 95% CI −0.03 to 0.03, P = 0.968). Similarly, the multivariate meta-regression demonstrated that none of the predictors was significantly related to the effect of psychotherapy for depression on the physical health component of QoL at post-treatment assessment (Table 4).
Table 4 Study characteristics predicting the effect size of quality of life: multivariate meta-regression
| B | 95% CI | s.e. | P | |
|---|---|---|---|---|
| Global component | ||||
| Depression effect size | 0.37 | −0.11 to 0.85 | 0.23 | 0.122 |
| Number of sessions | −0.01 | −0.05 to 0.02 | 0.02 | 0.380 |
| Target group: adults v. elderly | 0.00 | −0.48 to 0.48 | 0.23 | 0.999 |
| Control group: care as usual v. waiting list | −0.05 | −0.34 to 0.24 | 0.14 | 0.732 |
| Control group: other v. waiting list | 0.03 | −0.26 to 0.28 | 0.13 | 0.824 |
| CBT v. other | 0.00 | −0.24 to 0.22 | 0.11 | 0.994 |
| Life review v. other | −0.23 | −0.71 to 0.25 | 0.23 | 0.326 |
| MDD | 0.12 | −0.08 to 0.32 | 0.11 | 0.272 |
| Comorbidity | −0.22 | −0.53 to 0.08 | 0.15 | 0.143 |
| Internet-based treatment | −0.11 | −0.38 to 0.15 | 0.13 | 0.370 |
| Constant | 0.34 | −0.17 to 0.85 | 0.24 | 0.177 |
| Mental health component | ||||
| Depression effect size | 0.50 | 0.16 to 0.83 | 0.15 | 0.007 |
| Number of sessions | −0.01 | −0.04 to 0.02 | 0.01 | 0.466 |
| Target group: adults v. elderly | 0.07 | −0.24 to 0.38 | 0.14 | 0.621 |
| Target group: women v. elderly | 0.22 | −0.27 to 0.70 | 0.22 | 0.345 |
| CBT v. other | 0.03 | −0.23 to 0.20 | 0.09 | 0.783 |
| MDD | 0.18 | −0.17 to 0.22 | 0.18 | 0.319 |
| Comorbidity | −0.06 | −0.30 to 0.17 | 0.11 | 0.580 |
| Constant | 0.21 | −0.15 to 0.57 | 0.17 | 0.223 |
| Physical health component | ||||
| Depression effect size | 0.34 | −1.05 to 1.73 | 0.50 | 0.535 |
| Number of sessions | 0.01 | −0.30 to 0.25 | 0.09 | 0.902 |
| Target group: adults v. elderly | −0.18 | −2.12 to 1.17 | 0.70 | 0.815 |
| Target group: women v. elderly | −0.29 | −1.66 to 1.07 | 0.49 | 0.587 |
| CBT v. other | −0.06 | −1.25 to 1.14 | 0.43 | 0.903 |
| MDD | −0.05 | −1.08 to 0.99 | 0.37 | 0.902 |
| Comorbidity | 0.05 | −1.61 to 1.71 | 0.60 | 0.935 |
| Individual treatment | −0.04 | −0.91 to 0.84 | 0.32 | 0.912 |
| Constant | 0.07 | −3.54 to 3.68 | 1.30 | 0.980 |
CBT, cognitive–behavioural therapy; MDD, major depressive disorder.
Discussion
We examined the effects of psychotherapy on QoL of people with depression, separately for global QoL and for its mental and physical health components. The results were in line with previous findings, suggesting that psychotherapy for depression is beneficial not only for depressive symptoms but also for quality of life. Reference Papakostas, Petersen, Mahal, Mischoulon, Nierenberg and Fava9,Reference McKnight and Kashdan13 Psychotherapy resulted in larger improvements in QoL than control conditions. The largest effect size was identified for the mental health component, whereas the effect size for global QoL was moderate. The smallest effect size was detected for the physical health component, which, however, included a limited number of comparisons. Nevertheless, even after excluding an outlier and adjusting for publication bias, the effect size for the physical health component remained statistically significant. Overall, it can be concluded that psychotherapy has a positive impact on various domains of a patient's life, such as mental functioning, social and work-related relationships, level of discomfort and engagement in everyday activities. Our findings, in conjunction with previous work, demonstrate the efficacy of psychotherapy for outcomes associated with depression. Reference Renner, Cuijpers and Huibers31 Particularly, the magnitude of the improvement in QoL is comparable – even though somewhat smaller – to that in social functioning of patients with depression. Reference Renner, Cuijpers and Huibers31 The influence of psychotherapy on domains of patients' lives other than the depressive symptoms is important because it can reduce the overall burden caused by the disease and decrease the risk of future depressive episodes. Reference Ezquiaga, Garcia-Lopez, de Dios, Leiva, Bravo and Montejo12,Reference Eaton, Martins, Nestadt, Bienvenu, Clarke and Alexandre32
We examined the association between QoL and depressive symptom severity by conducting various meta-regression analyses. The results were different for the global QoL and each of the two specific components of QoL. We found a significant positive relationship between the effect sizes for the mental health component and the effect sizes for depressive symptoms in the multivariate model. Nevertheless, the effect sizes for the physical health component were not related to the effect sizes for depressive symptoms. Finally, the relationship between the effect sizes for global QoL and depressive symptom severity were not statistically significant in the multivariate model. Overall, changes in QoL were not fully explained by changes in depressive symptoms. We can thus infer that decreased depressive symptom severity at the end of the treatment is not necessarily a manifestation of improvement in QoL of the patient or vice versa. This is an indication that QoL and depressive symptoms are two different constructs and that it is informative to use both as treatment outcomes. It should be highlighted that the applied research design did not allow us to determine causal or temporal relationships between QoL and depressive symptoms. A longitudinal design with repeated measurements of QoL and depressive symptoms is needed to examine whether changes in depressive symptoms lead to changes in QoL or vice versa. Reference Kazdin33
The effect sizes for depressive symptom severity were larger than the effect sizes for QoL. This finding is in line with previous studies demonstrating that impairments in QoL persist even after patients reach remission. Reference Ishak, Greenberg, Balayan, Kapitanski, Jeffrey and Fathy14,Reference Zimmerman, Chelminski, McGlinchey and Young15 As a result, distortion in daily life may endure even when deficits related to depressive symptoms have ceased. Reference Papakostas, Petersen, Mahal, Mischoulon, Nierenberg and Fava9 A possible explanation is that improvements in QoL follow a slower pace than those in depressive symptoms. Reference McKnight and Kashdan13 In addition, participants were eligible for the clinical trials because they experienced depressive symptoms and not because they reported low QoL. Therefore, they may not all have had low QoL to start with and thus had less to gain in terms of improvement in QoL. Finally, the detected difference in the effect sizes may also reflect the target of psychotherapy on reducing depressive symptom severity.
We found that the effects of psychotherapy on global QoL were larger for studies including exclusively participants with a diagnosis of major depressive disorder at baseline. Previous research has shown that deterioration of QoL is proportional to the severity of depression. Reference Demyttenaere, De Fruyt and Huygens34,Reference Berlim, Fleck, Ritsner and Awad35 Psychotherapy is therefore an effective treatment for people who experience both severe depressive symptoms and serious distress in their QoL. Furthermore, studies including adult patients yielded larger effect sizes than those including older adults. Older patients with depression demonstrate extensive age-related needs that may obstruct the efficacy of psychotherapy. Reference Fiske, Wetherell and Gatz36 In addition, debilitated QoL in older adults may be related to risk factors other than depression, which are not the explicit target of psychotherapy. Reference Rejeski and Mihalko37
Limitations of the study
The concept of QoL is inherently subjective and consequently is hard to measure with precision. It is thus possible that the different measures of QoL assessed slightly different constructs or parts of life. This limitation, however, applies mainly to the meta-analysis of global QoL where various instruments were included. The meta-analyses of the mental and physical health components were measured predominantly with the Medical Outcome Study Short Form. In addition, the number of studies in the meta-analysis of the physical health component was limited. Thus, we may have lacked adequate power to detect small effect sizes. A larger number of studies would allow us to interpret the results with more confidence, and therefore we strongly recommend the administration of measures of QoL in future clinical trials. Reference Ishak, Greenberg, Balayan, Kapitanski, Jeffrey and Fathy14 Another limitation relates to the quality of the included studies, which was not ideal. Researchers are encouraged to follow precisely the recommended guidelines for conducting and reporting randomised trials. Reference Schulz, Altman and Moher38 Moreover, a concern for every meta-analysis is the prevalence of publication bias. The test of publication bias that we performed examines only whether the funnel plot is symmetrical or whether studies with small sizes are missing. This procedure may have limited power to detect moderate publication bias and accordingly our results may overestimate the true effect size of psychotherapy on QoL. Reference Sterne, Gavaghan and Egger39 Furthermore, we examined only the short-term effects of psychotherapy; there is evidence that psychotherapy has long-term effects on depressive symptoms, Reference Cuijpers, Hollon, van Straten, Bockting, Berking and Andersson40 and it is therefore important to examine the possible long-term effects on QoL as well. Finally, we examined the effects of psychotherapy on QoL in comparison with control conditions. A meta-analysis focusing on the respective comparison between psychotherapy and pharmacotherapy for depression would be of importance.
Implications
Overall, this meta-analysis demonstrates that psychotherapy for depression is related to improvements in QoL. This evidence amplifies the notion that psychotherapy is beneficial not only for reducing depressive symptoms but also for improving additional outcomes related to depression. These effects are expected to reduce the enormous burden caused by depression and improve the lives of people with the disorder. Finally, the results indicate that QoL and depressive symptoms are two different constructs, and thus QoL could be assessed as an additional treatment outcome. Since the effects of psychotherapy are different for each component of QoL, it is informative to use specific scores for each domain, and not only an overall score for global QoL.
Acknowledgements
We thank Eirini Karyotaki, David Turner and Erica Weitz for their contribution in various parts of this meta-analysis.


eLetters
No eLetters have been published for this article.