By eliciting the explanatory models of patients and their relatives in routine clinical practice, mental health professionals can better understand the subjective experience of illness (Reference KleinmanKleinman, 1980). The past few years have witnessed an increase in the literature on beliefs about causes of schizophrenia and its treatment (Reference Angermeyer and MatschingerAngermeyer & Matschinger, 1996; Reference Banerjee and RoyBanerjee & Roy, 1998; Reference Kulhara, Avasthi and SharmaKulhara et al, 2000), but few studies have evaluated the efficacy of interventions to change explanatory models. We used a randomised controlled design to examine the effect of a structured educational programme on explanatory models of illness among the relatives of people with schizophrenia.
METHOD
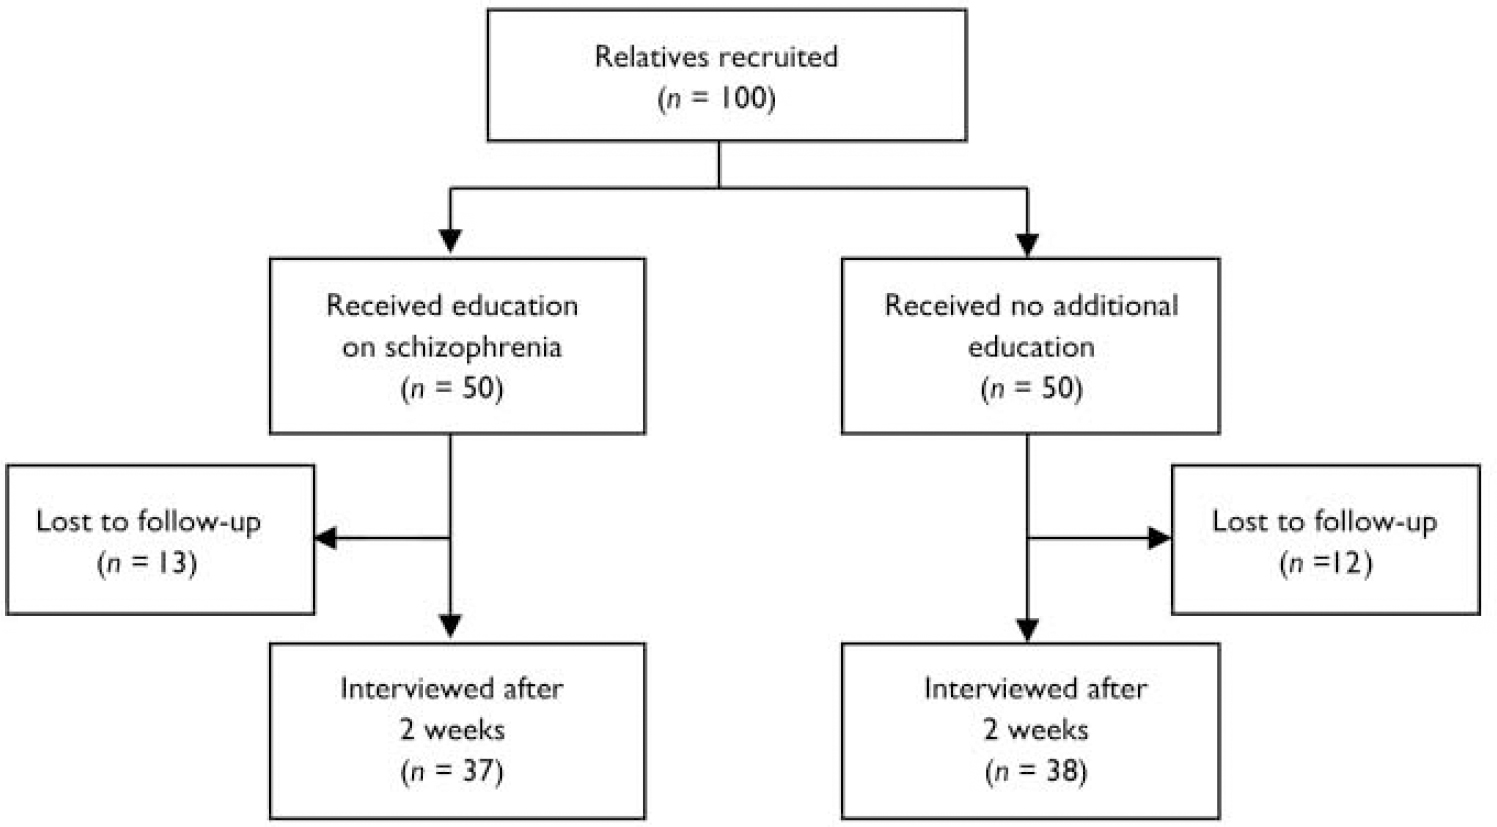
Out-patients who attended the Department of Psychiatry, Christian Medical College, Vellore, India for the first time and who satisfied ICD–10 (World Health Organization, 1993) diagnostic criteria for a research diagnosis of schizophrenia were invited to participate in the study with their relatives (Fig. 1). Patients continued to be managed by their psychiatrists. Informed consent was obtained from the relatives, who were then randomised in blocks of four, using a computer program, to a group that would receive the structured educational intervention or to a control group. Progress through the trial is shown in Fig. 1.

Fig. 1 CONSORT diagram.
The Short Explanatory Model Interview (SEMI; Reference Lloyd, Jacob and PatelLloyd et al, 1998) formed the basis of the evaluation. A vignette describing a typical patient with chronic psychosis was presented (Reference Joel, Sathyaseelan and JayakaranJoel et al, 2003). This was followed by open-ended questions to elicit the relatives’ beliefs about the perceived causes and consequences of the condition, and help-seeking behaviour. A verbatim record of the responses was made, and these were later grouped into categories using the procedure recommended by the SEMI. The Tamil version of the instrument was employed (Reference Joel, Sathyaseelan and JayakaranJoel et al, 2003). Basic demographic and clinical information was also recorded. The assessments were conducted on day 1 (baseline) and after 2 weeks of a structured educational programme in the intervention group. The research nurse who performed the evaluations was masked to the intervention status of the participants.
We developed a structured educational programme which discussed the different explanatory causal and treatment models prevalent in the region, and we also presented the biomedical perspective without dismissing or directly challenging local beliefs. This intervention had three components: exploring explanatory models; psychoeducation, aimed at teaching the relatives about the illness, symptoms, treatment and prognosis; and strategies to reduce the risk of relapse. The education package covered the following topics in two sessions: symptoms, beliefs about causation, psychosocial influences, prevalence, biomedical model, diagnosis, treatments (including medication and adherence), and coping strategies for families.
Sample size was calculated assuming that half of those who receive education and one-fifth of those who do not would consider the illness to have a medical cause by the end of the trial. For a power of 80% and 95% confidence the minimum sample required was 72 (36 in each arm). To compensate for possible loss to follow-up we recruited 100 participants.
RESULTS
A total of 100 patients and 100 relatives (one first-degree relative per patient) were contacted, all of whom agreed to take part in the study. The majority of the participants were male (56%), married (91%) and literate (80%), with a mean age of 45.3 years (s.d.=15.7). Most of the participants (60%) regarded the condition of the patient described in the vignette as a disease. Nearly all of the relatives who were interviewed (94%) felt that help should be sought from a doctor or hospital. However, a significant proportion of the relatives also attributed the patient's condition to previous deeds (43%) or to punishment by God (43%), and felt that visiting temples and places of worship could solve the problem (33%). A minority of participants attributed the patient's condition to black magic (33%) or evil spirits (10%), and felt that help should be sought from a traditional healer (5%) or a shaman (9%). The majority of participants held more than one explanatory model of illness, and many believed that there was at least one non-biomedical explanation for the patient's psychosis. The differences between the baseline socio-demographic variables and the explanatory models of the two groups were not statistically significant.
The 25 participants lost to follow-up (see Fig. 1) did not differ significantly from those assessed at 2 weeks with regard to socio-demographic variables, explanatory models at baseline, or treatment arm.
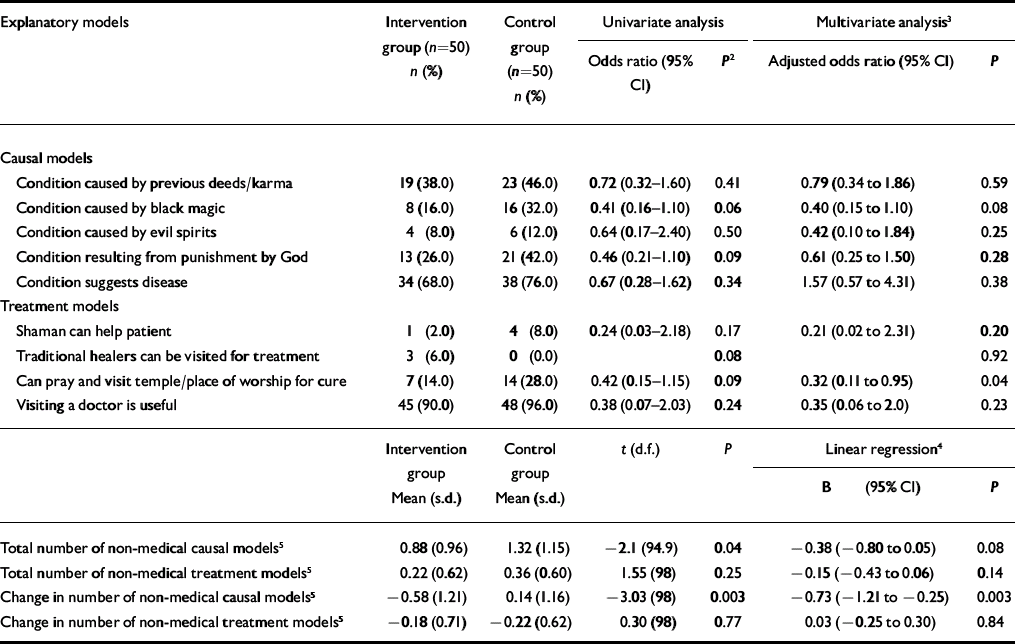
Intent-to-treat analysis of all participants (with the last observation carried forward for those who were lost to follow-up) showed that the intervention group had a statistically significant reduction in the total number of non-biomedical causal models of psychosis compared with the group of relatives who did not receive additional education (mean=0.88 (s.d.=0.96) v. 1.32 (1.15); P=0.08). The two groups also showed a significant difference with regard to change in non-medical causal models from baseline after adjusting for age, gender and literacy (mean=70.58 (s.d.=1.21) v. 0.14 (1.16); P=0.003). There were significant differences between the two groups at follow-up in the number attributing the condition to black magic (8 v. 16; P=0.08) and the number believing that visiting a place of worship would effect a cure (7 v. 14; P=0.04). However, there were no differences between the two groups with regard to non-medical treatment models of illness (see data supplement to online version of this paper). Similar results were obtained when the data for participants who completed the trial were analysed.
DISCUSSION
This study evaluated an educational intervention for psychosis and assessed its effect in the immediate follow-up period. Limitations included the drop-out rate of 25% and the lack of long-term assessment. However, the participants who were lost to follow-up did not differ significantly in terms of baseline variables from those who remained in the trial. Also, the results of an intent-to-treat analysis and analysis of those who completed the trial were similar.
The baseline data suggest that the relatives of patients with psychosis have multiple, diverse and contradictory explanatory models of illness. Participants held simultaneous beliefs in naturalistic explanations (e.g. disease) and personalistic explanations (e.g. supernatural causation, sin and punishment, karma). They also suggested that help could be sought from a range of different sources (e.g. doctor, temple or place of worship, traditional healer). Other studies of explanatory models of psychosis have reported similar findings (Reference Joel, Sathyaseelan and JayakaranJoel et al, 2003), and the issues surrounding the simultaneous holding of multiple beliefs have been discussed in the literature (Saravanan et al, Reference Saravanan, Jacob and Prince2004, Reference Saravanan, David and Bhugra2005).
The educational intervention programme used in this study discussed the local explanations for psychosis, and presented the biomedical explanatory model as an alternative. The indigenous beliefs of the participants were not challenged. The programme did not claim exclusivity or superiority of biomedical beliefs, but discussed issues relating to symptoms, disease models, medication and regular treatment. Although such issues are often raised in routine clinical practice (and the control group may also have received such information), psychoeducation does not follow a structured format, and psychiatrists tend to dismiss local explanations and to favour biomedical concepts.
The relatives who received the educational intervention showed some change in their explanatory models in the immediate follow-up period. However, many of the indigenous explanatory models persisted, especially those related to treatment. The results of this study suggest that although some explanatory models can be changed, others may be more resistant to modification. In the developing world, people with mental disorders often visit places of worship, traditional healers and psychiatric hospitals in search of both relief from symptoms and cure (Reference JacobJacob, 1999). However, it is acknowledged that holding non-biomedical beliefs about psychosis can delay the recognition of disease, prevent early institution of treatment with medication, and interfere with adherence to treatment, resulting in a poor outcome. Health education packages should discuss the advantages of medication, but should not dismiss alternative explanations of illness, as these may also help to restore mental health. Further research is needed to identify the components of the ideal health education package and maximise its effectiveness in changing explanatory models and thereby preventing relapse.
Data supplement 1 Comparison of explanatory models of psychosis after 2 weeks: intent-to-treat analysis1

| Explanatory models | Intervention group (n=50) n (%) | Control group (n=50) n (%) | Univariate analysis | Multivariate analysis3 | ||
|---|---|---|---|---|---|---|
| Odds ratio (95% CI) | P 2 | Adjusted odds ratio (95% CI) | P | |||
| Causal models | ||||||
| Condition caused by previous deeds/karma | 19 (38.0) | 23 (46.0) | 0.72 (0.32-1.60) | 0.41 | 0.79 (0.34 to 1.86) | 0.59 |
| Condition caused by black magic | 8 (16.0) | 16 (32.0) | 0.41 (0.16-1.10) | 0.06 | 0.40 (0.15 to 1.10) | 0.08 |
| Condition caused by evil spirits | 4 (8.0) | 6 (12.0) | 0.64 (0.17-2.40) | 0.50 | 0.42 (0.10 to 1.84) | 0.25 |
| Condition resulting from punishment by God | 13 (26.0) | 21 (42.0) | 0.46 (0.21-1.10) | 0.09 | 0.61 (0.25 to 1.50) | 0.28 |
| Condition suggests disease | 34 (68.0) | 38 (76.0) | 0.67 (0.28-1.62) | 0.34 | 1.57 (0.57 to 4.31) | 0.38 |
| Treatment models | ||||||
| Shaman can help patient | 1 (2.0) | 4 (8.0) | 0.24 (0.03-2.18) | 0.17 | 0.21 (0.02 to 2.31) | 0.20 |
| Traditional healers can be visited for treatment | 3 (6.0) | 0 (0.0) | 0.08 | 0.92 | ||
| Can pray and visit temple/place of worship for cure | 7 (14.0) | 14 (28.0) | 0.42 (0.15-1.15) | 0.09 | 0.32 (0.11 to 0.95) | 0.04 |
| Visiting a doctor is useful | 45 (90.0) | 48 (96.0) | 0.38 (0.07-2.03) | 0.24 | 0.35 (0.06 to 2.0) | 0.23 |
| Intervention group Mean (s.d.) | Control group Mean (s.d.) | t (d.f.) | P | Linear regression4 | ||
| B (95% CI) | P | |||||
| Total number of non-medical causal models5 | 0.88 (0.96) | 1.32 (1.15) | -2.1 (94.9) | 0.04 | -0.38 (-0.80 to 0.05) | 0.08 |
| Total number of non-medical treatment models5 | 0.22 (0.62) | 0.36 (0.60) | 1.55 (98) | 0.25 | -0.15 (-0.43 to 0.06) | 0.14 |
| Change in number of non-medical causal models5 | -0.58 (1.21) | 0.14 (1.16) | -3.03 (98) | 0.003 | -0.73 (-1.21 to -0.25) | 0.003 |
| Change in number of non-medical treatment models5 | -0.18 (0.71) | -0.22 (0.62) | 0.30 (98) | 0.77 | 0.03 (-0.25 to 0.30) | 0.84 |


eLetters
No eLetters have been published for this article.