1 INTRODUCTION
One of the highlights of the Compton Gamma-Ray Observatory (CGRO) mission (1991–2000) was the discovery that members of the blazar class of compact, bright, and flat-spectrum radio sources had spectral energy distributions extending up to—and in some cases dominated by—GeV gamma-ray energies. Studies of gamma-ray bright active galactic nuclei (AGN) are continuing with observations using the AGILE (Tavani et al. Reference Tavani2009) and Fermi (Acero et al. Reference Acero2015) satellites.
The third EGRET catalog (3EG: Hartman et al. (Reference Hartman1999)) contained 271 sources above 100 MeV: the LMC, five pulsars, a solar flare, the radio galaxy Cen A, 66 high-confidence identifications of blazars, and 27 lower-confidence potential blazar identifications, with the majority of sources being unidentified. The observations described here were originally inspired by a re-examination of the 3EG data-set by Mattox et al. (Reference Mattox, Hartman and Reimer2001), who made a more rigorous determination of the probability of radio source associations with EGRET sources.
Mattox et al. (Reference Mattox, Hartman and Reimer2001) used Bayes’ theorem with an a priori probability for an EGRET detection of a radio source (based on earlier strong EGRET detections) and the angular separation between the radio source and the EGRET position, r, to determine the a posteriori probability that a radio source was the correct identification of an EGRET source. Mattox et al. (Reference Mattox, Hartman and Reimer2001) found that 45 of the 66 ‘high-confidence’ 3EG identifications had a high probability of being correct, generally with p(id|r) > 0.70. In addition, Mattox et al. (Reference Mattox, Hartman and Reimer2001) found the remaining 21 ‘high-confidence’ 3EG identifications were plausible identifications, with p(id|r) > 0.04. Of the 27 lower-confidence 3EG identifications, Mattox et al. (Reference Mattox, Hartman and Reimer2001) found one had a high probability of being correct, three were plausible identifications, but the remaining 23 identifications were implausible. Furthermore, they found 15 plausible identifications which had not been suggested previously.
VLBI observations are of particular importance in understanding the mechanisms at work in producing high energy gamma-ray emission, by virtue of the milli-arcsecond angular resolution achievable, which translates to parsec-scale linear resolution in AGN. VLBI observations have shown that the apparent superluminal motions in gamma-ray sources are faster than for the general population of bright compact radio sources (Jorstad et al. Reference Jorstad2001; Lister et al. Reference Lister2009), the VLBI core flux density is correlated with gamma-ray flux (Jorstad et al. Reference Jorstad2001; Kovalev Reference Kovalev2009), and gamma-ray flares (or state of enhanced emission) are associated with the ejection of a new superluminal component (Jorstad et al. Reference Jorstad2001).
This paper is the third a series of VLBI observations of southern gamma-ray sources: paper I (Tingay et al. Reference Tingay1996) contained first-epoch VLBI images of PKS 0208−512, PKS 0521−365, and PKS 0537−441, and paper II (Tingay et al. Reference Tingay, Murphy and Edwards1998) included VLBI images of an additional six southern sources and investigated the suggestion that jet bending played an important role in gamma-ray sources—a topic revisited more recently by Graham & Tingay (Reference Graham and Tingay2014).
Early studies were limited by the relatively sparse EGRET observations of sources, and the associated difficulty in determining when a gamma-ray high-state peaked, and how long it lasted. The launch of the Fermi satellite in 2008, with its ability to survey the whole sky every day with improved sensitivity and angular resolution has overcome this problem, and has led to a number of detailed studies of the VLBI properties of gamma-ray sources (Lister et al. Reference Lister2009, Reference Lister2016; Kovalev et al. Reference Kovalev2009; Ojha et al. Reference Ojha2010; Arshakian et al. Reference Arshakian2012).
Throughout the paper, we use a cosmology with H
0 = 70 km s−1 Mpc−1, Ωm = 0.29, and
![]() $\Omega _\Lambda = 0.71$
, and define spectral index, α, using the convention S ∝ ν+α, where the symbols have their usual meanings.
$\Omega _\Lambda = 0.71$
, and define spectral index, α, using the convention S ∝ ν+α, where the symbols have their usual meanings.
2 OBSERVATIONS
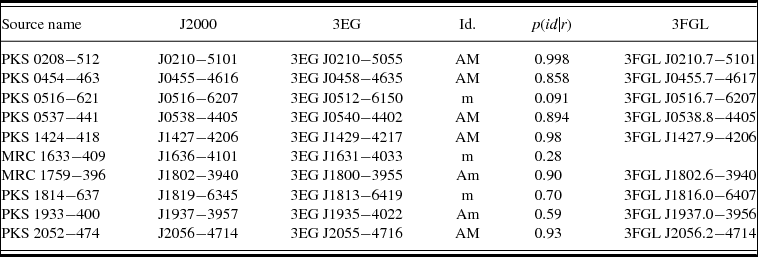
For the observations described here, we selected the highest probability associations with δ < −30° of Mattox et al. (Reference Mattox, Hartman and Reimer2001). Seven of these were considered high-confidence identifications in the third EGRET catalog, although Mattox et al. concluded that only five were high-confidence associations, with the remaining five being the most probable of their plausible identifications. The ten sources observed are listed in Table 1, which includes B1950 and J2000 names for the radio sources, the 3EG name (Hartman et al. Reference Hartman1999), the 3EG and Mattox et al. degree of confidence in the association, probability for the association based on the Mattox et al. criteria, and the 3FGL source name (Acero et al. Reference Acero2015) associated with the 3EG source. Mattox et al. identified two other sources in the declination range with lower probability plausible associations, PMN J0726−4728 and PKS 1221−829. These were not included in these VLBI observations but are considered further in Section 4.
Table 1. Details of the sources observed. The confidence of the identification is denoted by ‘A’ for a high-confidence association, and ‘a’ for a lower confidence association, in the 3EG catalog (Hartman et al. (Reference Hartman1999)), and ‘M’ and ‘m’ for high and lower confidence associations by Mattox et al. (Reference Mattox, Hartman and Reimer2001). The p(id|r) is that given by Mattox et al. (Reference Mattox, Hartman and Reimer2001) — see text for details. The 3FGL associations with the 3EG sources are from Acero et al. (Reference Acero2015) and Ackermann et al. (Reference Ackermann2015). Note that PKS 1814−637 is not most likely association with 3FGL J1816.0−6407 (see Section 3.8).
Several of the high-confidence detections have been studied previously with Long Baseline Array (LBA) observations (e.g., PKS 0208–512 and PKS 0537–441: Tingay et al. Reference Tingay1996), and the observations presented here help to track jet component motions in these sources. For other sources, these first epoch observations are being followed up by later TANAMI (Tracking Active Galactic Nuclei with Austral Milliarcsecond Interferometry) observations (Ojha et al. Reference Ojha2010) to achieve this goal.
The LBA observations presented here, of five high-confidence EGRET identifications and five of the more probable ‘plausible’ identifications, enable us to examine the source morphology and study radio properties including core brightness temperature and core dominance. The observations were conducted with the LBA (Edwards & Phillips Reference Edwards and Phillips2015) over a period of 24 h commencing on 2001 November 10 under the observation code V151. The telescopes participating in the observations were Ceduna 30 m (System Equivalent Flux Density (SEFD) 450 Jy), Hartebeesthoek 26 m (SEFD 290 Jy), Hobart 26 m (SEFD 640 Jy), Mopra 22 m (SEFD 350 Jy), Parkes 64 m (SEFD 110 Jy), and a ‘tied array’ of 5 × 22 m antennas of the Australia Telescope Compact Array (SEFD 70 Jy). Observations were conducted with a 16 MHz bandwidth centred at 4.817 GHz, with two polarisations and 2-bit digitisation, for a total bit-rate of 128 Mbps per antenna. Data were recorded using the S2 tape-based system and correlated at the ATNF headquarters in Sydney (Wilson et al. Reference Wilson, Roberts, Davis and King1996).
Data were fringe-fit in AIPSFootnote 1 using the standard procedures, and imaged using the Difmap package (Shepherd Reference Shepherd, Hunt and Payne1997). For details of the calibration and imaging process, please see Section 3 of Ojha et al. (Reference Ojha2010).
3 RESULTS
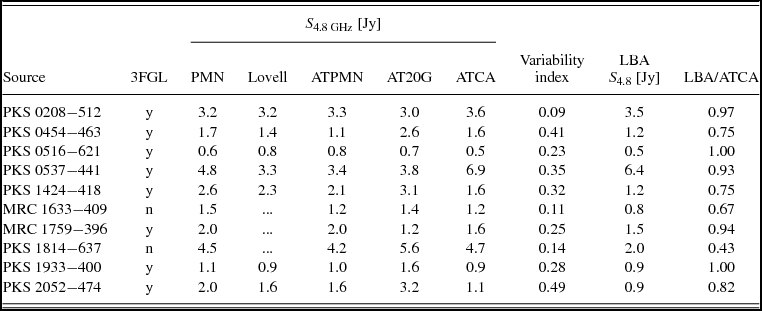
In Table 2, we present the results of model-fitting the data, and Table 3 provides a comparison of catalogued total flux densities for these sources with those measured in our observations, and a measurement of the core dominance of the sources.
Table 2. VLBI mode-fitting results from our 4.8 GHz LBA observations. Source frame brightness temperatures are given for sources for which a redshift is known: for MRC 1633−409 the observer frame brightness temperature is listed.
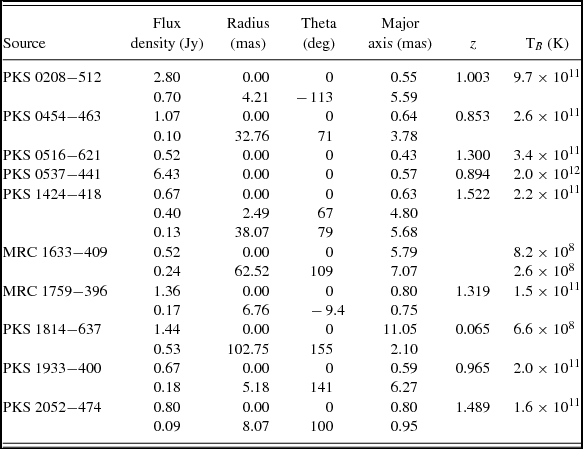
Table 3. Variability and core dominance for each radio source. The 3FGL column indicates whether the radio source has been associated with a gamma-source in the 3FGL catalog (Acero et al. Reference Acero2015). Radio flux densities are from Wright et al. (Reference Wright, Griffith, Burke and Ekers1994) for PMN, Lovell (1997), McConnell et al. (Reference McConnell, Sadler, Murphy and Ekers2012) for ATPMN, and Murphy et al. (Reference Murphy2010) for AT20G. The ATCA flux densities are from the observations presented here. The errors on radio flux densities are 5% or less. See text for details of the variability index.
Contour plots of our ten observed sources are shown in Figures 1 through 11 with the FWHM Gaussian restoring beam shown as a hatched ellipse in the lower left. All except one image is made with natural weighting, which gives the same weight to all the visibility data points and delivers the highest SNR. The exception is Figure 10, where a lower resolution image of PKS 1814−637 is shown to better recover its diffuse structure. This was achieved by down-weighting the data on the longest baselines, i.e., (u, v)-tapering. All images are contoured down to the level where the first negative contours appear (typically at between five and seven times the rms noise) since that gives a realistic idea of what structures are robustly detected.
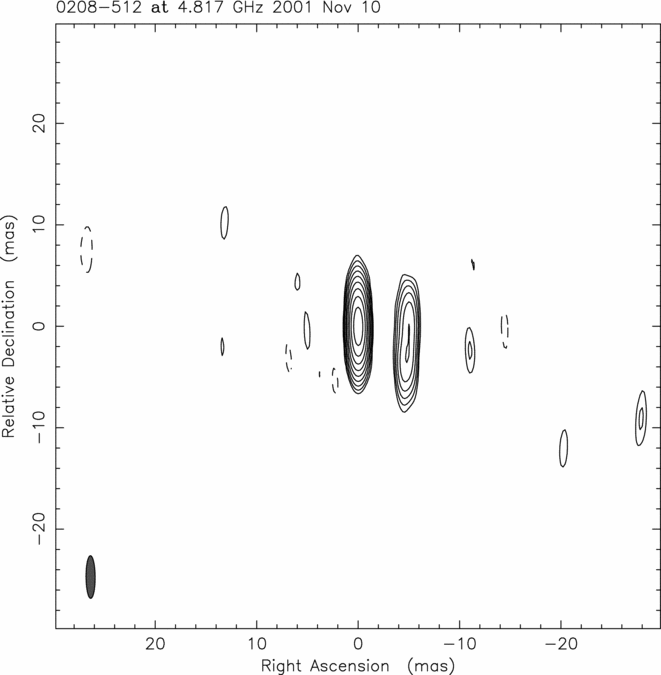
Figure 1. VLBI image of PKS 0208−512: the image peak is 2.4 Jy beam−1, contours are (−1, 1, 2, 4, 8,. . ., 256) × 5.8 mJy beam−1, and the beam FWHM is 4.5 × 0.9 mas at position angle 0.3°. The rms noise level in the image is 1.0 mJy beam−1.
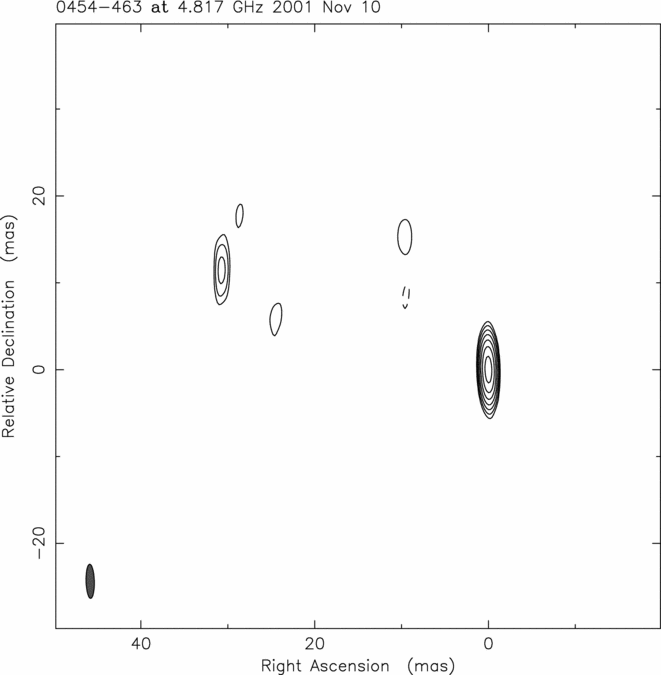
Figure 2. VLBI image of PKS 0454−463: the image peak is 0.86 Jy beam−1, contours are (−1, 1, 2, 4, 8,. . ., 64) × 9.4 mJy beam−1, and the beam FWHM is 3.9 × 1.0 mas at position angle 1.6°. The rms noise level in the image is 1.8 mJy beam−1.
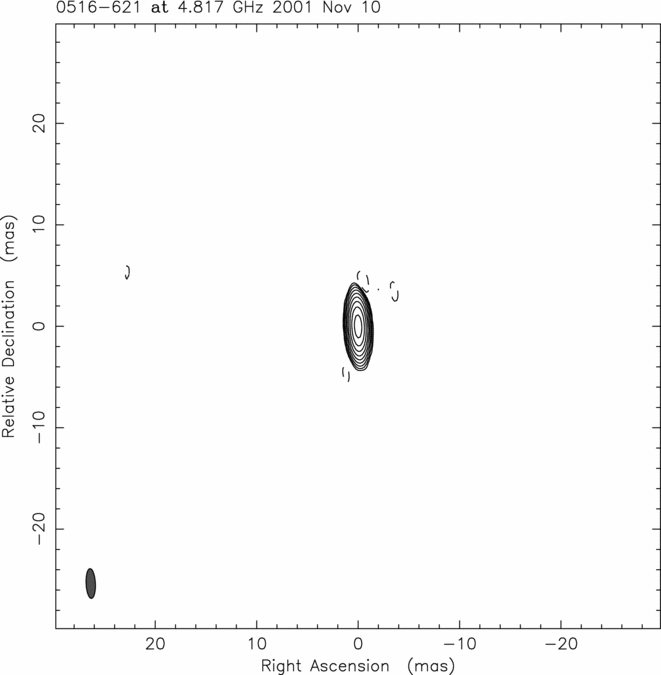
Figure 3. VLBI image of PKS 0516−621: the image peak is 0.46 Jy beam−1, contours are (−1, 1, 2, 4, 8,. . ., 256) × 1.2 mJy beam−1, and the beam FWHM is 2.9 × 0.9 mas at position angle 2.7°. The rms noise level in the image is 0.2 mJy beam−1.
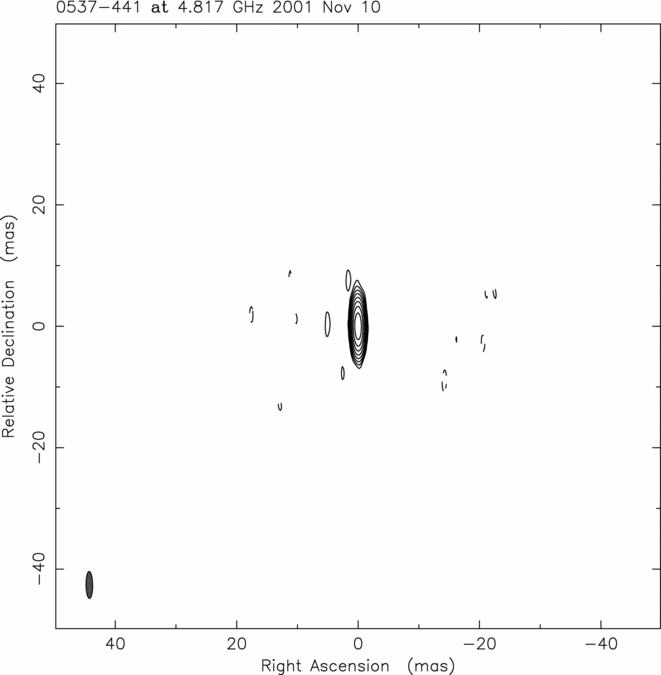
Figure 4. VLBI image of PKS 0537−441: the image peak is 5.51 Jy beam−1, contours are (−1, 1, 2, 4, 8,. . ., 128) × 24.1 mJy beam−1, and the beam FWHM is 4.4 × 1.1 mas at position angle 0.7°. The rms noise level in the image is 3.3 mJy beam−1.
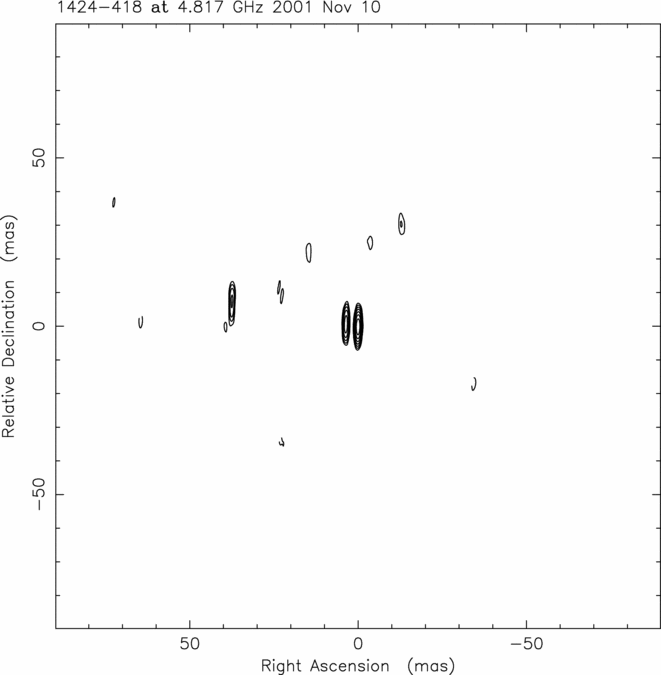
Figure 5. VLBI image of PKS 1424−418: the image peak is 0.65 Jy beam−1, contours are (−1, 1, 2, 4, 8,. . ., 64) × 5.8 mJy beam−1, and the beam FWHM is 4.8 × 1.0 mas at position angle −1.4°. The rms noise level in the image is 1.1 mJy beam−1.
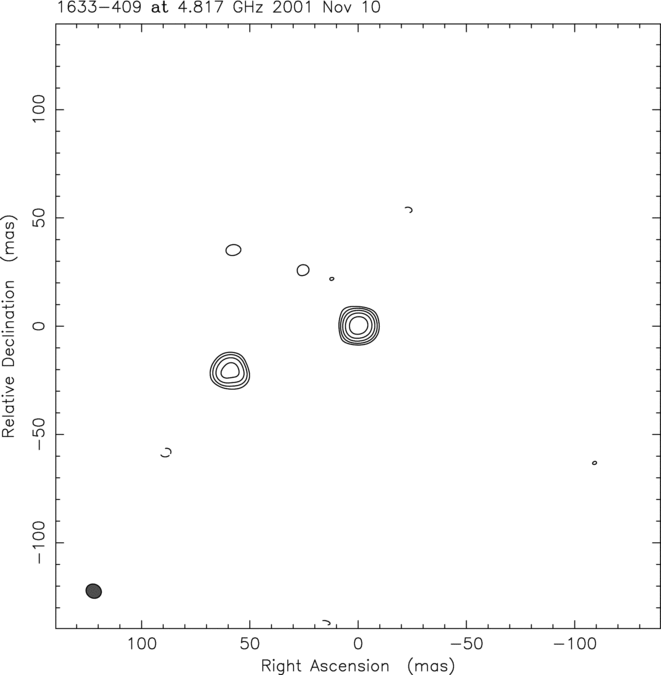
Figure 6. VLBI image of MRC 1633−409: the image peak is 0.30 Jy beam−1, contours are (−1, 1, 2, 4, 8, 16) × 10.8 mJy beam−1, and the beam FWHM is 7.3 × 6.4 mas at position angle 61.6°. The rms noise level in the image is 1.5 mJy beam−1.
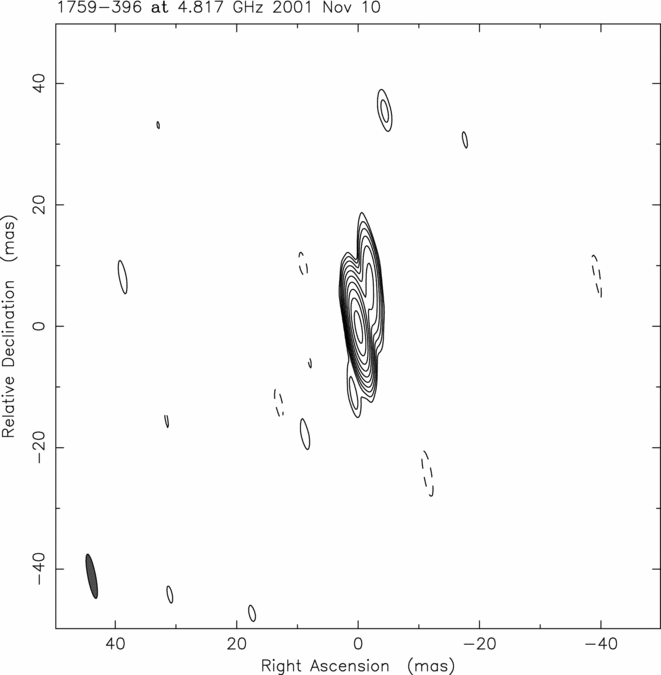
Figure 7. VLBI image of MRC 1759−396: the image peak is 1.07 Jy beam−1, contours are (−1, 1, 2, 4, 8,. . ., 512) × 1.5 mJy beam−1, and the beam FWHM is 7.4 × 1.3 mas at position angle 10.9°. The rms noise level in the image is 0.2 mJy beam−1.
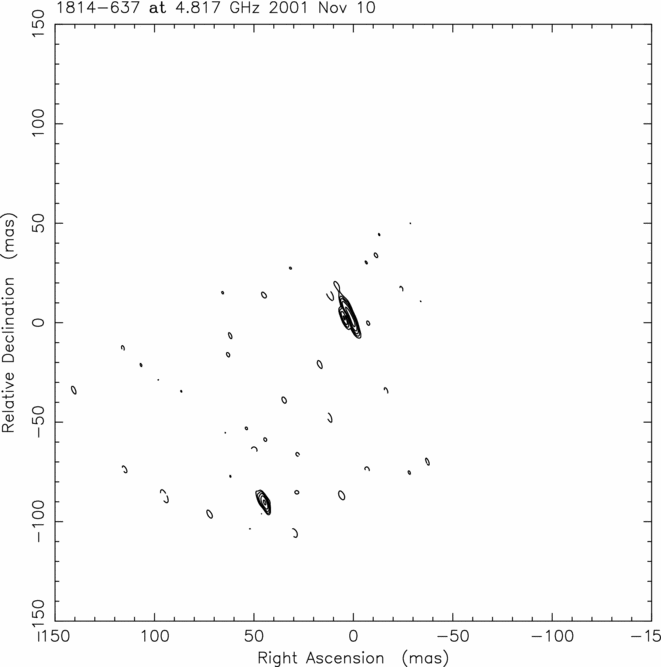
Figure 8. VLBI image of PKS 1814−637: the image peak is 0.47 Jy beam−1, contours are (−1, 1, 2, 4, 8, 16) × 21.8 mJy beam−1, and the beam FWHM is 6.5 × 1.7 mas at position angle 22.3°. The rms noise level in the image is 1.9 mJy beam−1.
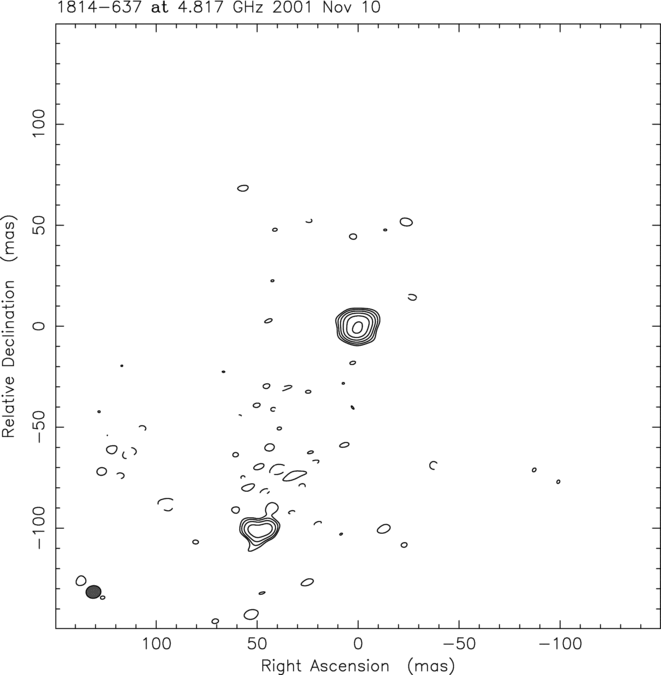
Figure 9. A lower resolution image of PKS 1814−637, with an image peak of 0.76 Jy beam−1, contours of (−1, 1, 2, 4, 8, 16, 32) × 20.2 mJy beam−1, and beam FWHM 7.4 × 6.3 mas at position angle −81.7°. The rms noise level in the image is 1.8 mJy beam−1.
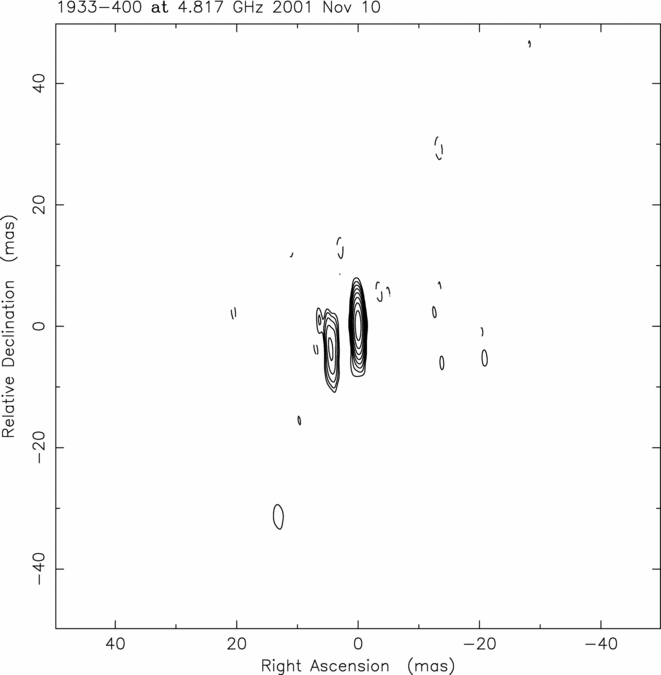
Figure 10. VLBI image of PKS 1933−400: the image peak is 0.58 Jy beam−1, contours are (−1, 1, 2, 4, 8,. . ., 128) × 2.7 mJy beam−1, and the beam FWHM is 5.0 × 0.9 mas at position angle 2.4°. The rms noise level in the image is 0.4 mJy beam−1.
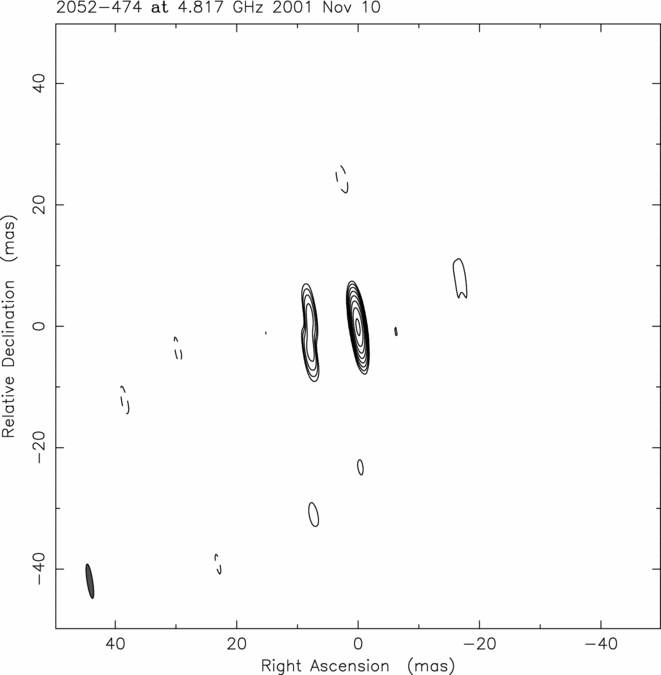
Figure 11. VLBI image of PKS 2052−474: the image peak is 0.59 Jy beam−1, contours are (−1, 1, 2, 4, 8,. . ., 128) × 3.9 mJy beam−1, and the beam FWHM is 5.7 × 0.9 mas at position angle 8.8°. See text for a comparison of this image with others. The rms noise level in the image is 0.8 mJy beam−1.
Image fidelity is determined by on-source reconstruction errors, which depend in a complicated manner on factors like the source brightness distribution and the (u, v)-coverage, rather than the dynamic range and so VLBI image contours are presented down to a level when negative contours appear which provides a better sense of how trustworthy observed structures are. Since the LBA is not a planned array, the biggest constraint on the fidelity of these images are the gaps in (u, v)-coverage, especially the absence of intermediate baselines between the shorter intra-Australian and the trans-oceanic ones to South Africa.
In the following subsections, we consider each source in detail.
3.1. PKS 0208−512
VLBI observations of this bright gamma-ray source have previously been reported by Preston et al. (Reference Preston1985) at 2.3 GHz, Tingay et al. (Reference Tingay1996) and Shen et al. (Reference Shen1998) at 4.8 GHz, Tingay et al. (Reference Tingay2002) at 4.8 and 8.4 GHz, and Ojha et al. (Reference Ojha2004) at 8.4 GHz. These are all consistent with a bright core and a jet extending at a position angle of ~−120°. This is similar to the kpc-scale jet seen in ATCA observations of Marshall et al. (Reference Marshall2005).
Our observations reveal a single jet component, 4.2 mas from the core. It is possible that this is the same component seen ~2 mas from the core in the 1998 VSOP observation of Tingay et al. (Reference Tingay2002), and component seen at ~7 mas in the first-epoch TANAMI image (Ojha et al. Reference Ojha2010). This ~0.5 masyr−1 motion corresponds to ~26c for the redshift of 1.003 (Peterson et al. Reference Peterson, Jauncey, Condon and Wright1976; Scarpa & Falomo Reference Scarpa and Falomo1997). (A redshift of 0.032, derived from the 6dF survey (Jones et al. Reference Jones2009), appears in the literature for this source, but we do not find compelling evidence for this.) Blanchard (Reference Blanchard2013) considers six epochs of LBA data taken between 2007 and 2010 and derives an apparent motion of 0.42 mas yr−1 for this component, corresponding to 22c, confirming its highly superluminal nature.
3.2. PKS 0454−463
The 8.4 GHz observations of Ojha et al. (Reference Ojha2004) only detected the core of this z = 0.858 active galaxy (Wisotzki et al. Reference Wisotzki2000). Our observations reveal a 1.1 Jy core with 0.1 Jy jet component 33 mas from the core at a position angle of 71°. This has subsequently been confirmed by the first TANAMI observation, which shows faint extended emission in the same direction (Ojha et al. Reference Ojha2010). The kiloparsec scale structure, imaged by Marshall et al. (Reference Marshall2011), is oriented along position angles of approximately −50° and 130° (although the south-eastern jet then bends further to the south). Such misalignment between parsec- and kpc-scale structure is not uncommon (see, e.g., Pearson & Readhead Reference Pearson and Readhead1988) and may arise from some combination of projection effects, jet precession, or major disruption of the AGN core resulting in reorientation of the jet axis.
3.3. PKS 0516−621
PKS 0506−612 was tentatively suggested as the counterpart to 3EG J0512−6150 in the third EGRET catalog, but Mattox et al. (Reference Mattox, Hartman and Reimer2001) concluded PKS 0516−621 was the more likely counterpart. This has been borne out by Fermi observations, which identify PKS 0516−621 with 3FGL J0516.7−6207 (Acero et al. Reference Acero2015) (although the limited angular resolution of EGRET does not preclude the possibility of PKS 0506−612, or both sources, contributing to the 3EG source). Only the core of PKS 0516−621 is detected in our observation, which contains all the ATCA flux density (see Table 3), confirming this as a very core-dominated object. A redshift of 1.300 has been measured for this source (Shaw et al. Reference Shaw2013).
3.4. PKS 0537−441
This is another well-studied southern source, with z = 0.894 (Peterson et al. Reference Peterson, Jauncey, Condon and Wright1976), and imaged by Preston et al. (Reference Preston1985) at 2.3 GHz, Tingay et al. (Reference Tingay1996) at 4.8 and 8.4 GHz, and Shen et al. (Reference Shen1998) at 4.8 GHz. Tingay et al. (Reference Tingay2002) combined a VSOP 4.8 GHz observation with geodetic 2.3/8.4 GHz observations to derive tentative evidence of jet motion of ~0.1 mas yr−1. Our observations find the source to be strongly core dominated at this epoch, with no jet structure evident.
3.5. PKS 1424−418
Preston et al. (Reference Preston1985) modelled their 2.3 GHz data with a 1.4 Jy core and a jet component 23 mas from the core at a position angle of 56°. Tingay et al. (Reference Tingay2002) found a shorter jet extending ~2 mas from the core along a similar position angle. The 4.8 GHz VLBA snapshot survey of Fomalont et al. (Reference Fomalont2000) detected only a 3.3 Jy core component in their 1996 June observations. More recently, Kadler et al. (Reference Kadler2016) have considered this source as the origin of a PeV neutrino detected with the IceCube experiment. Their LBA images show a jet position angle consistent with that obtained here.
Shen et al. (Reference Shen1998) imaged their 1993 May 4.8 GHz data and reported a 1.4 Jy core and faint jet component 2.7 mas from the core but on the opposite side of core to the components seen in other images. This has been noted for a small number of other sources in that survey (Fomalont et al. Reference Fomalont2000) and a 180° error in position angle can result when attempting to image weak components using self-calibration and poorly constrained CLEAN due to sparse (u, v) coverage (see also Section 3.10)
Our results yield two components of comparable flux density separated by 2.5 mas, with a fainter third component 38 mas from the core. Piner et al. (Reference Piner2012) analysed multi-epoch data taken between 1997 and 2003 and found a persistent component ~2.8 mas from the core for which they derived an apparent speed of 15 ± 49 μ as yr−1, corresponding to 1.1 ± 3.5 c for a redshift of 1.522 White et al. (Reference White1988).
The more recent TANAMI results indicate a one-sided jet that is very diffuse and resolved, with the largest apparent opening angle of the 43 sources examined in Ojha et al. (Reference Ojha2010).
3.6. MRC 1633−409
MRC 1633−409 was considered to be a plausible association with 3EG J1631−4033 by Mattox et al. (Reference Mattox, Hartman and Reimer2001). Our image shows two components of similar size and separated by 63 mas. These two components only account for a little over half the total flux density, indicating the presence of more extended emission that is being resolved out on the VLBI baselines. The identification of Mattox et al. relied on the relatively large flux density (the PMN flux density of 1.46 Jy was used) however, no spectral index information was available. We are now able to use flux densities of 1.39 ± 0.07 Jy at 4.8 GHz, 1.099 ± 0.05 Jy at 8.4 GHz and 0.78 ± 0.04 Jy at 20 GHz (Murphy et al. Reference Murphy2010) to determine a spectral index of approximately −0.4 over this range.
However, there is no 3FGL source in this vicinity. While the class of gamma-ray emitting AGN are variable, we note that 3EG J1631−4033 only just met the criteria for inclusion in the third EGRET catalog ((TS)0.5 ⩾ 5.0 for sources with |b| < 10°). As shown in Table 2, the brightness temperatures for the two components in this source are significant lower than for the confirmed gamma-ray sources.
3.7. MRC 1759−396
A redshift of 0.296 appears in the literature for this source (Liang & Liu Reference Liang and Liu2003), without attribution (and possibly from confusion with 1725 + 044). We adopt, here, the value from the Roma–BZCAT (Massaro et al. Reference Massaro2009) of 1.319. Our data can be modelled by a 1.36 Jy core with a 0.17 Jy jet component 6.7 mas away at a position angle of −9°. This is confirmed by the first-epoch TANAMI image (Ojha et al. Reference Ojha2010), which shows a broad jet emerging from the core at a similar position angle, with an extended component ~10 mas from the core at a slightly larger position angle.
3.8. PKS 1814−637
The puzzling nature of the parsec-scale morphology of this low-redshift (z = 0.065, Holt et al. Reference Holt, Tadhunter and Morganti2008) object was resolved by Ojha et al. (Reference Ojha2010). The 2.3 GHz image of Tzioumis et al. (Reference Tzioumis2002) is dominated by two extended components about 250 mas apart, with a weak component between the two. However, at 8.4 GHz Ojha et al. (Reference Ojha2004) detected just two 0.4 Jy components, 97 mas apart. The structure in our image is very similar, with a brighter, more extended component to the north and a more compact component 103 mas to the south. Ojha et al. (Reference Ojha2010) point out that the 8.4 GHz observation of Ojha et al. (Reference Ojha2004) did not detect the more extended southernmost component visible at 2.3 GHz, and the same is true of our 4.8 GHz observation. It appears the core is quite self-absorbed at 2.3 GHz, where the extended lobes dominate, but at the higher frequencies much of the lobe structure is resolved out with the core becoming more dominant. PKS 1814−637 is considered in more detail by Morganti et al. (Reference Morganti2011).
The two images of 1814–637 have higher contour levels than most of the others because in this object the structure is much further away from the phase centre and errors from frequency and time smearing are worse. Additionally, the complex structure in this source accentuates the limitations of (u, v)-coverage.
The association of 1814−637 with 3EG J1813−6419 was influenced by the fact it is a 4.5 Jy source at 4.8 GHz. Edwards (Reference Edwards2005) noted that the radio spectrum (α ~ −0.8) was steeper than the majority of identifications, and pointed out the flatter-spectrum PMN J1807−6413 (S 5 = 171 ± 11 mJy) as an alternative counterpart. However, the improved angular resolution of Fermi has allowed a better localisation of a gamma-ray source in this region of the sky, with 2FGL J1815.6−6407 being associated with the fainter, but inverted spectrum, source PMN J1814−6412 (Ackermann et al. Reference Ackermann2011). AT20G observations showed PMN J1814−6412 to have flux densities of 63 ± 3 mJy at 4.8 GHz 92 ± 5 mJy at 8.4 GHz, and 119 ± 6 mJy at 20 GHz, in May/June 2006 (Murphy et al. Reference Murphy2010), with this inverted spectrum being typical for gamma-ray sources. The gamma-ray source was catalogued as 3FGL J1816.0−6407 in the third Fermi catalog, but PMN J1814−6412 did not meet the criteria for association with the 3FGL source in the 3LAC catalog (Ackermann et al. Reference Ackermann2015). Although 3FGL J1816.0−6407 is ~10 arcmin from PMN J1814−6412, the properties of the radio source lend some confidence to the association.
3.9. PKS 1933−400
Mattox et al. (Reference Mattox, Hartman and Reimer2001) listed two potential associations for 3EG J1935−4022: PKS 1929−397 (J1933−3940) and PKS 1933−400 (J1937−3957). Edwards (Reference Edwards2005) examined these in more detail and concluded that, based on source compactness, the latter was much more likely to be the correct association. This appears to be the case, with the Fermi source 3FGL J1937.0−3956 being identified with PKS 1933−400 (Acero et al. Reference Acero2015; Ackermann et al. Reference Ackermann2015) (although the 3FGL catalog does not formally associate the source with 3EG J1935−4022.) Our LBA image shows a 670 mJy core with 180 mJy jet component 5.2 mas from the core, similar to the 1996 June VLBA snapshot observation of Fomalont et al. (Reference Fomalont2000). The more sensitive 8 GHz TANAMI observations of Ojha et al. (Reference Ojha2010) resulted in the detection of several components along a jet at a similar position angle.
Associating the 4 mas jet component of Fomalont et al. (Reference Fomalont2000) with our 5.2 mas component suggests an apparent speed of ~10c for this z = 0.965 source (Drinkwater et al. Reference Drinkwater1997), however, the first-epoch TANAMI image would require an even higher speed if the same component remains visible over the 11 yr spanned by these observations: a reliable determination must await more data.
3.10. PKS 2052−474
The 8.4 GHz image of Ojha et al. (Reference Ojha2004) contains a 0.38 Jy core with a 0.10 Jy jet component at a distance of 0.7 mas at a position angle of −66°, and jet structure is seen at a similar position angle by Ojha et al. (Reference Ojha2010). Our 4.8 GHz image has a 0.80 Jy core with a 0.09 Jy secondary component (the weakest feature in any of our images) appearing 8 mas to the east, i.e., the opposite side of the core compared to the 8.4 GHz images. It is most likely that this weak component is an imaging artifact arising in a similar manner to those discussed in the section on PKS 1424−418.
PKS 2052−474 (z = 1.489, Jauncey et al. Reference Jauncey, Batty, Wright, Peterson and Savage1984) is another example of a source with misaligned parsec- and kpc-scale structure: Marshall et al. (Reference Marshall2005) show the kpc jets emerge at PAs of approximately −25° and −150°.
4 OTHER SOUTHERN SOURCES
In this section, we consider two other southern sources considered to be high probability associations by Mattox et al. but which were not included in our LBA imaging.
4.1. PMN J0726−4728
Mattox et al. (Reference Mattox, Hartman and Reimer2001) considered this a plausible association for 3EG J0724−4713, with p(id|r) = 0.07, based on the PMN flux density of 593 ± 32 mJy (Wright et al. Reference Wright, Griffith, Burke and Ekers1994), though no spectral index information was available at the time. Tornikoski et al. (Reference Tornikoski, Lähteenmäki, Lainela and Valtaoja2002) measured a flux density of 340 ± 77 mJy at 90 GHz, suggesting a relatively flat spectrum between 5 and 90 GHz. Subsequently, AT20G follow-up observations provided simultaneous measurements of 349 mJy at 4.8 GHz and 351 mJy at 8.4 GHz (Murphy et al. Reference Murphy2010), and thus a spectral index of 0.01, strengthening the likelihood of the association. PMN J0726−4728 is considered to be the counterpart of 3FGL J0726.6−4727 (Acero et al. Reference Acero2015; Ackermann et al. Reference Ackermann2015).
4.2. PKS 1221−829
Similarly, Mattox et al. (Reference Mattox, Hartman and Reimer2001) suggested PKS 1221−829 as a plausible association for 3EG J1249−8330, with a PMN flux density of 797 ± 42 mJy and a (non-contemporaneous) spectral index of 0.5 yielding p(id|r) = 0.08. AT20G follow-up observations resulted in 783 ± 39 mJy at 4.8 GHz, 755 ± 38 mJy at 8.4 GHz, 685 ± 29 mJy at 20 GHz (Murphy et al. Reference Murphy2010), for a spectral index of −0.12.
The third Fermi catalog associates 3FGL J1224.6−8312 with PKS 1221−829 (Acero et al. Reference Acero2015; Ackermann et al. Reference Ackermann2015). Ojha et al. (Reference Ojha2004) present an image of this source, detecting a single component with a flux density 0.766 Jy, indicating a highly core dominated source.
5 DISCUSSION
5.1. Counterpart association
One of the motivation for this study was to examine possible counterparts proposed by Mattox et al. (Reference Mattox, Hartman and Reimer2001) for (in some cases hitherto unassociated) sources in the third EGRET catalog (Hartman et al. Reference Hartman1999). The five high-confidence associations of Mattox et al. (also high-confidence associations in 3EG) have all been confirmed by Fermi data. Of the seven lower confidence associations of Mattox et al., three in Table 1 and the two in Section 4 are confirmed by Fermi data.
One of the associations not confirmed is 3EG J1813−6419 with PKS 1814−637. This was accorded a high probability based on the strength of the radio source (4.5 Jy at 4.8 GHz) although it had relatively steep radio spectra. The other unconfirmed association, that of 3EG J1631−4033 with MRC 1633-409, has no gamma-ray counterpart in 3FGL. This does not completely discredit the reality of the 3EG source, as AGN can be highly variable at gamma-ray energies (Nolan et al. Reference Nolan, Tompkins, Grenier and Michelson2003, Reference Nolan2012), but, as discussed below, this radio source does not share all the properties of the confirmed gamma-ray counterparts.
5.2. Brightness temperature
Source frame brightness temperatures for the the most compact component in the ten sources observed here are presented in Table 2. The brightness temperatures derived, here, are based on the model-fit parameter sizes: it has been pointed out (e.g., Lovell et al. Reference Lovell, Hirabayashi, Edwards and Murphy2000; Tingay et al. Reference Tingay2001) that formally these are often only lower limits. Kovalev et al. (Reference Kovalev2009) demonstrated that gamma-ray sources tend to have higher brightness temperatures than other sources with comparable radio properties. Brightness temperatures are also calculated for southern gamma-ray sources by Ojha et al. (Reference Ojha2010), Böck et al. (Reference Böck2016), and Edwards et al. (Reference Edwards2017).
The low brightness temperatures of MRC 1633−409 and PKS 1814−637 (<109 K), two orders of magnitude lower than the established gamma-ray sources, are consistent with these not being confirmed as counterparts of Fermi sources.
5.3. Variability
In Table 3, we list the flux densities at 4.8 GHz for the sources considered here from five sources: the PMNS catalog derived from observations in 1992 (Wright et al. Reference Wright, Griffith, Burke and Ekers1994), the survey of Lovell (Reference Lovell1997) conducted in 1993–1994, the ATPMN catalog derived from observations made 1992–1994 (McConnell et al. Reference McConnell, Sadler, Murphy and Ekers2012), the AT20G catalog derived from observations made 2004–2007 (Murphy et al. Reference Murphy2010), as well as the ATCA internal baselines from the VLBI observations (made in 2001) presented here. These are used to derive a simple variability index (S max − S min)/(S max + S min). While the lowest variability index, 0.09, is for the well-established gamma-ray source PKS 0208−512, the only two other indices less than 0.2 are for MRC 1633−409 and PKS 1814−637 which, as discussed above, are not confirmed as counterparts of gamma-ray sources. This lends qualitative support to the observation that gamma-ray AGN tend to be more variable at radio wavelengths (e.g., Tingay et al. Reference Tingay2003).
More recent radio monitoring programs have confirmed this trend and, with the significantly improved cadence of gamma-ray data provided by Fermi, have enabled studies of the correlations between radio and gamma-ray light curves to be explored, shedding light on the emission regions and physical processes (Fuhrmann et al. Reference Fuhrmann2014; Max-Moerbeck et al. Reference Max-Moerbeck2014; Ramakrishnan et al. Reference Ramakrishnan2016; Fuhrmann et al. Reference Fuhrmann2016).
5.4. Core dominance
In Table 3, we also list the core dominance, defined as the flux density derived from the ATCA internal baseline data, divided by the sum of the flux densities of the model-fit VLBI components. MRC 1633−409 and PKS 1814−637, the two sources noted previously, have the lowest core dominance values.
5.5. Jet speeds
It has been reported that the parsec-scale component motions in gamma-ray sources tend to be faster than for gamma-ray–quiet sources (Jorstad et al. Reference Jorstad2001; Lister et al. Reference Lister2009). Only three of the sources considered here have other published VLBI images, which allow consideration to be given to their jets speeds. While there is an evidence that the jet of PKS 0208−512 is highly superluminal (~22c), and PKS 1933−400 possibly ~10c, the monitoring of PKS 1424−418 by Piner et al. (Reference Piner2012) suggests it is relatively slow. As noted above, multi-epoch monitoring will enable definitive statements on the motions in these sources to be made. We note that Lister et al. (Reference Lister2016) find the distribution of apparent speeds extends to nearly 40c, with Fermi sources having on average higher speeds than non-Fermi-detected sources.
6 CONCLUSIONS
We have presented LBA images from 2001 observations of a selection of sources identified by Mattox et al. (Reference Mattox, Hartman and Reimer2001) as likely counterparts to EGRET gamma-ray sources. We find that the confirmed counterparts, based on Fermi data, tend to have radio properties consistent with other associations, including flat radio spectral index, high brightness temperature, greater radio variability, and higher core dominance. The three sources proposed by Mattox et al. as lower confidence associations, which Fermi data subsequently cast doubt on, lack one or more of these attributes. On-going TANAMI observations will provide information on jet speeds, and the observations presented here will provide a useful extension to the time range covered by TANAMI observations in determining component speeds.
ACKNOWLEDGEMENTS
The Long Baseline Array is part of the Australia Telescope National Facility which is funded by the Commonwealth of Australia for operation as a National Facility managed by CSIRO. This research has made use of NASA’s Astrophysics Data System, and the NASA/IPAC Extragalactic Database (NED) which is operated by the Jet Propulsion Laboratory, California Institute of Technology, under contract with the National Aeronautics and Space Administration. This work has made use of Ned Wright’s cosmology calculator (Wright Reference Wright2006). Elizabeth Mahony and Dick Hunstead are thanked for their consideration of the 6dF redshift for PKS 0208−512. The anonymous referee is thanked for comments which have improved the paper.


