The self-administered FFQ, although a more practical tool for assessing individual diets in large cohorts, has associated measurement errors that usually attenuate relative risk estimates in studies of diet and disease risk(Reference Fraser1–Reference Willett3). One approach to improving effect estimates is through a calibration study where assessment of individual diets by questionnaire is compared with a more precise method, such as repeated 24 h recalls(Reference Stram, Hankin and Wilkens4). The goal of the present report is to assess the validity of nutrient intake as measured by the FFQ used in the Adventist Health Study-2 (AHS-2) by comparison with repeated 24 h dietary recalls in a sample of black and white Adventists.
The AHS-2, a prospective study of over 96 000 adult Adventists in the USA and Canada, has the goal of relating lifestyle choices, particularly diet, to health outcomes(Reference Butler, Fraser and Beeson5). The AHS-2 cohort is relatively unique for its wide range of dietary patterns compared with the general Western population. Specifically, 8 % are vegan, 28 % are lacto-ovo-vegetarian, 16 % are semi- or pesco-vegetarian, and 48 % are non-vegetarian. There is also large variation in the consumption of plant foods, such as nuts, soya, other legumes and grains. The FFQ administered in the study was designed specifically to assess the wide range of dietary intake among a population where a large proportion is vegetarian. A calibration and validation study is an integral part of the AHS-2; the current paper describes that study and examines the validity of macro- and micronutrient intakes estimated from FFQ data.
Experimental methods
Calibration sub-study design
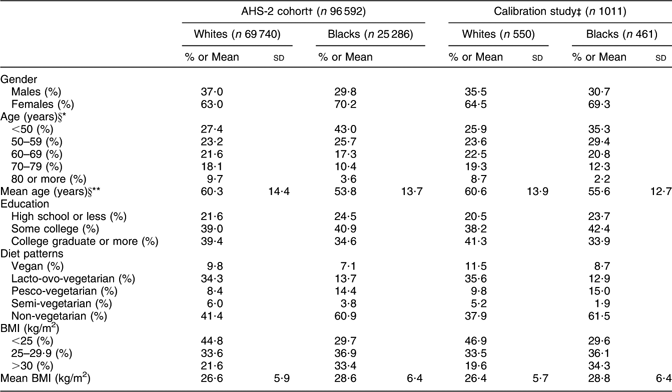
The AHS-2 cohort consists of adult members of Seventh-day Adventist churches geographically spread throughout the USA and Canada. Over 25 000 cohort members are blacks; the remaining subjects are of other races, mostly white. Recruitment and selection methods of the parent cohort have been described previously(Reference Butler, Fraser and Beeson5). Participants in the calibration study were randomly selected from the parent cohort by church, and then subject-within-church. Because of the special focus on black Adventists as a minority group in the AHS-2, the calibration study was designed such that there would be approximately equal numbers of blacks and whites. No significant differences in the distribution of gender, age, education or vegetarian status between the calibration sub-study sample (n 1011) and the AHS-2 cohort (n 96 592) were observed. When stratifying by ethnicity, only the distributions of mean age and age categories in blacks were nominally significantly different (P = 0·0018 and 0·0032, respectively) between the parent cohort and the calibration study sample (Table 1). This is easily consistent with chance given the multiple testing involved.
Table 1 Comparison of selected characteristics between the Adventist Health Study-2 (AHS-2) cohort and calibration study participants according to race, 2003–8

†Proportion of missing data: ethnicity, 1·4 %; gender, 1·4 %; age, 1·7 %; education, 2·8 %; dietary patterns, 4·6 %; BMI, 6·2 %.
‡Proportion of missing data: education, 1·8 %; dietary patterns, 3·2 %; BMI, 5·3 %.
§Differences in the age distributions between the AHS-2 cohort and the calibration study participants were significant only in blacks (*P = 0·0032, **P = 0·0018); otherwise, no significant differences in the distribution of gender, age, education or vegetarian status between the AHS-2 cohort and calibration study participants according to race were observed.
The duration of the calibration study was 9–12 months for any one subject (see Fig. 1). We obtained a set of three variably timed 24 h dietary recalls (one Saturday, one Sunday and one weekday intake) during the first two months, which then was duplicated approximately six months later. The aim was to obtain two sets of recalls (a total of six 24 h recalls) from each subject. During the 6-month interval, subjects completed a self-administered food FFQ that was identical to the baseline FFQ and attended a local study clinic. The study was approved by the institutional review board of Loma Linda University, and all subjects gave written informed consent.

Fig. 1 Adventist Health Study-2 study design
Dietary assessment
The 24 h dietary recalls were unannounced and obtained by telephone. A two-dimensional food portion visual (2D Food Portion Visual; Nutrition Consulting Enterprises, Framingham, MA, USA) was sent to each participant before the first recall to assist with portion size estimates. Trained research dietitians used standard probes and a multiple-pass approach methodology to collect detailed information on all foods, beverages and supplements consumed by each subject during the previous 24 h. Each recall interview was entered using Nutrition Data System for Research (NDS-R) version 4·06 or 5·0 (The Nutrition Coordinating Center, Minneapolis, MN, USA) and the conversation digitally recorded for subsequent quality check. An experienced research dietitian later evaluated randomly selected recall interviews (∼5 %) and compared them with the recording, as a quality control measure.
The AHS-2 FFQ is a quantitative and comprehensive 22-page instrument consisting of 204 foods, fifty-four questions about food preparation and forty-six fields for open-ended questions. Frequency categories vary with food type to allow respondents to define their daily intake with greater specificity. Thus, the lowest category for most foods and beverages is never or rarely, and for cold cereals and vegetarian protein products, 1–3 per month. The highest frequency category for vegetables, soups, cereals, pasta, dressing, meats, fish, vegetarian protein products and soya milk is 2 or more per day; for nuts and seeds, 4 or more per day; for breads, eggs, dairy products, snacks and beverages, 6 or more per day. Portion sizes include three levels: standard, ![]() or less, and
or less, and ![]() or more. Standard portions are based on serving sizes using familiar household units such as cup, tablespoon, slice, patty and others. Pictures of common foods or beverages typically served together were included with the questionnaire to assist subjects in estimating portion sizes. For example, to represent a standard portion, spaghetti, broccoli and steak are arranged on an 11-inch dinner plate, each food measured in a standard portion. Representations of
or more. Standard portions are based on serving sizes using familiar household units such as cup, tablespoon, slice, patty and others. Pictures of common foods or beverages typically served together were included with the questionnaire to assist subjects in estimating portion sizes. For example, to represent a standard portion, spaghetti, broccoli and steak are arranged on an 11-inch dinner plate, each food measured in a standard portion. Representations of ![]() of standard and
of standard and ![]() times the standard portion size are provided as well, using the same foods and dinner plate.
times the standard portion size are provided as well, using the same foods and dinner plate.
The AHS-2 FFQ was designed to include foods commonly eaten by US Adventists and later modified to accommodate foods specific to black Adventists of US and Caribbean origin(Reference Akbar, Jaceldo-Siegl and Fraser6). The questionnaire was sent to each subject, completed at home, and then mailed back to AHS-2. Respondents were asked to report on their intake over the previous one year. Upon receipt of the questionnaire, study personnel reviewed the questionnaire for completeness and as necessary followed-up by telephone to clarify any ambiguous or incomplete information.
Completed questionnaires were optically scanned using the NCS 5000i Image Scanner with ScanTools Plus software (Pearson NCS, Bloomington, MN, USA). Standardized processing of open-ended questions was done using the Food Write-In Processing software (Adventist Health Study-2, Loma Linda, CA, USA), a network-based application created in Microsoft® Access (Microsoft Corporation, Redmond, WA, USA).
Nutrient composition of foods reported from 24 h recalls and FFQ were based on the NDS-R 5·0_35 database (The Nutrition Coordinating Center), an analytic database of over 20 000 foods updated annually while maintaining nutrient profiles true to the version used for data collection(Reference Schakel, Sievert and Buzzard7). Nutrient profiles of foods and supplements not found in the NDS database were obtained from the US Department of Agriculture, manufacturers, and the Caribbean Food and Nutrition Institute. Considerable attention was given to creating recipes for home-cooked vegetarian dishes (n > 500), home-made and commercial soya and nut milks (n > 180) and commercial meat analogues (n 309) frequently consumed among our study population. For the latter we contacted manufacturers or worked with a senior food technologist with experience in this industry, to create recipes.
Statistical analysis
Within each of the two sets of 24 h dietary recalls, each day was weighted appropriately to produce a synthetic week (Saturday intake + Sunday intake + 5 × weekday intake) and then divided by 7 to obtain mean daily nutrient estimate. Dietary habits among Adventists are often rather different on Saturdays, Sundays and typical weekdays. Thus, for those who completed six 24 h recalls (n 950), mean daily intake was calculated by dividing the total of the two synthetic weeks by 14. For those sixty-one subjects who completed only three, four or five recalls, only the first three recalls (first synthetic week) were used in these analyses. Nutrient estimates from FFQ data were calculated using the product-sum method(Reference Willett8). Thus, nutrient intake = sum [(weighted frequency of use of a food) × (weighted portion size consumed of that food) × (amount of that nutrient in a standard serving size of that food)]. FFQ with estimated energy intake <2093 kJ (<500 kcal) or >18 833 kJ (>4500 kcal) were excluded from analyses. Arithmetic means and standard deviations were calculated for nutrient intakes assessed by 24 h recalls (R) and FFQ (Q). To determine differences, Student’s t tests were used for continuous variables and χ 2 tests for categorical variables.
Nutrients were energy-adjusted using the residual method(Reference Willett and Stampfer9). However, for vitamins, minerals and fatty acids also commonly used as supplements, unadjusted supplemental intake was added to energy-adjusted dietary values, resulting in energy-adjusted total intake. Nutrient validity correlations, corr(R,Q), were calculated between averages of the two synthetic weeks of recalls and intake measured from FFQ. Where the linear regression implied by the correlation coefficient had residuals with skew ≥2·0, both dietary quantities were log-transformed.
After energy adjustment, we determined correlations for corr(Q,R) and then corrected the correlation coefficients for attenuation due to within-person variation in the recalls(Reference Willett3). The deattenuated energy-adjusted correlation coefficients, r c, that we report are estimates of ![]() , where var(T) is estimated using the repeated measurements of R. This allowed us to also use the 6 % of subjects who did not complete the second week of recalls, assuming that their within-person variances did not systematically differ from the others.
, where var(T) is estimated using the repeated measurements of R. This allowed us to also use the 6 % of subjects who did not complete the second week of recalls, assuming that their within-person variances did not systematically differ from the others.
A bias factor was calculated as the proportional bias, (crude − true)/true, that would be observed in a regression coefficient if the uncorrected FFQ estimate were used as the independent variable in a regression where in fact the mean of a large number of recall estimates is the truth.
We calculated 95 % confidence intervals for all validity coefficients using bootstrap resampling and the BCa method(Reference Efron and Tibshirani10). Analyses were performed using the SAS statistical software package version 9·1 (SAS Institute Inc., Cary, NC, USA).
Results
The 1011 subjects in the calibration study represented the total AHS-2 cohort very well, both with respect to demographic variables and dietary practices (Table 1). There were more females than males regardless of race. Whites were older, had higher education and lower BMI compared with blacks. A greater proportion of blacks than whites were semi- and non-vegetarians.
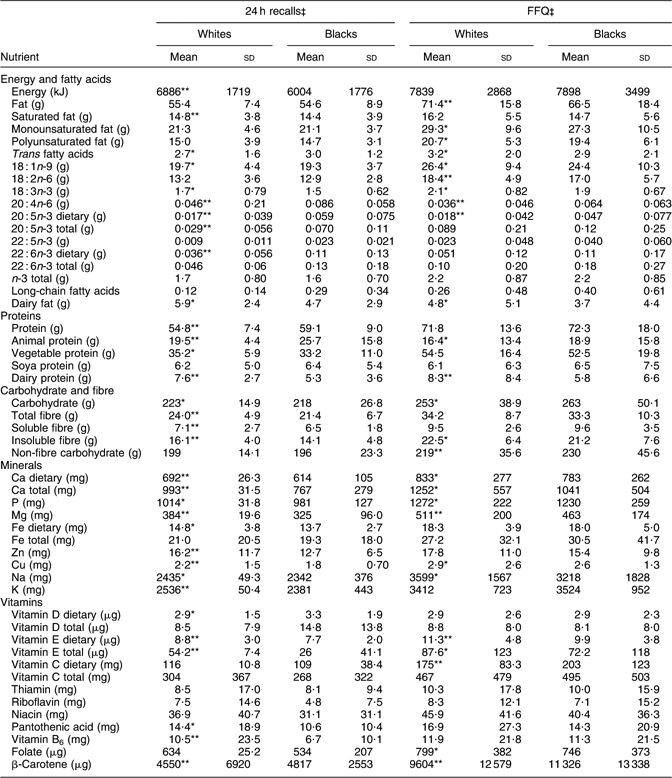
Nutrient intake estimates from the FFQ and the 24 h recalls by race are shown in Table 2. Intakes of nutrients estimated from 24 h recalls were in general higher for whites than blacks, except for trans and very-long-chain fatty acids, protein, animal protein and vitamin D. Nutrient intake estimates from the FFQ were also generally higher in whites; however, blacks had higher intakes of very-long-chain fatty acids, total energy, protein, animal protein, carbohydrate, non-fibre carbohydrate, Fe, K, and vitamins D and C.
Table 2 Comparison of nutrient intake as measured by the FFQ and 24 h recallsFootnote † in the Adventist Health Study-2 calibration study participants, 2003–8

† Average of two sets of three weighted 24 h recalls.
‡ Intakes of these nutrients were significantly different in blacks compared with whites: *P < 0·05, **P < 0·0001.
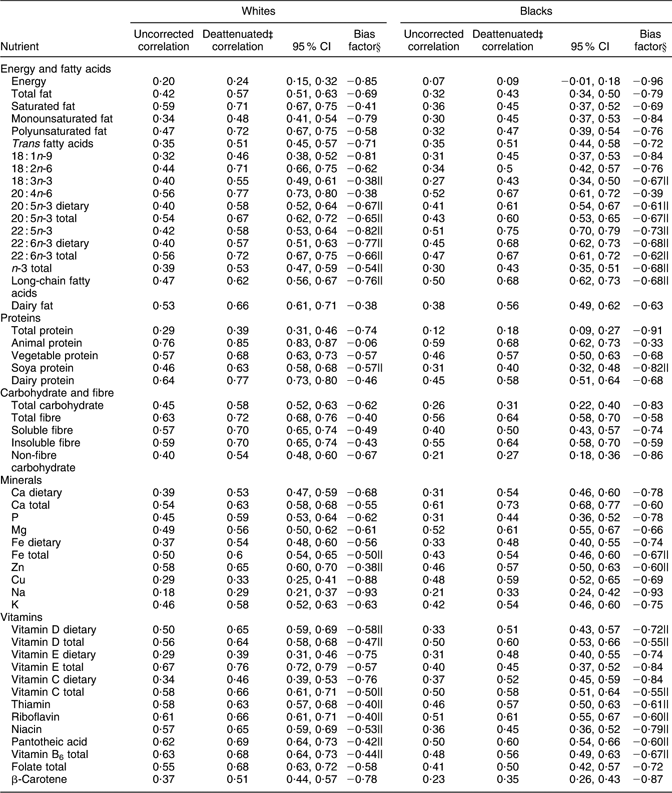
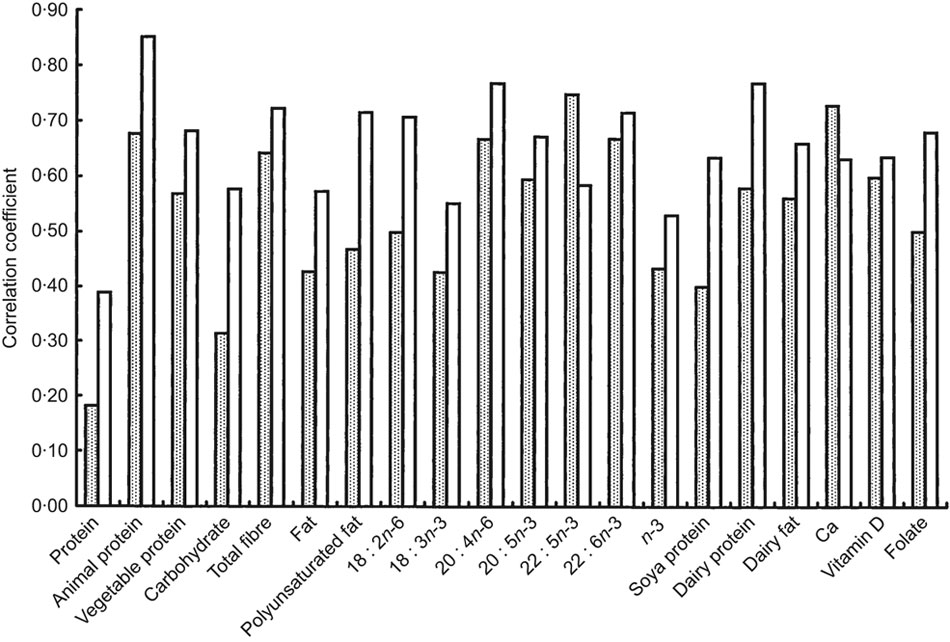
All uncorrected and deattenuated correlation coefficients reported for selected macro- and micronutrients were energy-adjusted (Table 3 and Fig. 2). Correlations improved after correction for attenuation in the recalls on average by 28 % and 34 % in white and black subjects, respectively. Average deattenuated validity correlations were higher in whites compared with blacks (r = 0·60 and 0·52, respectively). The lowest validity correlations in both races were for energy: r = 0·09 (95 % CI −0·01, 0·18) in blacks and r = 0·24 (95 % CI 0·15, 0·32) in whites. Nutrients with the highest deattenuated correlations were docosapentaenoic acid (22 : 5n-3) in blacks (r = 0·75, 95 % CI 0·70, 0·79) and animal protein in whites (r = 0·85, 95 % CI 0·83, 0·87). Individual components of protein (animal, vegetable, soya and dairy protein) had validity correlations ranging from 0·40 to 0·68 in blacks and from 0·63 to 0·85 in whites, but total protein was much lower in both races (r = 0·39 and 0·18 in whites and blacks, respectively; see further comment in the discussion section). Deattenuated correlations for total fat and fatty acids ranged from 0·43 to 0·75 in blacks and from 0·46 to 0·77 in whites. Regardless of race, fibre and its components had higher validity compared with total carbohydrate. Of the eighteen micronutrients assessed, sixteen in blacks and sixteen in whites had deattenuated correlations ≥0·4, averaging 0·60 and 0·53 in whites and blacks, respectively.
Table 3 Energy-adjusted validity correlationsFootnote † between the FFQ and 24 h dietary recalls in Adventist Health Study-2 calibration study participants, 2003–8

† Uncorrected and deattenuated correlations were energy-adjusted.
‡ Corrected for attenuation due to within-person error in the recalls.
§ Bias factor is the proportional bias in a univariate regression if the uncorrected FFQ variable is the independent variable.
|| Quantities from FFQ and recalls were log-transformed where the linear regression implied by the correlation coefficient had residuals with skew ≥2·0.

Fig. 2 Comparison of selected deattenuated energy-adjusted correlation coefficients between the FFQ and 24 h dietary recalls in black subjects (![]() ) and white subjects (
) and white subjects (![]() ) of the Adventist Health Study-2, 2003–8
) of the Adventist Health Study-2, 2003–8
The average bias factor was greater in blacks compared with whites (−0·70 and −0·58, respectively), but in both ethnic groups it is clear that use of uncorrected FFQ data in a regression would result in severely attenuated effect estimates.
Discussion
Participants of this relatively large (n 1011) calibration study were representative of the parent cohort with respect to gender, age, education, BMI and dietary patterns. Because of our initial selection by church, subjects also were geographically spread throughout the USA and Canada. As a reference measure the present study obtained six 24 h recalls, whereas other cohorts with large calibration samples typically used fewer recalls(Reference Stram, Hankin and Wilkens4, Reference Slimani, Bingham and Runswick11, Reference Subar, Thompson and Kipnis12) or a 4 d food record(Reference Kristal, Feng and Coates13) that did not systematically combine weekdays and weekends.
Intake estimates of most nutrients from both FFQ and recall data generally were higher in whites compared with blacks. However, blacks reported higher intakes of protein, animal protein, very-long-chain fatty acids and vitamin D. This is not surprising, given the greater proportion of non- and semi-vegetarian eating patterns followed by this minority population in the study. As expected, nutrient intake estimates derived from FFQ tended to be higher than those from 24 h recalls. This probably results when people are asked to recall the frequency of intake of a large number of foods in an FFQ and thus tend to overestimate their actual intake(Reference Willett and Stampfer9). In a study that assessed bias of food frequency-based measures of fruit and vegetable intakes, Kristal and colleagues compared intake estimates between recalls (or food records) v. a brief questionnaire with only seven items or an FFQ with thirty or more items(Reference Kristal, Vizenor and Patterson14). They found that estimated intakes were lower from the brief questionnaire, but higher from the longer questionnaire when compared with recalls or food records.
Despite differences between the recalls and FFQ in the current study, deattenuated correlation coefficients were ≥0·40 for forty-three of fifty-one nutrients examined in both ethnicities combined. Estimates from the FFQ of individual fatty acids, total long-chain fatty acids and fibre were moderately to highly correlated, and the micronutrients (except Na, Cu and dietary vitamin E) were also generally highly correlated with recall data. This shows that the AHS-2 FFQ has the ability to provide relatively good estimates of these nutrients.
Deattenuated correlation coefficients with values less than 0·40 included energy, total protein, total carbohydrate (in blacks), non-fibre carbohydrate (in blacks), Na, dietary vitamin E (in whites) and β-carotene (in blacks). Energy intakes in both races were lower compared with others(Reference Stram, Hankin and Wilkens4, Reference Subar, Thompson and Kipnis12, Reference Jackson, Walker and Cade15–Reference Mayer-Davis, Vitolins and Carmichael18). For carbohydrate, our results in blacks and whites were lower or within the range of those observed by other investigators(Reference Subar, Thompson and Kipnis12, Reference Jackson, Walker and Cade15, Reference Kumanyika, Mauger and Mitchell17, Reference Jain, Rohan and Soskolne19).
Our deattenuated validity correlations for total protein were within the range of(Reference Stram, Hankin and Wilkens4, Reference Morris, Tangney and Bienias20) or lower(Reference Jackson, Walker and Cade15, Reference Kumanyika, Mauger and Mitchell17, Reference Marks, Hughes and van der Pols21) than those reported in other validation studies. It was particularly noticeable in our study that the individual protein components (animal and vegetable protein) that contribute to this composite nutrient had greatly higher coefficients than total protein. In examining the results from the FFQ and recall data, it appears that the questionnaire overestimates the amount of vegetable protein intake, but underestimates the amount of animal protein compared with the recalls. The most likely explanation is the differential scaling of animal and plant sources of protein in our FFQ, which includes a long list of plant proteins (in part due to the attention we give to meat analogues) but a comparatively shorter list of animal protein foods. In calculating the deattenuated correlation coefficient for total protein, we noted that the variance of animal protein (APRO) from recalls (315·9) was much greater than the variance of animal protein from the FFQ (211·34), yet the variance of vegetable protein (VPRO) from recalls (165·24) was much smaller than the variance of vegetable protein from the FFQ (325·13).
We resolved this problem by putting the animal and vegetable protein FFQ values on the same scale as each other and the recall values. In a separate analysis, we first calculated for both APRO and VPRO E(recalls|FFQ), summed the two estimates and then correlated this with recall values for total protein. Our correlations for total protein subsequently improved from 0·28 to 0·54 in all subjects combined. This interesting observation suggests that the product-sum method of calculating FFQ intakes may cause distortion at times, depending on the form of the FFQ, and we plan to investigate this issue more fully for other variables (e.g. total energy).
In the current validation study energy-adjusted uncorrected correlations improved after correction for attenuation in the recalls, as others have found. We also observed improved correlations in general when supplements were added, which emphasizes not only the importance of assessing both dietary and supplemental sources of micronutrients, but also that supplements contribute importantly to total nutrient intake in this population.
The λ values reported by Johansson et al.(Reference Johansson, Hallmans and Wikman16) address the same issue as the bias factor (λ − 1) results in the current study. They illustrate quite dramatically the severe proportional biases that result even when validity correlations are well within values commonly held to be acceptable in FFQ work. For example, a univariate regression where uncorrected energy-adjusted PUFA from the FFQ in white subjects (deattenuated validity correlation of 0·72) was used as the independent variable would produce a β coefficient that was biased downwards by 58 %.
When comparing our validation results by race, we found that the deattenuated energy-adjusted validity correlations of several nutrients in our study were smaller in blacks than whites. This is consistent with the reports of others(Reference Stram, Hankin and Wilkens4, Reference Kristal, Feng and Coates13, Reference Mayer-Davis, Vitolins and Carmichael18, Reference Morris, Tangney and Bienias20, Reference Coates and Monteilh22). Presumably these may be explained by somewhat lesser educational attainment(Reference Kristal, Feng and Coates13, Reference Mayer-Davis, Vitolins and Carmichael18) on average among blacks or less familiarity with research studies of this sort. In an older biracial sample, investigators also reported lower validity in the very old (aged 79 years and older) compared with those aged 68–78 years(Reference Morris, Tangney and Bienias20). In our calibration study, a greater proportion of whites achieved higher education, but they were somewhat older compared with blacks.
We provide in this report the validation of an unusually comprehensive list of micronutrients and fatty acids, and with few exceptions find moderate to high validity. Thus we expect to be able to use most of these results to good effect in both traditional analyses of disease risk and analyses incorporating recall- or biomarker-guided measurement error correction.
Acknowledgements
Sources of funding: This work was supported by a grant from the National Cancer Institute RO1 CA94594. Conflict of interest declaration: None of the authors have conflicts of interest. Authors’ contributions: study design, G.E.F.; coordination of data collection, K.J.-S., S.F.K., J.S., W.L.B., J.C., R.P.H., T.L.B., E.H., H.B., S.M.; data analyses, K.O., G.E.F., K.J.-S.; interpretation of data, K.J.-S., S.F.K., J.S., W.L.B.; writing of the manuscript, K.J.-S., G.E.F., S.S.S.; editing of the manuscript, S.F.K., J.S., W.L.B., J.C., R.P.H.


