Dietary behaviour is known to play a key role as a risk factor for chronic diseases and alterations in eating habits can have strong effects, both positive and negative, on health throughout life(1). The burden of nutrition-related chronic diseases (such as CVD, cancer, diabetes and osteoporosis) and obesity is increasing rapidly worldwide(1). In Turkey, CVD, cancer and diabetes are the three leading causes of death: these conditions accounted for 65 % of the nation's deaths in 2008(2). In addition to chronic diseases, nutrient deficiency diseases also contribute to the public health problems in Turkey. Fe deficiency is a major public health problem in Turkey. About 30–50 % of children and 50 % of pregnant/lactating women have been reported to have Fe-deficiency anaemia(Reference Açkurt, Wetherilt and Löker3–Reference Erdem, Bucaktepe and Kara8). Approximately one-third (30·5 %) of the population was reported to have iodine deficiency and related health problems (such as goitre)(Reference Urgancıoğlu and Hatemi9). The prevalence of rickets (due to the deficiency of vitamin D) was found to range between 4·0 and 20·0 %(Reference Bostan, Oktem and Tokuc10–Reference Ozer, Oner and Sevim13). Even in those parts of Turkey that receive sufficient sunlight, some people suffer from vitamin D deficiency. This is due to cultural and religious influences which encourage people to cover their head, arms and other parts of the body(Reference Hasanoglu14). These deficiencies originate from inappropriate eating patterns and habits that are instigated by high food costs, lack of nutrition knowledge and incorrect practices of food preparation, cooking and storage(Reference Pekcan and Karaagaoglu6, Reference Baysal15).
Nutrition knowledge may play a pivotal role in the adoption of healthier food habits but it must be noted that knowledge on its own cannot bring about the desired changes due to the complex nature of food behaviour(Reference Worsley16). Still, the importance of nutrition education should not be undermined(Reference Worsley16–Reference Ozmen, Cetinkaya and Ergin20). In a study carried out among members of the general public in Turkey (n 15 124), it was found that only 21·6 % of the participants had received nutrition education previously(21). Another study emphasised that nutrition knowledge levels in Turkey were low and this often led to malpractices during the preparation and cooking of meals, even if sufficient food sources were available(17).
A continuing problem associated with gaining an understanding of knowledge and knowledge structures is the need for reliable and valid measures of nutrition knowledge(Reference Sapp and Jensen22). Numerous studies have aimed to assess nutrition knowledge in Turkey(Reference Ozcelik, Surucuoglu and Alkan23–Reference Calistir, Dereli and Eksen28). These studies usually employed specific questionnaires intended to measure the nutrition knowledge of sub-populations (such as adolescents, physicians, interns, university students, students studying sports education). These questionnaires differed in terms of their nutrition-related content and the style of the questions. As a result, meaningful comparisons between these results cannot be made(Reference Ozdogan and Ozcelik24).
Currently there are no validated tools to measure nutrition knowledge of the general public in Turkey. The general nutrition knowledge questionnaire (GNKQ) of Parmenter and Wardle proved to be a comprehensive and valid assessment of general nutrition knowledge in a UK sample(Reference Parmenter and Wardle29). Hendrie et al. modified and validated this questionnaire in an attempt to measure general nutrition knowledge in an Australian sample(Reference Hendrie, Cox and Coveney30). The modified questionnaire was found to be a valid and reliable measure of nutrition knowledge. The purpose of the present study was to validate a modified version of the questionnaire by Parmenter and Wardle(Reference Parmenter and Wardle29) in a Turkish student sample. Provided that it has an acceptable validity and reliability, the modified questionnaire will be used to explore the level of nutrition knowledge of the Turkish general population.
Methods
Study sample
Participants in the present study were second year undergraduate students studying either nutrition and dietetics (n 90) or engineering (computer, civil, electrical and electronic or mechanical engineering; n 105). Engineering students were chosen as a group that was assumed to have little nutrition education. The questionnaire (see Appendix) was administered at the end of lectures on two separate occasions that were two weeks apart. In practice, test–retest reliability studies usually employ an interval of a few days to a few weeks(Reference Hogan31). Two weeks was considered to be long enough for participants to have forgotten their responses but not long enough to have a real change in their nutrition knowledge(Reference Parmenter and Wardle29, Reference Parmenter and Wardle32). Participants were not informed of the second administration of the questionnaire at the time of the first.
The responses from the first administration were used to assess construct validity and internal consistency reliability. The two sets of responses (i.e. the first and the second administration) were used to measure test–retest reliability.
Ethical approval
The study was reviewed and approved by the Ethics Committee of Yeditepe University, Istanbul. All participants gave informed consent.
Questionnaire refinement
The original questionnaire by Parmenter and Wardle(Reference Parmenter and Wardle29) was translated into Turkish and administered to a Turkish community sample (n 63) for a pilot study. The participants of the pilot study were asked to make written comments and provide verbal feedback on the difficulty level of the questions. The answers and the comments were presented to a panel of dietitians to evaluate the face content validity, feasibility and questionnaire layout, and some changes were made in the light of their expert opinion.
Based on the comments of the expert panel, some questions were excluded from the original questionnaire. The questions that required the identification of foods that contain MUFA and PUFA (n 2) were omitted from the questionnaire (items 17 and 21 in section B in the original questionnaire(Reference Parmenter and Wardle29)). These questions could be answered by only a few participants. These types of questions are called measures of ‘factual/declarative knowledge’ and they often use scientific terms that the participants are unfamiliar with(Reference Worsley16, Reference Dickson-Spillmann, Siegrist and Keller33). Indeed, the participants who took part in the pilot study stated that they had no previous knowledge of these terms.
Some questions were added to the original questionnaire. One of the additions was about the maximum daily recommended intake of salt. This was because the amount of salt consumed daily by Turkish people (i.e. 18 g/d approximately)(Reference Kaptanoğlu34) exceeds the recommended amount by three times. The second addition was a question about foods that contain trans fatty acids. The reason for adding this question is that the consumption of fast foods, particularly by young people, has increased significantly within the last decade(Reference Akbay, Tiryaki and Gül35) and recently Turkish food manufacturers have begun intense advertising campaigns to inform the public that their products do not contain trans fatty acids or that the levels of trans fatty acids in their products are below those set by food legislation in Turkey. This could explain why the public is more familiar with trans fatty acids than MUFA or PUFA. It can also be argued that the public may have some knowledge about PUFA and this knowledge could have been measured if a different terminology (such as omega-3 and omega-6 fatty acids) was used in the questions. The third addition was a question about the bioavailability of Fe from plant sources when compared with animal sources. This question was included in the questionnaire as Fe deficiency is a major public health problem in Turkey(Reference Pekcan5, Reference Pekcan and Karaagaoglu6, Reference Erdem, Bucaktepe and Kara8).
The major change to the original questionnaire was in the ‘diet–disease relationships’ section. Each of the five open-ended questions in this section was replaced by a table with a number of diseases and the participants were asked whether the consumption of a food or a food group was related to these diseases (see Appendix, items D1 to D5). This was due to the difficulties experienced during the interpretation and grouping of the multiple responses obtained in the pilot study.
Another change in the questionnaire was the substitution of the names of British foods with foods or dishes that Turkish people are more familiar with. For example, instead of ‘beans on toast’, ‘piyaz’ – a type of white bean salad – was used.
The questionnaire included 135 items covering four areas of nutrition knowledge, namely (i) awareness of current dietary recommendations (eleven items), (ii) knowledge of food sources and nutrients (seventy-three items), (iii) choosing everyday foods (seven items) and (iv) diet–disease relationships (forty-four items). A number of demographic questions were included in the last part of the questionnaire to characterise the participants.
Data collection and analysis
The questionnaire was self-administered in groups and supervised by the author. Knowledge subscores and an overall nutrition knowledge score were calculated. The raw data from each participant's responses were coded numerically. The responses were also converted to 1 and 0 for correct and incorrect answers, respectively. Data were entered and analysed using the SPSS statistical software package version 17·0 (SPSS Inc., Chicago, IL, USA).
Results
The compliance was high, with all students completing the questionnaire on at least one occasion (ninety nutrition and dietetics students and 105 engineering students). Of these, 125 students (seventy-three nutrition and dietetics students and fifty-two engineering students) completed the questionnaire twice. The gender balance of the two groups was different (81·1 % of the nutrition and dietetics students were female and 83·8 % of the engineering students were male). The majority of the students from both groups were aged between 17 and 24 years. In total, 78·9 % of the nutrition and dietetics students and 58·1 % of the engineering students had a BMI between 18·5 and 24·9 kg/m2 (normal weight range). These values were greater than the percentage of Turkish adults with the same BMI range (41 %), which was established by a recent study (n 4205)(Reference İşeri and Arslan36). There were some students who were classified as overweight (with a BMI between 25·0 and 29·9 kg/m2) in both groups (i.e. 10·0 % of the nutrition and dietetics students and 30·5 % of the engineering students). No students were classified as obese class I (with a BMI between 30·0 and 34·9 kg/m2) in the nutrition and dietetics group; however, the BMI of 5·7 % of the engineering students was within this range (Table 1).
Table 1 Gender, age and BMI of the study population: second year undergraduate students (n 195), Istanbul, Turkey

Construct validity
Validity is the extent to which a test measures what it is intended to measure(Reference Sapp and Jensen22). One of the easiest ways to assess construct validity is to give the measure to two groups, one of which is known to have higher nutrition knowledge than the other group(Reference Parmenter and Wardle32).
Table 2 shows that the nutrition and dietetics students consistently scored higher than the engineering students on all sections of the questionnaire (P < 0·001). The nutrition and dietetics students had an average score of 103·6 (sd 9·2) and the engineering students had an average score of 81·8 (sd 14·5) out of a maximum score of 135. The scores ranged from 79 to 118 in the nutrition and dietetics group and from 40 to 108 in the engineering group.
Table 2 Mean, standard deviation and the range of correct scores of the general nutrition knowledge questionnaire administered to second year undergraduate students (n 195), Istanbul, Turkey

Given the different gender balance of the two groups, gender was controlled for in an analysis of covariance but this did not have a significant effect on the results. The questionnaire therefore met the criterion for construct validity.
Internal consistency reliability
The tendency towards consistency found in repeated measurements of the same phenomenon is referred to as reliability(Reference Carmines and Zeller37). Internal consistency refers to the extent to which all of the items in a scale are measuring different aspects of the same attribute(Reference Parmenter and Wardle32). Cronbach's α coefficient is often used to assess the reliability of nutrition knowledge tests with questions that have more than two possible responses(Reference Sapp and Jensen22). Cronbach's α ranges from 0 to 1, with α = 0·7 or greater considered as sufficiently reliable(Reference Nunnally and Bernstein38).
In the current study, Cronbach's α values for individual sections ranged between 0·43 and 0·81. The value for the overall questionnaire was α = 0·89 (Table 3).
Table 3 Internal and test–retest reliability scores of the general nutrition knowledge questionnaire administered to second year undergraduate students (n 195), Istanbul, Turkey

*P < 0·001.
Test–retest reliability
Test–retest reliability involves administering the same measure to the same group of test-takers under the same conditions on two different occasions and correlating the scores(Reference McIntire and Miller39). The reliability coefficient is simply the correlation (usually a Pearson correlation) between the scores on the first and the second testing(Reference Hogan31). The value for a Pearson's correlation coefficient can fall between 0·00 (no correlation) and 1·00 (perfect correlation).
Pearson's correlation coefficients were calculated on the scores of the 125 participants (seventy-three nutrition and dietetics students and fifty-two engineering students) who completed the questionnaire twice. The correlation coefficients varied across the sections and the two student groups (ranging from 0·36 to 0·76). The overall reliability was high (r = 0·86, P < 0·001; Table 3).
Discussion
The purpose of the present study was to measure the validity and reliability of a modified nutrition knowledge questionnaire for use in the Turkish population.
Significant differences between the scores of the nutrition and dietetics students and the engineering students indicated that the questionnaire had satisfactory construct validity. The nutrition and dietetics students scored higher on all sections of the questionnaire.
The overall test–retest reliability value was high and this suggested that the questionnaire measured nutrition knowledge consistently over time.
Nutrition scholars prefer reliability estimates of 0·70 or greater as an indication that a test is sufficiently reliable for measuring knowledge and knowledge structures(Reference Axelson and Brinberg40). In a comprehensive review, Cronbach's α values ranging from 0·5 to 0·8 (mostly between 0·6 and 0·7) were reported for studies that measured nutrition knowledge(Reference Contento41). In the current study, internal reliability for the whole scale (0·89) and two sections (‘sources of nutrients’ and ‘diet–disease relationships’) were high (0·88 and 0·81, respectively). Lower values for reliability (0·47 and 0·43) were obtained with the other two sections (‘dietary recommendations’ and ‘choosing everyday foods’, respectively). Lower reliability values for these two sections were also obtained in previous studies (Table 4). The values obtained with the Australian sample(Reference Hendrie, Cox and Coveney30) for the same sections were slightly higher than in the current study (0·53 and 0·55, respectively). The values obtained with the UK sample(Reference Parmenter and Wardle29) were the highest (0·70 and 0·76, respectively). In general, the reliability values for all sections and for the overall questionnaire were the highest in the UK study sample. The higher values in the UK sample were attributed to the use of a more homogeneous sample (younger and more educated individuals attending university) compared with the mixed demographic Australian sample (community members)(Reference Hendrie, Cox and Coveney30). However, the current study recruited university students and the values were still lower than in the study carried out in the UK. Therefore, this hypothesis did not seem to explain this discrepancy. One possible explanation could be the differences in eating habits and patterns of Turkish people. It could be argued that the style and content of the questions were not fully capable of measuring the general nutrition knowledge of a population that is socially and culturally very different from that in the other two countries. For example, unlike in the UK and Australia, bread and cereals constitute an important part of the diet of Turkish people. Bread provides 44 % of the total daily energy intake and bread and cereals together make up 58 % of the energy intake. The daily protein consumption in Turkey seems to be sufficient but the majority of the protein consumed is plant-based(42). In addition to eating habits and patterns, diet- and health-related issues in Turkey also differ from those in the UK and Australia (as outlined previously, both nutrition-related chronic diseases and nutrient deficiency diseases contribute to the public health problems in Turkey). In accordance with this, one could expect to have some disparity between the content of nutrition- and health-related information (i.e. dietary recommendations) conveyed by the health authorities in Turkey and the UK in 1999. For example, there are serious government efforts in Turkey to increase the daily consumption of meat, milk and eggs, particularly in communities with low socio-economic status. On the contrary, in developed countries where obesity and CVD are major health problems, the general advice is to keep the consumption of these foods at moderate levels, choose reduced-fat options and consume alternative foods (such as nuts and pulses in place of meat and meat products)(43, 44).
Table 4 Comparison of the internal reliability and Pearson correlation coefficients for the knowledge components of the general nutrition knowledge questionnaire

In the section on ‘choosing everyday foods’, three items had to be removed (see Appendix, items C3, C4 and C6) as they gave rise to low values of reliability (i.e. less than 0·43). Compared with the original study (0·76), a low reliability value for this section was also obtained with the Australian sample (0·55)(Reference Hendrie, Cox and Coveney30). In the current study, this section of the questionnaire seemed to be the section that the participants had the most difficulty with. Indeed, some of the questions required two pieces of information (as in C1). Some other questions were deemed to be confusing by the participants as they felt that the questions were worded ambiguously (as in C4). This item made the majority of the participants decide between ‘too much starch’ v. ‘too much protein’. However, this question was originally intended to measure the knowledge of the participants about saturated fat and cholesterol intake. A Turkish person might answer this question in favour of consuming ‘too much protein’ as the daily intake of animal protein is insufficient in Turkey, but this answer would be incorrect if assessed using the original criteria(Reference Parmenter and Wardle29).
The other section with low reliability value was ‘dietary recommendations’ (0·47). Hendrie et al. reported that this section had a weak reliability (0·53) and the lowest test–retest correlation coefficient (0·37)(Reference Hendrie, Cox and Coveney30). They attributed the low values to the confusion on dietary information created by the media since 1999, when the questionnaire was first developed in the UK. This could be a valid presumption as the media is regarded as the most important single information source on health and nutrition for the public(Reference Fernandez-Celemin and Jung45). For example, Turkish people were recommended not to eat more than 2–4 eggs per week in recent years, but currently the general advice is that one egg can be consumed daily. Turkish experts on food and health continue to deliver conflicting messages on daily egg consumption via the written and oral media(46).
The number of items in a scale can affect the size of the α coefficient(Reference Ntoumanis47). All other things being equal, the magnitude of α will be higher as the number of items increases(Reference Urbina48). Therefore, the low α values obtained in the ‘choosing everyday foods’ and ‘dietary recommendations’ sections of the present study may be attributed to the low item numbers. These sections had seven and eleven items, respectively; lower numbers of items compared with the other sections (forty-four and seventy-three).
The question about the daily recommended intake of fruit and vegetables (A2) stood out as being particularly poorly answered. Only 2 % of the engineering and 29 % of the nutrition and dietetics students answered this question as ‘five portions’. This is consistent with the decline in fruit and vegetable consumption in Turkey in recent years(49). Turkish adults are reported to consume fewer than two portions of fruit and vegetables daily(42), so it would seem that the importance of consuming five portions of fruit and vegetables was not communicated effectively by Turkish government agencies to members of the public.
In general, a questionnaire with many questions would increase the test's reliability and therefore one should be cautious when removing questions as this would diminish the reliability of the test(Reference McIntire and Miller39). The current questionnaire contained a high number of items (135). The students were able to complete it in 20–25 min. Community members in the pilot study took even longer (30–35 min) to complete it. In order to reduce the burden on the participants, the number of items can be reduced after careful consideration.
Conclusions
The modified version of the general nutrition knowledge questionnaire of Parmenter and Wardle(Reference Parmenter and Wardle29) can be used as a tool to examine nutrition knowledge in Turkey. However, further modifications are necessary to adapt the questionnaire to the eating habits and patterns of Turkish people. The items in section A (‘dietary recommendations’) and section C (‘choosing everyday foods’) in particular need revision to resolve the issue of low reliability. Implementing the questionnaire will probably not increase nutrition knowledge but it will provide information on the levels of nutrition knowledge in the Turkish community, which can then be used to develop or target public health nutrition efforts to improve dietary habits and in turn influence nutrition-related disease risk.
Acknowledgements
This research received no specific grant from any funding agency in the public, commercial or not-for-profit sectors. There are no conflicts of interest to declare. A.A.A. is the only author of the manuscript and no one else contributed to the design, implementation, analysis of data, or writing of the manuscript.
Nutrition survey
This is a survey, not a test. Your answers will help identify which dietary advice people find confusing.
1. It is important that you complete it by yourself.
2. Your answers will remain anonymous.
3. If you do not know the answer, mark ‘not sure’ rather than guess.
Section A. The first few items are about what advice you think experts are giving us.
A1. Do you think health experts recommend that people should be eating more, the same amount or less of these foods? (tick one box per food)

A2. How many servings of fruit and vegetables a day do you think experts are advising people to eat? (One serving could be, for example, an apple or a handful of chopped carrots) …………
A3. Which fat do experts say is most important for people to cut down on? (tick one)
(a) monounsaturated fat
(b) polyunsaturated fat
(c) saturated fat
(d) not sure
A4. According to the experts, the amount of salt we consume in a day should not exceed (tick one)
(a) half of a teaspoon
(b) one teaspoon
(c) one table spoon
(d) not sure
Section B. Experts classify foods into groups. We are interested to see whether people are aware of what foods are in these groups.
B1. Do you think these are high or low in added sugar? (tick one box per food)

B2. Do you think these are high or low in fat? (tick one box per food)

B3. Do you think experts put these in the starchy foods group? (tick one box per food)
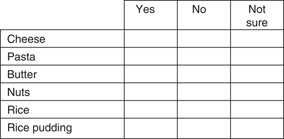
B4. Do you think these are high or low in salt? (tick one box per food)

B5. Do you think these are high or low in protein? (tick one box per food)

B6. Do you think the foods listed below contain trans fatty acids? (tick one box per food)
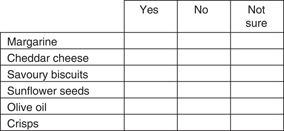
B7. Do you think these are high or low in fibre – roughage? (tick one box per food)
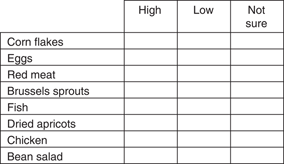
B8. Do you think these fatty foods are high or low in saturated fat? (tick one box per food)

B9. Some foods contain a lot of fat but no cholesterol.
(a) Agree
(b) Disagree
(c) Not sure
B10. Do you think experts call these a healthy alternative to red meat? (tick one box per food)

B11. A glass of unsweetened fruit juice counts as a helping of fruit.
(a) Agree
(b) Disagree
(c) Not sure
B12. The iron in spinach is as useful for our body as the iron in red meat.
(a) Agree
(b) Disagree
(c) Not sure
B13. Brown sugar is a healthy alternative to white sugar.
(a) Agree
(b) Disagree
(c) Not sure
B14. There is more protein in a glass of whole milk than in a glass of skimmed milk.
(a) Agree
(b) Disagree
(c) Not sure
B15. Polyunsaturated margarine contains less fat than butter.
(a) Agree
(b) Disagree
(c) Not sure
B16. Which of these breads contain the most vitamins and minerals? (tick one)
(a) White
(b) Brown
(c) Wholegrain
(d) Not sure
B17. Which do you think is higher in calories: butter or regular margarine? (tick one)
(a) Butter
(b) Regular margarine
(c) Both the same
(d) Not sure
B18. There is more calcium in a glass of whole milk than a glass of skimmed milk.
(a) Agree
(b) Disagree
(c) Not sure
B19. Which one of the following has the most calories for the same weight? (tick one)
(a) Sugar
(b) Starchy foods
(c) Fibre – roughage
(d) Fat
(e) Not sure
B20. Harder fats contain more: (tick one)
(a) Monounsaturates
(b) Polyunsaturates
(c) Saturates
(d) Not sure
Section C. The next few items are about choosing foods. Please answer what is being asked and not whether you like or dislike the food.
C1. Which would be the best choice for a low fat, high fibre snack? (tick one)
(a) Diet strawberry yoghurt
(b) Raisins
(c) Diet chocolate bar
(d) Wholemeal crackers and cheddar cheese
C2. Which would be the best choice for a low fat, high fibre light meal? (tick one)
(a) Grilled chicken
(b) Cheese on wholemeal toast
(c) Lentil patties
(d) Puff pastry with chicken filling
C3. Which kind of sandwich do you think is healthier? (tick one)
(a) Two thick slices of bread with a thin slice of cheddar cheese filling
(b) Two thin slices of bread with a thick slice of cheddar cheese filling
C4. Many people eat spaghetti bolognaise (pasta with a tomato and meat sauce). Which do you think is healthier? (tick one)
(a) A large amount of pasta with a little sauce on top
(b) A small amount of pasta with a lot of sauce on top
C5. If a person wanted to reduce the amount of fat in their diet, which would be the best choice? (tick one)
(a) Steak, grilled
(b) Sausages, grilled
(c) Turkey, grilled
(d) Braised red meat with animal fat added
C6. If a person wanted to reduce the amount of fat in their diet, but did not want to give up chips, which one would be the best choice? (tick one)
(a) Thick cut chips
(b) Thin cut chips
C7. If a person felt like eating something sweet, but was trying to cut down on sugar, which would be the best choice? (tick one)
(a) Honey on toast
(b) A cereal snack bar
(c) Plain digestive biscuit
(d) Apricots (fresh or dried) with plain yoghurt
C8. Which of these would be the healthiest pudding? (tick one)
(a) Baked apple
(b) Strawberry yoghurt
(c) Wholemeal crackers and cheddar cheese
(d) Vanilla ice cream
C9. Which cheese would be the best choice as a lower fat option? (tick one)
(a) Plain cream cheese
(b) Goat's cheese
(c) Mature cheddar (Turkish style)
(d) Curd cheese
C10. If a person wanted to reduce the amount of salt in their diet, which would be the best choice? (tick one)
(a) Pizza (ready-made)
(b) Cooked rice, stock cubes added
(c) Bagel (Turkish style, also called ‘acma’) with olives
(d) Mushroom omelette
Section D. This section is about health problems or diseases.
D1. What diseases or health problems do you think are related to a low intake of fruit and vegetables?

D2. What diseases or health problems do you think are related to sugar?
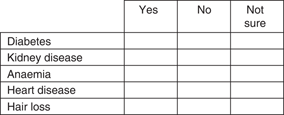
D3. What diseases or health problems do you think are related to salt or sodium?

D4. What diseases or health problems do you think are related to fat?
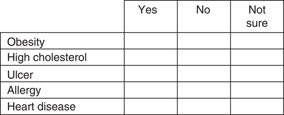
D5. Do you think these help to reduce the chances of getting certain kinds of cancer? (answer each one)

D6. Do you think these help prevent heart disease? (answer each one)

D7. Which one of these is more likely to raise people's blood cholesterol level? (tick one)
(a) Fruits
(b) Animal fats
(c) Plant oils
(d) Grains
(e) Not sure
D8. Have you heard of antioxidant vitamins?
(a) Yes
(b) No
D9. If ‘yes’ to question 9, do you think these are antioxidant vitamins? (answer each one)
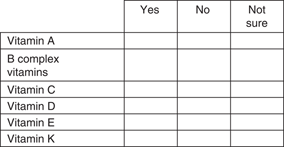
Section E. Finally, we would like to ask you a few questions about yourself.
E1. Are you male or female?
(a) Male
(b) Female
E2. How old are you?
(a) Less than 18
(b) 18–24
(c) 25–34
(d) 35–44
(e) 45–54
(f) 55–64
(g) 65–74
(h) More than 75
E3. Your height ..........
E4. Your weight .........
E5. Are you:
(a) Single
(b) Married
(c) Widowed
E6. Do you have any children?
(a) No
(b) 1
(c) 2
(d) 3
(e) 4
(f) More than 4
E7. Do you have any children, under 18 years, living with you?
(a) Yes
(b) No
E8. What is the highest level of education you have completed?
(a) Cannot read or write
(b) Primary school
(c) Secondary school
(d) High school
(e) Undergraduate
(f) Graduate
E9. Have you received any education and/or training about nutrition before?
(a) If yes, please specify ……...................
(b) No
E10. What is your job? If you are not working now, what is your usual job? (please be specific)...............................
E11. If you have a partner, what is his/her job? If he/she is not working now, what is his/her usual job? (please be specific) .............
E12. Are you currently:
(a) Employed full time
(b) Employed part time
(c) Unemployed
(d) Full time homemaker
(e) Retired
(f) Student
(g) Disabled or too ill to work
E13. Are you on a special diet?
(a) If yes, please specify ......................................
(b) No
E14. If you answered the previous question as ‘yes’
Can you please give the reason for being on a special diet ......................
Can you please write where you obtained your diet list from .......................
E15. Where would you get the information about food and health from? Please choose only one option – the one that applies to you the most
(a) Books
(b) Newspapers & magazines
(c) TV & radio
(d) Doctors
(e) Dietitians
(f) Teachers & lecturers
(h) Other, please specify ................
THE END
Thank you very much for your time.
If there are any comments you would like to make about this questionnaire, please do so below, they would be very welcome.


