Optimal micronutrient status is essential not only for the health and psychological well-being of adolescents but also for their growth, long-term health and development. A basic question regarding nutrient inadequacy is: what proportion of the population has usual nutritional intake less than their requirement? In addition, this assessment is needed to verify that intake levels are not so high that they pose a risk of adverse health effects in a group of individuals(1).
Although critically important from the perspective of public health(Reference Viteri and Gonzales2), information about the adequacy of nutrient intake is seldom collected for adolescents in developing countries; further, it is often based on small, non-representative samples. In recent decades, diets have changed markedly in Brazil in that the Western diet is replacing the traditional diet, which is based on grains, such as rice, and beans(Reference Levy-Costa, Sichieri and Pontes3).
In addition to the scarcity of published data regarding the prevalence of inadequate nutrient intake in adolescents(Reference Moshfegh, Goldman and Cleveland4–Reference Affenito, Thompson and Franko6), the role of socio-economic factors has not been addressed even though there is evidence that individuals in the lower income and lower educational level strata have less access to a healthy diet(Reference Drewnowsky and Darmon7).
The aim of the present study was to estimate the prevalence of inadequate nutrient intake among adolescents living in São Paulo, Brazil, who were enrolled in a population-based health survey conducted in 2003. The present study also examined the association between the prevalence of inadequate nutrient intake and family income, parental education and overweight status.
Methods
Study population
The Health Survey for São Paulo (ISA) was a representative sample study conducted from March to December 2003. Details are available elsewhere(Reference Castro, Barros and Bueno8). Briefly, from a total population of 813 adolescents, those in the 14–18-year age range were selected for the study (n 525; 276 male and 249 female participants). This age group was studied to maintain consistency with the life-stage groups established in the Dietary Reference Intake (DRI) reports(1). The present study was approved by the local ethics committee. Written informed consent was obtained from the participants or, if participants were younger than 18 years of age, from a parent or legal guardian.
Data collection and processing
Information on food intake, demographics and socio-economic and anthropometric variables was obtained using structured questionnaires through household interviews. Height and weight were self-reported. Categories of income were defined as low income (<1 minimum wage per capita) and high income (≥1 minimum wage per capita) according to the current minimum wage established by the Brazilian government at the time of data collectionFootnote *. Parental educational level was defined as the number of years of education completed by the head of the household. Strata were defined as low (<8 full years of education) and high (≥8 full years of education). Overweight status was assessed using the recommended BMI for sex and age and the cut-off points proposed for adolescents(Reference De Onis, Onyango and Borghi9).
A multiple-pass 24 h recall (24HR) was administered by trained interviewers. This method differs from the traditional 24HR because the interviewer uses three distinct steps to collect information about a participant's food intake. In the first step, respondents are asked to recall everything they ate the previous day. In the second step, respondents are asked to clarify any foods mentioned in the previous step. Finally, in the third step, the interviewer reviews the list of foods mentioned and probes for additional eating occasions(Reference Thompson and Byers10). The sampling days for all participants covered all the days of the week. Foods reported in each 24HR were critically reviewed to identify any failures related to the descriptions of the food consumed or to food preparation techniques, including their apportioning and quantification. The data were analysed for eighteen nutrients using Nutrition Data System for Research software version 2007 (Nutrition Coordinating Center, University of Minnesota, Minneapolis, MN, USA). Additional interview questions were asked to assess supplement use. However, because of the low rate of supplement use (4·5 %), this information was not computed in the total nutrient intake.
Dietary data and statistical analysis
Usual intake was estimated by adjusting for the within-person variance of the nutrient intake using the Iowa State University (ISU) method(Reference Nusser, Carriquiry and Dodd11). This method can be used when two or more 24HR are available for at least a subsample of the individuals. Because applying the Estimated Average Requirement (EAR) cut-off point method to the unadjusted nutrient distributions will result in biased prevalence estimates, we considered the external estimates of within-person variance components as a reasonable approach(Reference Jahns, Arab and Carriquiry12, Reference Murphy, Guenther and Kretsch13). Accordingly, as the ISA-2003 data collection protocol included only a single 24HR, further data were collected to provide estimates of the within- and between-person variability. All adolescents who participated in the ISA-2003 survey and who were younger than 19 years of age at the beginning of the new data collection (March 2007) were invited to answer two additional 24HR. Among the 328 adolescents (168 male and 160 female) who met these criteria, 146 answered two additional 24HR within a 2-month interval and sixty-eight answered only one additional 24HR. The within-person variance component and the fourth moment of the nutrient intake distribution for each nutrient and sex combination were estimated from these data, and such external parameters were applied to the ISA-2003 data set to estimate the distribution of the usual nutrient intake. The fourth moment is a measure of flatness of a distribution, also referred to as kurtosis. This procedure was implemented using the personal computer version of Software for Intake Distribution Estimation version 1·0 (PC-SIDE; Department of Statistics, ISU, Ames, IA, USA). The PC-SIDE software calculates an empirical estimate and adjusted percentiles of the usual nutrient intake within each EAR age and sex subgroup; the software also calculates the prevalence of inadequate intake on the basis of the subgroup EAR cut-off point method. This method was endorsed by Dwyer et al.(Reference Dwyer, Picciano and Raiten14) and Hoffman et al.(Reference Hoffman, Boing and Dufour15). The statistical model for each nutrient and sex group included the day of the week (dichotomised into weekdays and weekend days) and month of the year as covariates. Owing to the complex sampling design of the survey, sampling weights were also included in the model.
The Estimated Average Requirement cut-off point method
The values proposed by the Institute of Medicine (IOM)(1) were used as the reference for nutrient intake. The prevalence of inadequate nutrient intake was assessed by the EAR cut-off point method. In this method, the prevalence of inadequate intake is estimated as the proportion of the population with usual intakes below the median requirement (EAR)(1, Reference Beaton16). In the case of nutrients such as vitamins D and K, K and Ca, for which there is not enough information to set an EAR cut-off point value, the distribution of intake was estimated and compared with the Adequate Intake (AI). For these nutrients, we calculated the proportion of individuals with usual intakes equal to or above the AI value. Na intake was evaluated with respect to the Tolerable Upper Intake Level (UL), which estimates the percentage of a population potentially at risk for adverse effects(17). Inadequate prevalence was further calculated according to categories of per capita family income, parental educational level and overweight status.
Each stratum was composed of participants of both sexes. Therefore, for nutrients with different intake recommendations because of differences in sex, the estimated percentage below or above the EAR was computed as an average of the percentage of sex subgroups comprising the composite group weighted proportionally by population size(Reference Moshfegh, Goldman and Cleveland4). Differences in prevalence between sexes and strata were verified by a two-sided proportional test (5 % significance level) using the survey commands of the STATA statistical software package version 9·1 (StataCorp., College Station, TX, USA) to incorporate sampling weights.
Results
The mean age of the sample was 16·5 (se 0·06) years. The prevalence of overweight was 15·0 % among male and 11·8 % among female participants (P = 0·081). The proportion of adolescents with per capita family income <1 minimum wage was 63 % for male and 56 % for female participants (P = 0·21). Most adolescents (67 % male and 62 % female) had parents with a low educational level (P = 0·29).
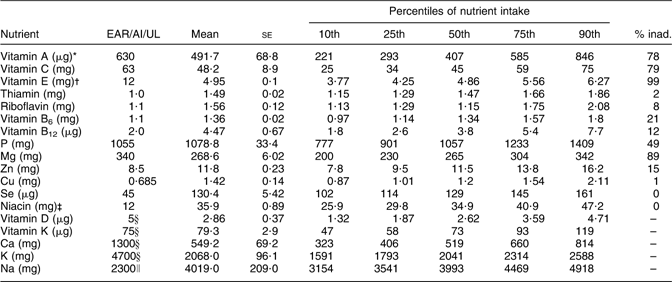
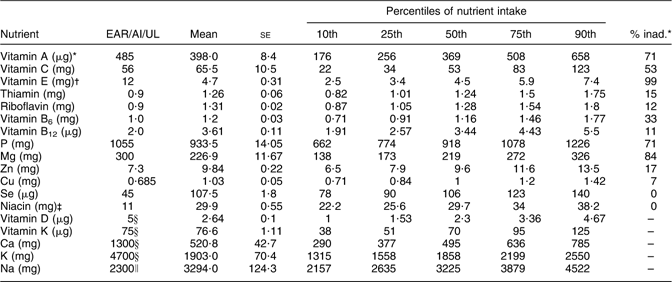
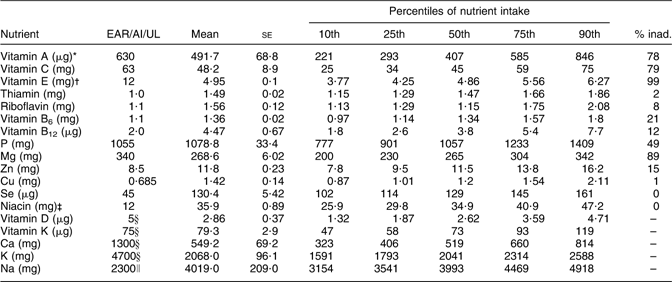
A high prevalence of inadequate intake for vitamins E, A, C and B6, as well as for Mg and P, for both sexes is described in Tables 1 and 2. The risk of inadequate intake was low for riboflavin, thiamin, Se, niacin and Cu. For these nutrients, the usual intake was below the EAR for <15 % of the adolescents. The prevalence of inadequate intakes of P, vitamin B6, thiamin and Cu was higher in female than in male participants. In contrast, the risk of vitamin C inadequacy was higher in male than in female participants (P < 0·05).
Table 1 Recommended nutrient intake, mean, se and percentiles of nutrient intake and prevalence of inadequate intake among male adolescents (n 276), São Paulo, Brazil, 2003

EAR, Estimated Average Requirement; AI, Adequate Intake; UL, Tolerable Upper Intake Level; % inad., prevalence of inadequate intake.
*Calculated as retinol activity equivalents.
†Calculated as α-tocopherol equivalents.
‡Calculated as niacin equivalents.
§AI.
∥UL.
Table 2 Recommended nutrient intake, mean, se and percentiles of nutrient intakes and prevalence of inadequate intake among female adolescents (n 249), São Paulo, Brazil, 2003

EAR, Estimated Average Requirement; AI, Adequate Intake; UL, Tolerable Upper Intake Level; % inad., prevalence of inadequate intake.
*Calculated as retinol activity equivalents.
†Calculated as α-tocopherol equivalents.
‡Calculated as niacin equivalents.
§AI.
∥UL.
The proportion of participants with Ca and K intakes above the AI values was <1 % in adolescents of both sexes. With regard to vitamin D, the proportions of male and female adolescents with intakes above the AI values were 7 % and 8 %, respectively. For vitamin K, the proportions were 46 % and 43 % for male and female participants, respectively. With respect to Na intake, 99 % and 86 % of the male and female adolescents, respectively, had intakes higher than the UL value, with no statistically significant difference between the sexes.
The prevalence of inadequate nutrient intake with regard to income, parental educational level and nutritional status is shown in Table 3.
Table 3 Prevalence of inadequate nutrient intake according to parental educational level, income and nutritional status among adolescents in São Paulo, Brazil, 2003

Parental educational level: low, <8 full years of education; high, ≥8 eight full years of education. Income: low, <1 minimum wage per capita; high, ≥1 one minimum wage per capita.
*Two-sided proportional test.
Compared with adolescents from lower-income families, adolescents from higher-income families had a lower prevalence of inadequate intake for vitamins A, C, B6, B12, P, Zn, riboflavin and thiamin. Except for Zn and thiamin, the inadequate intakes of these same nutrients were more prevalent among adolescents categorised into the lower parental educational level group than among those in the higher parental educational level group.
Compared with non-overweight adolescents, overweight adolescents had a higher prevalence of inadequate intake for vitamin A, Mg, P, riboflavin and thiamin.
For nutrients with only AI values established, higher income and parental educational level were associated with a higher proportion of adolescents with vitamin K intake greater than the recommended value. Compared with non-overweight adolescents, overweight adolescents were more likely to have usual intake levels of vitamins D and K lower than AI values.
Discussion
The present population-based study, the first to our knowledge, assessed the prevalence of inadequate nutrient intake among adolescents in Brazil and found a high prevalence of inadequate consumption of vitamins A, C, E and B6, as well as of Mg and P. In addition, we found that a small proportion of adolescents had Ca intake above the AI value and that Na intake was above the levels considered safe for most adolescents. We also observed a higher prevalence of inadequate nutrient intake among those in the lower income and lower parental educational level strata compared with those in the higher income and higher parental educational level strata.
The nutrients with a high prevalence of inadequacy in Brazil were the same as those found to be inadequate in US populations assessed using the National Health and Nutrition Examination Survey 2001–2002, although the magnitude of inadequacy in the present study was higher for most of the nutrients. For example, in Brazilian male and female adolescents, the prevalence of inadequate intake was 78 % and 71 % for vitamin A, 79 % and 53 % for vitamin C and 21 % and 33 % for vitamin B6, respectively. In US male and female adolescents, the prevalence of inadequate intake was 55 % and 54 % for vitamin A, 26 % and 42 % for vitamin C and <3 % and 16 % for vitamin B6, respectively(Reference Moshfegh, Goldman and Cleveland4).
The chosen criterion of nutritional adequacy or adverse effects on which the DRI is based is different for each nutrient as identified in the DRI nutrient reports. In the case of adolescents, dietary requirements are high because of growth spurts, puberty and cognitive development(Reference DiMeglio18). Furthermore, vitamins A, C and E, which are nutrients with a high prevalence of inadequate intake among the adolescents in the present study, have antioxidant functions and can be protective against diseases(19, 20). Previously, the highest quintiles of vitamin E intake and vegetable fats during adolescence were found to be associated with a reduced risk of breast cancer during adulthood(Reference Frazier, Li and Cho21). Moreover, a combined intake of vitamins C and E had an effect on the reduction of atherosclerosis progression in hypercholesterolaemic subjects(Reference Salonen, Nyyssönen and Kaikkonen22). In addition to the inadequate intake of these nutrients, a higher intake of Na was also related to an increased risk of CVD(Reference Cook, Cutler and Obarzanek23).
Our results add evidence that socio-economic factors are determinants of dietary patterns. The cost and access to foods might partially explain this phenomenon. Diets that are comprised of foods with a high nutrient concentration and low energy density are usually more expensive than those based on refined grains, added sugar and fats(Reference Drewnowski, Darmon and Briend24). According to data from a national survey on household food availability in Brazil, the relative intakes of fruit, vegetables, milk and meat increase with income, although the consumption of fresh vegetables was shown to be modest even in the richest stratum(Reference Levy-Costa, Sichieri and Pontes3). The same effect was observed with regard to parental educational level: those in the lowest stratum of parental educational level and those in the low-income group were more likely to have an inadequate intake for almost all nutrients. One plausible explanation is that the heads of households with higher levels of education have more knowledge about healthy habits and are therefore able to adopt healthier eating patterns and influence their children's food choices(Reference Xie, Gilliland and Li25).
The assessment of the prevalence of inadequate nutrient intake requires information regarding the population's distribution of usual nutrient intakes, which can be estimated using statistical methods. If intake distributions are not properly adjusted for both within-person variability and survey-related effects, the prevalence of nutrient inadequacy will be incorrectly estimated(1, Reference Carriquiry26). Although several methods have been proposed for the adjustment of dietary data, we used the method that is one of the most efficient for the estimation of the usual intake distribution(Reference Hoffman, Boing and Dufour15). Furthermore, this method was recommended by both the IOM and WHO to estimate the prevalence of inadequate nutrient intake(1, Reference Murphy and Vorster27).
The external within-person variance components were used to adjust the intake distribution, and this adjustment may be a possible limitation in the study. However, this procedure is recommended for estimating the distribution of usual nutrient intake when only a single, short-term dietary measurement for each participant is available(Reference Jahns, Arab and Carriquiry12, Reference Murphy, Guenther and Kretsch13). Moreover, the variance components were generated from dietary measurements replicated in the same individuals from the initial sample, although within a 4-year interval. In this regard, we can argue that Brazil has experienced political and economic stability during this period and that no events occurred that could have led to a change in food patterns. Another limitation of the present study may be the misreporting or under-reporting of dietary intake. Nevertheless, these errors may have been minimised by the interviewers’ training, information checking and by the adoption of the standardised multiple-pass approach.
The present population-based study used methods proposed by the IOM and WHO and found a high prevalence of inadequate nutrient intake, which may be related to the development of chronic diseases including cancer and CVD, in an adolescent population. Participants categorised into lower income, lower parental educational level and overweight groups appear to be at increased risk of inadequate intake for some nutrients.
Acknowledgements
The authors thank The State of São Paulo Research Foundation (FAPSEP; process no. 07/52119-0, 07/51489-9, 98/140999-7) and the Brazilian National Research Council (CNPq; process no. 502948/2003-5) for the financial support provided to them. The authors have no conflict of interest to declare. C.L.G.C., D.M.L.M. and R.M.F. participated in planning and study design and in review of the manuscript; E.V.J. conducted the analyses; E.V.J. and D.M.L.M. were involved in conception of the manuscript.


