Infertility is a common condition that affects approximately 12–15 % of all couples who attempt conception( Reference Smith, Pfeifer and Collins 1 ). Identifying potentially modifiable factors that can improve fertility is an important public health goal, especially as there is a trend of delayed childbearing among Danish women( 2 , Reference Martin 3 ). Diet is a modifiable factor that may play an important role in fertility, potentially through effects on hormones( Reference Aubertin-Leheudre, Gorbach and Woods 4 – Reference Goldin, Adlercreutz and Gorbach 7 ), menstrual cycle patterns( Reference Pedersen, Bartholomew and Dolence 8 , Reference Barr 9 ) and systemic inflammation( Reference Ruder, Hartman and Blumberg 10 ). A series of studies using data from the Nurses’ Health Study has suggested associations of protein source( Reference Chavarro, Rich-Edwards and Rosner 11 ), Fe( Reference Chavarro, Rich-Edwards and Rosner 12 ), dairy products( Reference Chavarro, Rich-Edwards and Rosner 13 ), trans-fatty acids( Reference Chavarro, Rich-Edwards and Rosner 14 ) and B-vitamins( Reference Chavarro, Rich-Edwards and Rosner 15 ) with ovulatory infertility. There are few studies on the role of diet on fecundability, the per cycle probability of conception, using a prospective cohort design( Reference Mumford, Sundaram and Schisterman 16 – Reference Vujkovic, de Vries and Lindemans 18 ). The ‘Snart Forældre’ (‘Soon Parents’) study, initiated in 2011, is an extension of ‘Snart Gravid’ (‘Soon Pregnant’), a prospective cohort study of Danish pregnancy planners (2007–2011)( Reference Huybrechts, Mikkelsen and Christensen 19 – Reference Wise, Rothman and Mikkelsen 21 ). A central aim of the ‘Snart Forældre’ study is to investigate the association between pre-pregnancy diet and fecundability. Unlike most previous studies of diet and fertility( Reference Chavarro, Rich-Edwards and Rosner 11 – Reference Chavarro, Rich-Edwards and Rosner 15 ), our study will be able to assess the role of the woman’s diet on a wide spectrum of fertility problems by measuring pre-conception diet in relation to the monthly probability of conception.
FFQ are widely used in epidemiological studies because they are less expensive than other dietary methods and easy to administer in large cohort studies. FFQ are often used in studies that assess diet–disease associations( Reference Sauvageot, Alkerwi and Albert 22 ) to rank individuals according to high and low intake of foods and nutrients. Furthermore, the FFQ is easily transformed into a web-based format, which is an advantage in Internet-based studies like ‘Snart Forældre’, as the web-based data collection facilitates data processing and nutrient calculation in a large study population. The widespread use of the Internet (in 2012, 92 % of all 16–74-year-old citizens in Denmark had Internet access at home( 23 )) thus enables web-based studies.
To assess dietary intake among Danish women planning a pregnancy, we developed a web-based FFQ based on the FFQ used in the Danish National Birth Cohort study( Reference Olsen, Mikkelsen and Knudsen 24 ), updated for our target population of reproductive age women. The aim of the present study was to assess the relative validity of the web-based FFQ using a 4 d food diary as reference.
Materials and methods
‘Snart Forældre’
The ‘Snart Forældre’ study is an Internet-based prospective cohort study of Danish pregnancy planners. Enrolment began in August 2011 and eligible women are 18–45 years old, in a relationship with a male partner, attempting to conceive and not using fertility treatment. Potential participants are recruited via a coordinated media strategy and enrolment is carried out via the study website. Using online questionnaires, data on health and lifestyle as well as demographic factors are collected at baseline and bimonthly for 12 months or until recognized conception. Participants are asked to complete the FFQ ten days after enrolment. The FFQ was implemented in September 2012; by 15 September 2014, a total of 1156 of 1402 ‘Snart Forældre’ participants (82·5 %) had completed the FFQ.
Development of the FFQ
The semi-quantitative, web-based FFQ was based on the paper-based FFQ applied in the Danish National Birth Cohort( Reference Olsen, Mikkelsen and Knudsen 24 ) and the ‘Diet, Cancer and Health’ study( Reference Overvad, Tjonneland and Haraldsdottir 25 ), and was updated using information on usual dietary intake in Danish women aged 18–49 years( Reference Pedersen, Fagt and Groth 26 ) to capture intakes of foods and nutrients in this age group. In the web-based FFQ, participants are asked to record their usual intakes of foods and drinks in the previous year. The FFQ included approximately 220 foods and beverages. In addition, seven photographic series with varying portion sizes of foods and dishes typical in a Danish diet are included to help participants assess portion sizes. In the development phase, the FFQ was pilot-tested, resulting in a few alterations to the FFQ; some questions were reformulated for clarity, response categories were added and additional guidance on how to complete the FFQ was included. Feasibility was a main objective in the development of the web-based FFQ. Thus, the FFQ includes help buttons explaining portion sizes and describing additional examples of food items and dishes. Skip patterns are implemented to shorten the length of the questionnaire. To minimize missing values and errors in data entry, the web-based FFQ includes radio buttons, check boxes and drop-down menus for response options. In addition, a continuously updated progress bar at the bottom of each page illustrates the number of remaining questions. The FFQ does not record use of dietary supplements, as these are recorded in the baseline and follow-up questionnaires in the ‘Snart Forældre’ study. Nutrient contributions from supplements were therefore not included in the analyses.
Food diary
We validated the FFQ against a self-administered 4 d food diary (FD) containing pre-coded lines of common Danish dishes, foods and beverages, which is applied in the Danish National Survey of Diet and Physical Activity (DANSDA) and has been validated against objective measures and a weighed food record( Reference Biltoft-Jensen, Groth and Matthiessen 27 , Reference Knudsen, Gille and Nielsen 28 ). The FD is structured according to a typical Danish diet, with breakfast, lunch, dinner and three snacks, each with pre-coded lines of the most commonly eaten foods and beverages. Portion sizes are estimated using household measures (cups, glasses, slices, etc.) and twelve series of photographs with varying portion sizes of commonly eaten foods.
Validation study
We aimed to recruit 100 participants for the validation study. Eligible participants from the main study were consecutively invited to participate. In total, 128 women were invited in the period 17 August to 20 November 2013; from these, 100 (78 %) women agreed to participate and ninety-seven (76 %) completed the FD. Within 1–3 d after completion of the online FFQ the participants received the pre-coded food diaries, including instructions on how to complete them, the portion size photo series and prepaid return envelopes, by postal mail. In the instructions, participants were advised to report to the diary immediately after each meal throughout the 4 d. By random assignment, we asked the participants to complete the food diaries starting on the first coming Wednesday or first coming Sunday after they received the diaries, thereby including three weekdays and one weekend day. The FD were manually checked for completeness and scanned, and then intakes of foods and nutrients for each participant were calculated using GIES (General Intake Estimation System) software, developed at the National Food Institute, including standard recipes, information on portion sizes and data from the Danish Food Composition Tables (www.foodcomp.dk). This method has been described in detail elsewhere( Reference Biltoft-Jensen, Matthiessen and Rasmussen 29 ). The data from the FFQ were cleaned and processed, all frequencies were converted to frequencies per day, and intakes of foods and nutrients were calculated using standard recipes, portion sizes and information from the Danish nutrient database (www.foodcomp.dk).
Statistical methods
Based on prior validation studies, participants with very low/very high energy intakes, i.e. below 2·5 MJ/d or above 25 MJ/d (<600 kcal or >6000 kcal), in either of the two diet assessment methods are generally excluded from analysis. However, none of the participants had energy intakes outside these limits and no dietary data were excluded from the present analyses. Intakes of foods and nutrients from both the FFQ and the FD were adjusted for total energy intake using the residual method( Reference Willett, Howe and Kushi 30 ).
We compared characteristics of the study population and the remaining ‘Snart Forældre’ cohort using means, medians and proportions. We compared median and mean food and nutrient intakes, as assessed by the two methods, using the paired t test when normally distributed (nutrients) and the Wilcoxon signed-rank test when non-normally distributed (foods). Agreement between the FFQ and the FD was assessed by Bland–Altman plots. Correlations between intakes were assessed by the Pearson correlation coefficient for energy-adjusted nutrients and foods. As day-to-day variation in pre-coded FD may attenuate the correlations between the mean intakes from the FD and intakes from the FFQ, de-attenuated coefficients, r t, were calculated using the formula:
where r o is the observed correlation coefficient, intra x is the within-person variance for intakes estimated in the FD, inter x is the between-person variance and n x is the number of days of diet registration( Reference Willett 31 ). Furthermore, the participants were divided into quintiles according to intake of foods and nutrients, and agreement between the two methods was assessed using cross-classification. Proportions of individuals who were categorized into the same or adjacent quintile were calculated, and the gross misclassification was defined as the percentage of individuals categorized into opposite lowest v. highest quintiles across the two methods.
Results
A total of ninety-seven women completed both dietary assessment methods. Mean duration of completion of the FFQ was 29 min. The mean age of participants and their partners was 29 years and 31 years, respectively, in both the validation group and the ‘Snart Forældre’ group (Table 1). Participants in both groups were similar according to level of education, number of units of alcohol consumed per week, pack-years of smoking and most recent contraceptive used at study entry. Participants in the validation study had a lower mean BMI compared with ‘Snart Forældre’ participants (23·0 v. 24·5 kg/m2) and a similar level of physical activity (median MET-h/week: 35·4 v. 36·2, where MET=metabolic equivalent of task).
Table 1 Characteristics of participants in the validation study (n 97) and participants in the ‘Snart Forældre’ cohort (n 734)
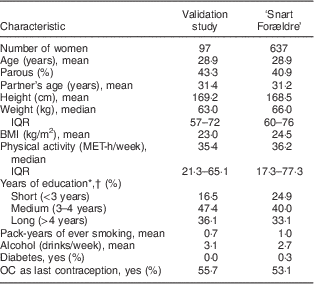
IQR, interquartile range; MET, metabolic equivalent of task; OC, oral contraceptive.
* Years of education after 9 years of compulsory schooling.
† Missing data for thirteen (1·8 %) participants in the ‘Snart Forældre’ group.
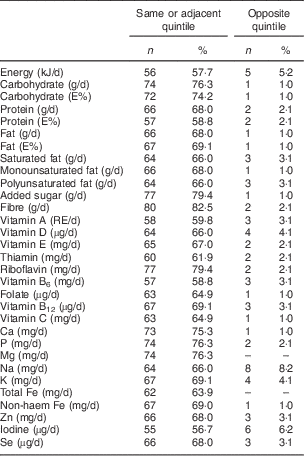
The Bland–Altman plots for total energy intake and vegetable intake revealed some extreme values, but no systematic patterns were observed (Figs 1 and 2). Estimated intakes of total energy and macronutrients were generally higher when assessed by the FD compared with the FFQ (Table 2), but only small differences were seen in the distribution of macronutrients, i.e. percentage of energy from carbohydrate, protein or fat, respectively. As the 95 % CI overlapped, no statistically significant differences in mean intakes were detected for most of the micronutrients. Exceptions included vitamin C, where intake was higher for the FFQ; and Ca, P, Mg, total Fe, Na and Zn, where higher intakes were observed for the FD compared with the FFQ. Pearson correlation coefficients ranged from 0·08 (Na) to 0·63 (carbohydrate/fibre, g/d); the de-attenuated correlation coefficients ranged from 0·13 (Na) to 0·93 (vitamin D; Table 2). Cross-classification analysis showed that added sugar, fibre, riboflavin and carbohydrate were most often correctly classified, with 79·4, 82·5, 79·4 and 76·3 % of participants, respectively, classified in the same or adjacent quintile (Table 3).
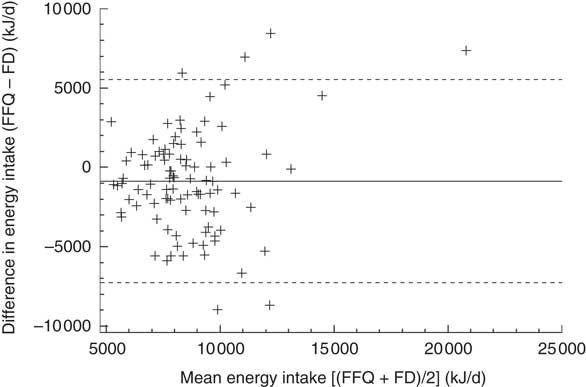
Fig. 1 Bland–Altman plot assessing the relative validity of the newly developed, semi-quantitative web-based FFQ among participants (n 97; women aged 20–42 years) from the ‘Snart Forældre’ study, Denmark, 2013. The difference in energy intake between the FFQ and the 4 d food dairy (FD) is plotted v. the mean energy intake from the two methods. ——— represents the mean difference (bias) and – – – – – represent the limits of agreement
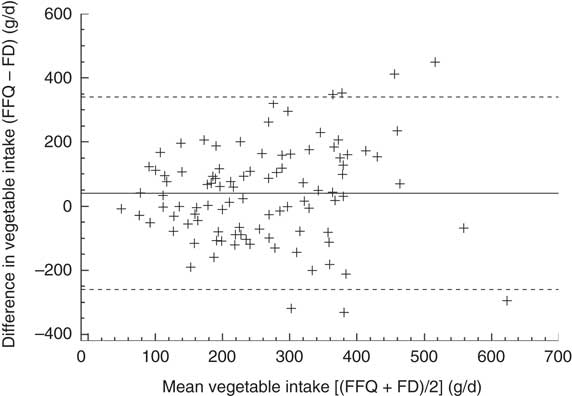
Fig. 2 Bland–Altman plot assessing the relative validity of the newly developed, semi-quantitative, web-based FFQ among participants (n 97; women aged 20–42 years) from the ‘Snart Forældre’ study, Denmark, 2013. The difference in vegetable intake between the FFQ and the 4 d food dairy (FD) is plotted v. the mean vegetable intake from the two methods. —— represents the mean difference (bias) and – – – – – represent the limits of agreement
Table 2 Mean daily intakes of macro- and micronutrientsFootnote * from the 4 d food diary (FD) and the newly developed, semi-quantitative, web-based FFQ; relative differences and 95 % CI for the differences between the FD and FFQ; and Pearson correlation coefficients and de-attenuated coefficients between intakes from the FD and FFQ. Participants (n 97; women aged 20–42 years) from the ‘Snart Forældre’ study, Denmark, 2013
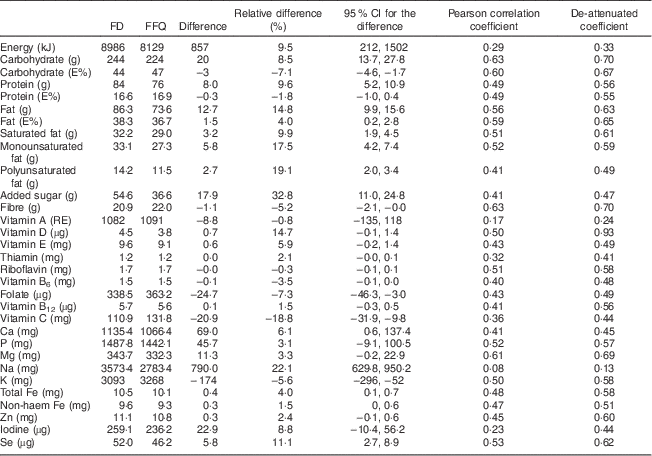
E%, percentage of total energy; RE, retinol equivalents.
* All nutrients except total energy were energy-adjusted using the residual method( Reference Willett, Howe and Kushi 30 ).
Table 3 Cross-classification analysis of nutrient intakes estimated by the 4 d food diary and the newly developed, semi-quantitative, web-based FFQ: number and percentage in the same or adjacent quintile, and number and percentage grossly misclassified (opposite quintile). Participants (n 97; women aged 20–42 years) from the ‘Snart Forældre’ study, Denmark, 2013
E%, percentage of total energy.
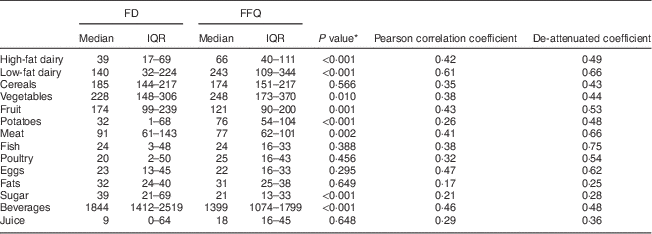
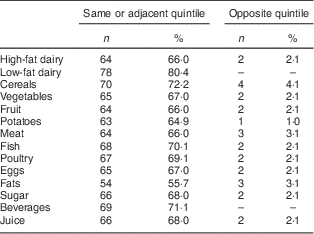
Median intakes of dairy products, vegetables and potatoes were higher in the FFQ assessment, while fruit, meat, sugar and beverages were lower in the FFQ, compared with the FD (Table 4). Pearson correlation coefficients for energy-adjusted foods ranged from 0·17 for fats (butter, spread, oil, etc.) to 0·61 for low-fat dairy products (Table 4). De-attenuated coefficients ranged from 0·25 (fats) to 0·75 (fish). Low-fat dairy products, cereals and beverages had the highest proportions of individuals correctly classified, with 80·4, 72·2 and 71·1 %, respectively, classified in the same or adjacent quintile (Table 5).
Table 4 Median (and interquartile range) daily intakes of food groups (g/d) estimated by the 4 d food diary (FD) and the newly developed, semi-quantitative, web-based FFQ; P values for differences in intake between the FD and FFQ; and Pearson correlation coefficients and de-attenuated coefficients between intakes from the FD and FFQ. Participants (n 97; women aged 20–42 years) from the ‘Snart Forældre’ study, Denmark, 2013
IQR, interquartile range.
* Wilcoxon signed-rank test.
Table 5 Cross-classification analysis of food group intakes (g/d) estimated by the 4 d food diary and the newly developed, semi-quantitative, web-based FFQ: number and percentage in the same or adjacent quintile, and number and percentage grossly misclassified (opposite quintile). Participants (n 97; women aged 20–42 years) from the ‘Snart Forældre’ study, Denmark, 2013
Discussion
The present validation study of a newly developed web-based FFQ among Danish women of reproductive age performed well relative to the reference method, a 4 d FD. Correlation coefficients for most of the foods and nutrients were in the range of what has previously been reported in validation studies of FFQ( Reference Toft, Kristoffersen and Ladelund 32 – Reference Streppel, de Vries and Meijboom 34 ). Direct comparisons of mean intakes of foods and nutrients across the two methods showed some discrepancies for selected nutrients, but the aim of the FFQ is to rank participants according to high v. low intake of the foods and nutrients under study. However, the overall agreement of the two methods was acceptable.
Total energy intake differed between the two methods, with higher energy intake in the FD relative to the FFQ. Although total energy intake may have been slightly underestimated in the FFQ, good correlations for macronutrients were observed (0·70, 0·56 and 0·63 for carbohydrate, protein and fat, respectively), indicating that potential under-reporting of energy may not be specific to certain foods or food groups. Also the macronutrient distribution showed good agreement with data for energy distributions in the Danish population( Reference Pedersen, Fagt and Groth 26 ). This, together with relatively strong correlations, ensures a solid basis for testing hypotheses of associations between diet and fertility. FFQ may overestimate energy intake compared with food records, possibly as a consequence of a high number of questions on intake. In the present questionnaire, questions at the food group level were used to adjust the questions on more detailed intake (e.g. reported overall fruit intake was used to adjust the total intake of apples, pears, bananas, etc.). Furthermore, as the current FFQ used electronic skip patterns, participants were not asked irrelevant questions and this may have reduced over-reporting.
Food and nutrient intakes were adjusted for total energy intake. Adjusting for total energy is often done in epidemiological studies of the association between diet and disease, and therefore it is appropriate to include energy adjustment in validation studies too. Furthermore, adjusting for total energy intake has been shown to bring the other nutrients into alignment. Among micronutrients, highest correlation coefficients were seen for vitamin D, Mg and Se. High correlation coefficients between FFQ and 24 h recall have been reported for vitamin D by Elorriaga et al.( Reference Elorriaga, Irazola and Defago 33 ) and Streppel et al.( Reference Streppel, de Vries and Meijboom 34 ). Toft et al.( Reference Toft, Kristoffersen and Ladelund 32 ) and Johansson et al.( Reference Johansson, Hallmans and Wikman 35 ) found correlations for saturated fat of the same magnitude as in the present study when comparing FFQ and 24 h recalls. Among the micronutrients we evaluated, the lowest correlations were for vitamin A (r=0·24) and Na (r=0·13). Vitamin A has been poorly correlated across methods in other studies( Reference Johansson, Hallmans and Wikman 35 – Reference Paalanen, Männistö and Virtanen 37 ), likely due to the large variability in intake of food sources rich in vitamin A( Reference Johansson, Hallmans and Wikman 35 ). Because of the high day-to-day variability, habitual intake may not be well captured in the 4 d food record( Reference Basiotis, Welsh and Cronin 38 ). Intake of Na is known to be poorly assessed by most dietary assessment methods( Reference Labonte, Cyr and Baril-Gravel 39 – Reference George, Milani and Hanss-Nuss 41 ). Added salt in cooking or at the table was not recorded in either method and Na intake, as assessed here, originates only from processed foods and dishes in the nutrient database. Because food items that are similar in contents of other nutrients can vary greatly in salt content, there can be large differences in salt intake assessed by a food record and a long-term measure of usual intake (FFQ).
Among food groups, the strongest correlations were seen for intakes of low-fat dairy products, meat and beverages. Streppel et al.( Reference Streppel, de Vries and Meijboom 34 ), Paalanen et al.( Reference Paalanen, Männistö and Virtanen 37 ) and Macedo-Ojeda et al.( Reference Macedo-Ojeda, Vizmanos-Lamotte and Marquez-Sandoval 42 ) also found good correlations for dairy products and meat, while in contrast Streppel et al. reported poorer correlation for intake of beverages( Reference Streppel, de Vries and Meijboom 34 ). The validity of intake of food groups is not as easily compared with results from other studies as is validity of nutrients, as food groups are classified in various ways. However, fruit, vegetables and fish are well-defined food groups and the correlations for these groups were comparable to what have previously been reported( Reference Toft, Kristoffersen and Ladelund 32 , Reference Elorriaga, Irazola and Defago 33 , Reference Macedo-Ojeda, Vizmanos-Lamotte and Marquez-Sandoval 42 ). We found low correlation between methods for intake of fats (e.g. butter, spread, oil). Detailed information on type of fats used in cooking (frying, etc.) was recorded in the FFQ because the association between fatty acids and fecundability is a central hypothesis of the ‘Snart Forældre’ study. In contrast, in the FD, fats used in cooking were assessed using standard recipes, which may explain the somewhat poor correlation. The relatively high correlation of saturated fat between the two methods may be explained by other sources of saturated fat such as dairy products, meat, etc.
The relatively high correlations for both food groups and nutrients were further supported by cross-classification analysis. Very few women were grossly misclassified and the majority of women, for most foods and nutrients, were either identically classified or within one adjacent category. These results are in accordance with results from other validation studies of FFQ( Reference Toft, Kristoffersen and Ladelund 32 , Reference Pinto, Severo and Correia 43 ) and demonstrate the ability of the FFQ in ranking individuals according to low and high intake, respectively. In both the correlations and the cross-classification, results tended to be stronger for nutrients than for foods. Nutrient intake is expected to be more evenly distributed due to contributions from various foods, while larger day-to-day variation has been reported for intake of foods( Reference Palaniappan, Cue and Payette 44 ). This is further evidenced by the greater improvement in correlations for foods after adjusting for day-to-day variability.
When comparing intakes assessed in this population with those in a nationally representative sample of Danish women( Reference Pedersen, Fagt and Groth 26 ), intakes for the participants in ‘Snart Forældre’ were similar to those of the larger sample of Danish women, with the exception of higher intakes of fish and vegetables, and lower intake of potatoes, among ‘Snart Forældre’ participants. However, the age range in the national sample was 18–75 years, and thus included women of older age than those in ‘Snart Forældre’. Furthermore, participants in ‘Snart Forældre’ are likely to belong to a somewhat select group, with greater awareness of healthy eating habits, as pregnancy planning has been associated with healthier lifestyle( Reference Backhausen, Ekstrand and Tyden 45 ), and as participants in health surveys in general may be more health-conscious compared with the background population( Reference Hennekens and Buring 46 ). However, this is unlikely to affect the internal validity of analyses of diet and fertility, as participation is not expected to be associated with both exposure (diet) and outcome (fertility) because the outcome is not known at the time of exposure assessment( Reference Olsen, Melbye and Olsen 47 ).
When assessing the validity of a method (FFQ) using another method as reference (e.g. FD), it is important that the errors in the two methods are uncorrelated( Reference Kaaks, Ferrari and Ciampi 48 ). Assessing usual dietary intake by FFQ is highly dependent on the participant’s pattern memory, while the FD is recorded at the time of consumption and thus not dependent on memory. Further, filling in the FFQ retrospectively would have no influence on the participant’s habitual intake, while recording the diet on four consecutive days (FD) may alter the participant’s diet. Thus, errors associated with FFQ and FD are to some extent considered to be independent, leading to true values of correlation( Reference Margetts and Nelson 49 ).
Under-reporting is a problem in most dietary survey methods and cannot be avoided in the present study, but any resulting error in dietary measurement should be non-differential with respect to disease outcome( Reference Kipnis, Subar and Midthune 50 ). Such misclassification would attenuate the true association, e.g. bias effect estimates towards the null for extreme categories.
A potential limitation of the present validation study is the lack of an objective measure, e.g. a biomarker of dietary intake independent of self-reported intake, with which to compare the FFQ, to further examine the validity of the FFQ. However, the purpose of the FFQ is to rank the participants according to intake rather than to assess the absolute intake. Therefore, a relative validation method, such as the FD, may be appropriate in assessing validity. Furthermore, biomarkers are not always useful because they may measure short-term intake and the study’s purpose is measuring dietary intake over a longer period. A strength of the study is that a large proportion of the ‘Snart Forældre’ participants invited to the validation study completed the FFQ (82 %), indicating the study results will be generalizable to the entire ‘Snart Forældre’ cohort.
Conclusion
In conclusion, the present validation study showed that a web-based FFQ designed for women of reproductive age is appropriate for collecting data on dietary intake among Danish pregnancy planners. Further modification and testing of the FFQ would be needed to extend its use to other groups such as men, different age groups, or groups with different cultural backgrounds.
Acknowledgements
Acknowledgements: The authors would like to thank Ms Tina Christensen for her support in data collection and Anders Hammerich Riis for support in data handling. Financial support: This study was supported by the Eunice Kennedy Shriver National Institute of Child Health and Human Development (NICHD; R01-060680) and the Danish Medical Research Council (271-07-0338). The funders had no role in the design, analysis or writing of this article. Conflict of interest: None. Authorship: V.K.K., E.M.M., E.E.H. and H.C. planned and carried out the validation study; T.C. conducted nutrient analyses; V.K.K. conducted statistical analyses; V.K.K., E.M.M., K.L.T., E.E.H., L.W. and H.C. were involved in analyses and interpretation of the results; all authors assisted in drafting of the manuscript. Ethics of human subject participation: The study was conducted according to the guidelines laid down in the Declaration of Helsinki and was approved by the Institutional Review Boards of Boston University (IRB number #H29427) and the Danish Data Protection Agency (record number 2013-41-1922).


