Prediabetes is a state in which individuals have glucose levels that are higher than normal but do not meet the criteria for diabetes. This condition represents a high risk for diabetes and CVD( 1 ). It has been reported that between 5 and 10 % of people with prediabetes will develop diabetes annually, and 70 % will develop it eventually( Reference Tabák, Herder and Rathmann 2 ). The associations of prediabetes with modifiable and non-modifiable factors have been studied in some populations, with the results suggesting different patterns of associations in different populations( Reference Anjana, Shanthi Rani and Deepa 3 – Reference Wu, Lin and Hung 6 ). Identifying the modifiable factors that are associated with prediabetes is important because they can be the targets of effective prevention strategies.
Furthermore, the definition of prediabetes has changed since 1979 with the reduction of the cut-off point of fasting glucose in 2003 and the inclusion of glycated Hb (HbA1c) as a new diagnostic criterion in 2009( 1 , 7 ). This is the reason why many of the available studies did not integrate HbA1c in their definition of prediabetes or did not use the recent glucose cut-off point( Reference Anjana, Shanthi Rani and Deepa 3 – Reference Wu, Lin and Hung 6 ). Therefore, it is important to generate new studies that use the most recent definition of prediabetes.
The Comcáac (Seri Indians) are a non-agricultural, small ethnic group of about 800 people( 8 ) who live on the coast and in the desert of Sonora, Mexico( Reference Rentería-Valencia 9 ). They belong to the Hokan-Coahuiltecan linguistic family and are probably related to the Macro-Yuma trunk( Reference Infante, Olivo and Alaez 10 ). Historically, the Comcáac territory encompassed the area from Puerto Lobos to Guaymas in north-western Sonora. The Comcáac used to have a nomadic lifestyle; they lived in temporary camps as groups of families and mobilized depending on the available natural resources. Their principal subsistence activities were fishing or hunting animals and gathering desert fruits( Reference Villela and Palinkas 11 , Reference Luque and Robles 12 ). However, after their integration into the national state and the market economy, they settled into the communities of Punta Chueca and El Desemboque, located on the coast of Sonora, and changed their culture and lifestyle( Reference Luque and Robles 12 ). Currently, their principal activities are commercial fishing, selling crafts and permits for sport hunting( Reference Rentería-Valencia 9 ).
The processes of modernization and sedentarization that the Comcáac community suffered have been associated with obesity and type 2 diabetes in other populations( Reference Esparza-Romero, Valencia and Urquidez-Romero 13 ). The aim of the present study was to determine the prevalence of and modifiable factors associated with prediabetes among adults in the Comcáac communities.
Methods
Study population
The current cross-sectional study was conducted from May 2014 to February 2015 and was approved by the ethics committee of the Centro de Investigacion en Alimentacion y Desarrollo (number CE/005/2013).
All people from the two Comcáac communities aged 20 years or older were invited to participate in the survey through a face-to-face home interview conducted by trained personnel and the health promoter of each community. Participants were asked to give written informed consent before participation.
Biochemical analysis
An oral glucose tolerance test was performed after a 10–12 h fast, using a 75 g glucose load (Dextrosol, catalogue number 5375; Hycel) and plasma glucose was determined by the glucose oxidase method (Randox GOD/PAP®). HbA1c was measured in whole blood using EDTA as an anticoagulant by the NycoCard® standardized method according to the recommendations of the ERL (European Reference Laboratory for Glycohemoglobin) and certified according to the protocol ERL Check-Up to a DCCT level. Prediabetes was defined as fasting plasma glucose level ranging from 100 to 125 mg/dl, 2 h plasma glucose level ranging from 140 to 199 mg/dl, and/or HbA1 level ranging from 5·7 % (39 mmol/mol) to 6·4 % (47 mmol/mol)( 1 ).
Serum cholesterol was determined by the endpoint enzymatic method (Randox Cholesterol kit) and TAG by the enzymatic colorimetric endpoint method (Randox Triglycerides GPO-PAP). Serum HDL cholesterol was measured by the direct clearance method (Randox HDL-cholesterol assay) and serum insulin was determined by a sandwich ELISA (DRG Diagnostics Insulin ELISA). Insulin resistance was evaluated with the homeostasis model assessment of insulin resistance (HOMA-IR)( Reference Matthews, Hosker and Rudenski 14 ). Biochemical analyses were performed at the laboratory of the Diabetes Research Unit, Centro de Investigacion en Alimentacion y Desarrollo.
Anthropometric and physical measurements
Weight was measured with a digital electronic scale with a capacity of 150 kg±50 g (Ohaus Defender™ 3000). Height was measured with a Harpenden portable stadiometer (Holtain Ltd) with a range of approximately 0·1 cm. BMI was calculated as [weight (kg)]/[height (m)]2. Waist circumference was measured in the supine position at the umbilicus using an anthropometric fibreglass tape (Lafayette Instruments Company, Inc.) that ranged from 0 to 150 cm. Blood pressure was measured with a digital automatic device (Omron HEM-907XL; IntelliSense Ltd); two readings of blood pressure were obtained, 1 min apart, and the average was used in the analysis.
Dietary assessment
Diet was assessed with an FFQ designed for the Comcáac community that included information on the consumption of eighty-eight food items over the last 12 months. The intakes of total energy, macronutrients and fibre were estimated with a food composition database( Reference Ortega, Morales and Quizán 15 ).
Dietary patterns were derived in two phases. In the first phase, the food items were classified into twelve food groups based on their composition and nutritional characteristics( Reference Appel, Moore and Obarzanek 16 ) (see online supplementary material, Supplemental Table 1) and the intake of each food group was calculated (g/d). The food items included in this phase were those that showed an association with prediabetes (P≤0·2 and biological plausibility) in a simple logistic regression analysis. In second phase, the dietary patterns were identified by a principal component analysis. An orthogonal rotation was performed and dietary patterns with an eigenvalue ≥1·5 and good interpretability were retained. Food groups with a factor loading ≥|0·3| were considered significant contributors to the pattern, and each dietary pattern was named according to the food groups it contained.
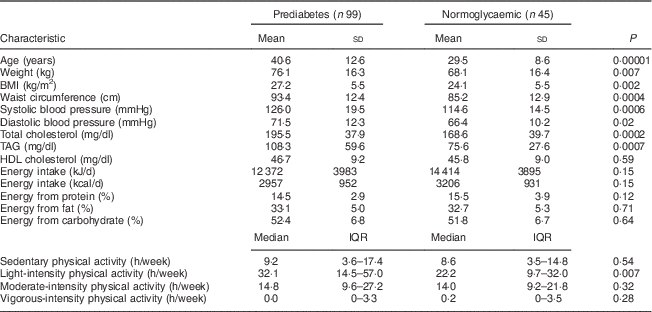
Table 1 Comparison of anthropometric, biochemical, dietary and physical activity characteristics between prediabetic and normoglycaemic groups of adults aged ≥20 years, Comcáac Indian communities of Punta Chueca and El Desemboque, Sonora, Mexico, May 2014–February 2015

IQR, interquartile range.
P values are for the comparison between prediabetic and normoglycaemic groups and were calculated with the independent t test or Mann–Whitney U test.
Physical activity assessment
Physical activity was assessed with a physical activity questionnaire that was validated for use in the Comcáac community( Reference Lavandera-Torres and Esparza-Romero 17 ). This questionnaire collected information about the frequency of and time dedicated to occupational and leisure physical activities over the last 12 months. Activities were classified according to their intensity using the 2011 Compendium of Physical Activities( Reference Ainsworth, Haskell and Herrmann 18 ). We calculated the number of hours per week dedicated to performing each group of activities.
Statistical analysis
Differences in physical, biochemical, dietary and physical activity characteristics between the prediabetic and normoglyacemic groups were tested by the independent t test or Mann–Whitney U test, as appropriate. The age-adjusted and both age- and sex-adjusted prevalence of prediabetes and 95 % CI were calculated by the direct method using the analysed population as the standard population.
Modifiable factors associated with prediabetes were assessed using multiple logistic regression. Multivariate models were constructed through an exploratory analysis, univariate analysis (P≤0·2 and biological plausibility) and stepwise selection (P≤0·05). The preliminary model was evaluated for possible interactions (P≤0·1), collinearity (r>0·8) and logistic regression assumptions. All analyses were performed using the statistical software package Stata version 14.1.
Results
A total of 227 individuals completed the protocol and, after applying the exclusion criteria (pregnant women, type 2 diabetes and age >65 years), 144 participants remained for the analysis of determinants (forty-five men and ninety-nine women). Results of the 2010 Mexican Census indicated a Seri population of 478 people aged ≥18 years and 388 aged ≥25 years( 8 ). Based on this information, the general study participation rate for people aged ≥20 years was approximately 53 %.
Age, weight, BMI, waist circumference, systolic and diastolic blood pressure, total cholesterol, TAG and light-intensity physical activity were higher in the prediabetic group than in the normoglycaemic group (Table 1).
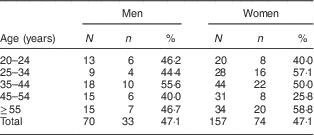
The crude and age-specific prediabetes prevalence rates are presented in Table 2. The sex- and age-adjusted prevalence of prediabetes was 47·1 (95 % CI 40·8, 53·5) % in the overall population; the age-adjusted prevalence was 47·3 (95 % CI 35·6, 59·0) % in men and 46·7 % (95 % CI 39·1, 54·3) % in women (P=0·999).
Table 2 Crude and age-specific prevalence of prediabetes among adults aged ≥20 years, Comcáac Indian communities of Punta Chueca and El Desemboque, Sonora, Mexico, May 2014–February 2015

N, number of people examined; n, number of people with prediabetes; %, prediabetes prevalence rate.
Three major dietary patterns were determined (see online supplementary material, Supplemental Table 2). The ‘Western’ dietary pattern was characterized by meat, chicken, desserts and processed meats food groups. The ‘traditional’ dietary pattern was characterized by the fish and seafood, low-fat cereals, fruits and vegetables food groups. The ‘hyper-caloric’ dietary pattern was characterized by the beverages, legumes and tortillas food groups. The three dietary patterns explained 42·6 % of the variability in diet of the Comcáac community (15·7, 13·5 and 13·4 %, respectively).
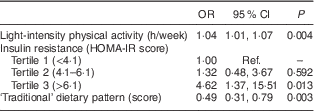
The multiple logistic regression analysis in Table 3 showed that light-intensity physical activity (per 1 h/week increase: OR=1·04; 95 % CI 1·01, 1·07) and insulin resistance (HOMA-IR score >6·1 v. <4·1: OR=4·62; 95 % CI 1·37, 15·51) were risk factors for prediabetes, while a higher score for the ‘traditional’ dietary pattern (OR=0·49; 95 % CI 0·31, 0·79) had a protective effect. All variables were modelled together and adjusted for age and sex.
Table 3 Adjusted main factors associated with prediabetes among adults aged ≥20 years, Comcáac Indian communities of Punta Chueca and El Desemboque, Sonora, Mexico, May 2014–February 2015

HOMA-IR, homeostasis model assessment of insulin resistance; ref., reference category.
All variables were modelled together and adjusted for age and sex.
Discussion
The present study is the first to evaluate the prevalence of prediabetes, and associated modifiable factors, in an ethnic group from Mexico using fasting plasma glucose, 2 h plasma glucose and HbA1c in the definition. For comparison purposes, we calculated the prevalence of prediabetes in the Comcáac community excluding HbA1c from the prediabetes definition, due to the lack of studies in Mexico that evaluated the prevalence of prediabetes using this metric. The prevalence of prediabetes in the Comcáac community decreased from 47·1 % to 34·4 % with the exclusion of HbA1c from the definition and is lower than that reported in the Mexican (43·2 %)( Reference Guerrero-Romero, Rodríguez-Morán and Pérez-Fuentes 19 ) and Pima Indian (37·7 %)( Reference Esparza-Romero, Valencia and Urquidez-Romero 13 ) populations.
The modifiable factors associated with prediabetes were light-intensity physical activity, insulin resistance and a ‘traditional’ dietary pattern intake. Light-intensity physical activity increased the risk of prediabetes in our population. This could be due to the fact that most of the light physical activities reported in the community required the person to remain seated (i.e. attending church, driving, boat motorist, craft-making activities). Moreover, activities with the strongest association with prediabetes were those involved in craft making (assembling bracelets and necklaces, perforating seashells, boiling craft materials, weaving limberbush baskets). Previous studies have found that physical inactivity increases prediabetes prevalence and that the potential mechanisms could be increased insulin resistance and TAG and a reduction in HDL cholesterol( Reference Anjana, Shanthi Rani and Deepa 3 , Reference Prasad, Kabir and Dash 20 – Reference Biolo, Ciocchi and Stulle 22 ).
Insulin resistance is a well-established risk factor for prediabetes( Reference Onishi, Hayashi and Sato 23 , Reference Hayashi, Boyko and Leonetti 24 ) and was associated with prediabetes in our study population. Insulin resistance promotes a state of compensatory hyperinsulinaemia needed to maintain glucose homeostasis; however, in chronic conditions, it leads to an exhaustion of β-cell function that is reflected as a loss of the pancreas’ ability to maintain glucose levels in a normal range( Reference Bergman 25 , Reference Reaven 26 ).
Finally, a higher score for the ‘traditional’ dietary pattern was associated with a lower probability of prediabetes in this population. Similarly, the consumption of food groups included in this dietary pattern has been associated with a reduction in prediabetes prevalence in other populations( Reference Prasad, Kabir and Dash 20 , Reference Viscogliosi, Cipriani and Liguori 27 ). The results of one sub-analysis indicated that people with a higher consumption of the ‘traditional’ dietary pattern have significantly larger intakes of fibre, MUFA, PUFA, vitamin C, vitamin E and β-carotene than people with a lower consumption of the ‘traditional’ dietary pattern (data not shown). These bioactive compounds have been associated with reductions in oxidative stress, chronic inflammation, endothelial dysfunction and insulin resistance( Reference Koloverou, Esposito and Giugliano 28 – Reference Salas-Salvadó, Guasch-Ferré and Lee 30 ). Additionally, a high-fibre diet has shown favourable effects on insulin sensitivity because it enhances insulin receptor sensitivity( Reference Pereira, Jacobs and Pins 31 ). The ‘Western’ and ‘hyper-caloric’ dietary patterns did not show an association with prediabetes (unadjusted OR=1·14; 95 % CI 0·87, 1·51 and unadjusted OR=1·10; 95 % CI 0·80, 1·50, respectively).
A limitation of the present study was the lower participation of men; however, the age distribution of male participants was homogeneously distributed (Table 2). The low participation of men could be due to the role of men in fishery activities, in which they do not have a fixed work schedule and their journeys can be long, so that they may have been away when the data for the study were collected. Another study limitation was that the sample size did not allow us to determine the factors associated with isolated impaired fasting glucose, impaired glucose tolerance and HbA1c.
Conclusion
The high prediabetes prevalence found in the Comcáac community is alarming because it represents a large number of people at risk for type 2 diabetes and CVD. The identification of modifiable factors associated with prediabetes could be useful for designing more effective strategies to prevent prediabetes in this ethnic group of Mexico.
Acknowledgements
Acknowledgements: The authors would like to thank the residents of the Comcáac community for participating in this study; Burrola Herrera, Anna Peñuñuri Ochoa, Janeth Maldonado Chan, José Manuel Moreno Abril, José de Jesús López Gutiérrez, Itzel Reyes Duarte, Adriana Isabel Cañez Zuñiga, Alejandra Chavez Ríos, Bagdi Shain Zuñiga Martínez and Alejandro Arturo Castro Juárez for their help with data collection and the biochemical analyses; Reyes Salomón Romero and Maria Luisa Astorga for helping with participant recruitment and facilitating the work with the community; and the Ministry of Health of Mexico for providing the clinics for the study. Financial support: The study was funded by The Christensen Fund, Project Number 2013–7437338. The Christensen Fund had no role in the design, analysis or writing of this article. Conflict of interest: The authors have no relevant conflicts of interest to disclose. Authorship: M.D.R.-O. wrote the manuscript, researched the data and contributed to the discussion. J.E.-R. designed the study, researched the data, contributed to the discussion and reviewed/edited the manuscript. A.C.G.-A. researched the data, contributed to the discussion and reviewed/edited the manuscript. M.G.L.-T. researched the data, contributed to the discussion and reviewed/edited the manuscript. R.G.D.-Z. researched the data, contributed to the discussion and reviewed/edited the manuscript. R.U.-R. researched the data, contributed to the discussion and reviewed/edited the manuscript. J.E.-R. is the guarantor of this work and, as such, had full access to all of the data in the study and takes responsibility for the integrity of the data and the accuracy of the data analysis. Ethics of human subject participation: This study was approved by the ethics committee of the Centro de Investigacion en Alimentacion y Desarrollo (number CE/005/2013). Participants gave written informed consent before participation.
Supplementary material
To view supplementary material for this article, please visit https://doi.org/10.1017/S1368980017002658


