A high prevalence of malnutrition, as characterized by underweight (UW) and overweight (OW), has been reported among the geriatric population in India( Reference Mathew, Das and Sampath 1 – Reference Saxena, Kandpal and Goel 13 ). The geriatric population has an increased risk of malnutrition due to physiological changes such as reduced metabolic rate, loss of appetite, difficulties in chewing and various co-morbidities( Reference Landi, Calvani and Tosato 14 – Reference Pilgrim, Robinson and Sayer 16 ). UW among the elderly can cause impaired muscle function and immune dysfunction that increases the risk of infection and mortality( Reference Hickson 17 , Reference Soenen and Chapman 18 ). OW among the elderly, on the other hand, may contribute to the onset of chronic non-communicable diseases such as diabetes, hypertension and CHD, functional decline and disability, and increased mortality( Reference Mathew, Das and Sampath 1 , Reference Lahiri, Biswas and Santra 2 , Reference Amarya, Singh and Sabharwal 19 – Reference Janssen, Heymsfield and Allison 22 ).
Earlier studies conducted in India suggest that identification of the risk factors associated with malnutrition in the geriatric population plays an important role in prevention of morbidity and mortality among them( Reference Mathew, Das and Sampath 1 – Reference Saxena, Kandpal and Goel 13 ). The majority of these studies have been conducted in plains regions of the country.
Lifestyle factors such as diet and physical activity are different in plains as compared with high-altitude regions of the country. We do not have scientific evidence on the risk factors associated with UW and OW among the geriatric population living in high-altitude regions of India; hence the present study was conducted to fill the gap in the existing knowledge.
Methodology
A community-based cross-sectional study was conducted during 2015–2016 in Nainital District, Uttarakhand State, North India. A total of 981 (35·6 % males and 64·4 % females) geriatric subjects were enrolled for the study. The mean age of males was 69·5 (sd 7·4) years and of females, 67·8 (sd 7·2) years. These subjects were selected from thirty clusters (villages) identified by using population proportional to size sampling methodology, as follows: (i) all villages in Nainital District were enlisted using the information obtained from the district census office; (ii) the corresponding total number of households was obtained for each village for calculation of the cumulative population; (iii) the sampling interval was calculated using the following: sampling interval=total cumulative population/number of clusters to be studied (i.e. 30; in Nainital District, total population=955128, sampling interval=955128/30=31838); (iv) a random number of 5762 was selected between 00001 and 31838 (four digits); (v) the first village (cluster 1) in which the population was nearly equal to the random number was identified. The cluster with corresponding cumulative population of 5762 was thus selected as cluster 1; (vi) for cluster 2, 5762+sampling interval=5762+31838=37600. The cluster with corresponding cumulative population of 37600 was selected as cluster 2; (vii) for cluster 3, the cluster with corresponding cumulative population of 69 438 (37 600+31 838) was selected as cluster 3; and (viii) steps (v) and (vi) were repeated to identify the subsequent clusters.
From the selected village, one lane was selected randomly. From the selected lane, one household was selected randomly. The survey was initiated from the selected first household and contiguously covered all the required number of subjects from the cluster. If the requisite number of subjects could not be covered, then the adjacent village was covered for the remaining sample of subjects. Thirty geriatric subjects in the age group of 60 years or above were selected from each cluster by house-to-house visit. The geriatric subjects were identified with the help of village-level health and nutrition functionaries such as anganwadi workers, auxiliary nurse midwives and accredited social health activists.
The following exclusion criteria were adopted: (i) subjects who were unable to comprehend the questions objectively; and (ii) subjects who had auditory problems leading to non-response. We excluded six subjects who had difficulty in comprehension of the questions and ten subjects who had auditory problems leading to non-response. Sixteen subjects with similar sociodemographic profile, educational qualification and economic status were included in the study. An informed written consent was obtained from each subject after explanation of the objectives and data collection parameters for the study. The study was approved by the ethical committee of the All India Institute of Medical Sciences, New Delhi.
Data collection
Sociodemographic profile
A pre-tested structured questionnaire was administered to obtain identification data and sociodemographic profile such as gender, age, educational qualification, present occupation, family monthly income and financial dependency. The socio-economic status was calculated using the Kuppuswamy classification( Reference Kumar, Dudala and Rao 23 ).
Anthropometric parameters
Height and weight of the geriatric subjects were measured using standard procedures. BMI was calculated using the formula: BMI (kg/m2)=[weight (kg)]/[height (m)]2. BMI was classified as underweight (UW; <18·5 kg/m2), normal (18·5–24·9 kg/m2), overweight and pre-obese (OW; 25·0–29·9 kg/m2) and obese (OB; ≥30·0 kg/m2) as per the WHO classification( Reference Nishida 24 ).
Waist circumference (in centimetres) was assessed to identify abdominal obesity. It was measured at the smallest horizontal girth between the costal margins and the iliac crest at the end of expiration, using a SECA-212 tape, to the nearest 0·1 cm. In accordance with the WHO, waist circumference of >90 cm (35 inches) in men and >80 cm (32 inches) in women was classified as abdominal obesity( 25 ).
Dietary assessment
The dietary intake of nutrients was assessed among one-quarter of the geriatric subjects (n 248) using the one-day 24 h dietary recall method. The following steps were undertaken: (i) information regarding the meal pattern and the food items (cooked and uncooked) consumed by the subject was recorded; (ii) for each cooked food item consumed, the raw ingredients used for the preparation were recorded; (iii) equivalent quantities of raw ingredients used for preparation of each food item were weighed using a SECA kitchen scale and recorded; (iv) total volume of each cooked food item was recorded using standard cups; (v) the quantity of each food item consumed by the index subject was assessed using standard cups/spoons/chapatti models. The cups were used to aid the respondent recall the quantities consumed by the index subject; (vi) from steps (iv) and (v), the amount of raw ingredients in grams for each food item consumed by the index subject was calculated; and (vii) nutritive value of the raw foods consumed was determined using food composition tables from the Nutritive Value of Indian Foods ( 26 ). The person responsible for cooking the food was interviewed for assessing the dietary intake of the index subject. The dietary intake of macronutrients (energy, protein, fat, carbohydrate), micronutrients (Zn, Fe, Ca, Mg, K, thiamin, riboflavin, niacin, vitamin C, folic acid) and trace elements (Cu, Mn, Mo, Cr) by the geriatric subjects was compared with the RDA for Indians given by the Indian Council of Medical Research( 27 ).
Sample size
Assuming the prevalence of malnutrition to be 50 %( Reference Mathew, Das and Sampath 1 ), the desired sample size (N) was calculated with the formula:
where z crit is the standard normal variate corresponding to 5 % level, relative precision (p) of 5 %, design effect (d) of 2 and non-response rate of 15 %. The total sample size derived was 883 and was rounded to 900. However, we included 981 geriatric subjects in the study.
Statistical analysis
The statistical software package IBM SPSS Statistics for Windows version 20.0 was utilized for conducting the statistical analysis of the data. The χ 2 test was applied with 95 % CI to assess the association of various parameters with UW and OW among the geriatric population. To identify possible risk factors associated with UW and OW/OB, univariate linear regression analysis was performed with each factor. Multivariate logistic regression analysis was conducted on the factors that were found to be associated with UW and OW/OB to identify the independent determinants of UW and OW/OB among the geriatric population. Adjusted OR with 95 % CI were calculated. A P value less than 0·05 was considered as statistically significant.
Results
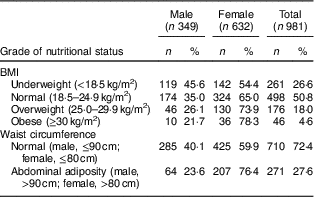
According to BMI, we found that 26·6 % of the geriatric subjects were UW. The prevalence of OW and OB was 18·0 % and 4·6 % among the geriatric subjects, respectively (Table 1). Abdominal obesity as per waist circumference was prevalent in 27·6 % of geriatric subjects.
Table 1 BMI and waist circumference, by gender, of community-dwelling geriatric subjects aged 60 years or above (n 981) living in a high-altitude region of rural Uttarakhand, India, 2015–2016

Risk factors for underweight
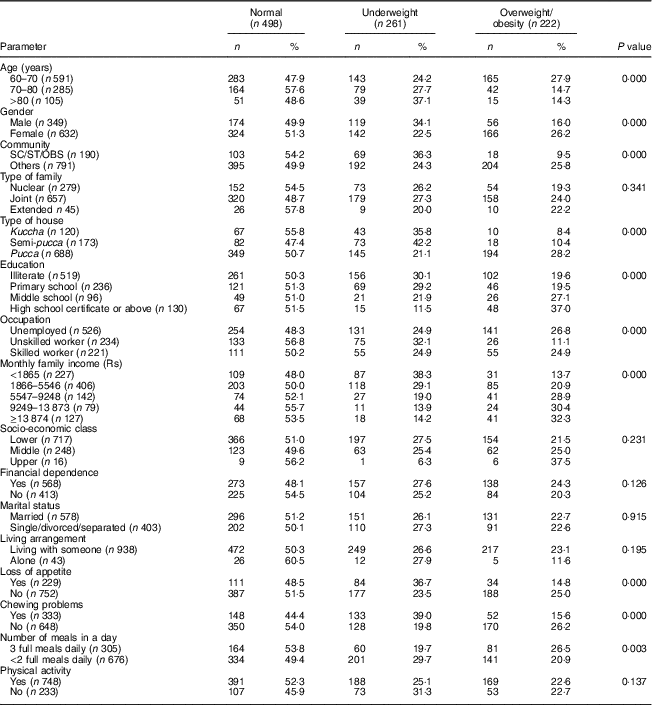
High prevalence of UW was found among subjects belonging to the highest age group of >80 years (37·1 %), males (34·1 %), illiterates (30·1 %), unskilled workers (32·1 %), those with lowest monthly family income (i.e. <Rs 1865; 38·3 %), those with chewing problems (39·0 %; all P<0·001) and those who consumed <2 full meals daily (29·7 %; P=0·003; Table 2).
Table 2 Sociodemographic characteristics, by nutritional status, of community-dwelling geriatric subjects aged 60 years or above (n 981) living in a high-altitude region of rural Uttarakhand, India, 2015–2016

SC/ST/OBS, Scheduled Castes/Scheduled Tribes/Other Backward Castes.
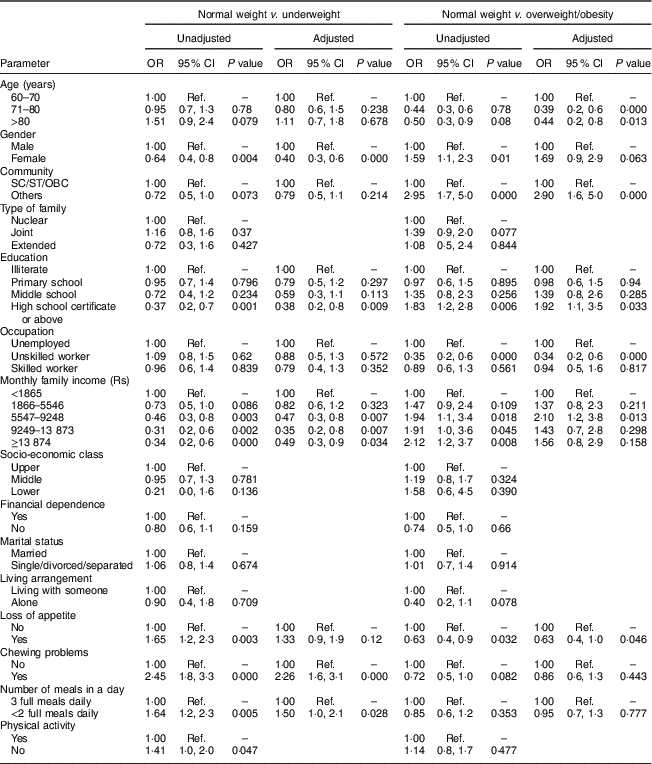
The multivariate logistic regression analysis identified male gender, level of education and income, chewing problems and lower number of daily meals as the risk factors for UW (Table 3).
Table 3 Univariate and multivariate logistic regression analysis of various risk factors of underweight and overweight/obesity v. normal weight among community-dwelling geriatric subjects aged 60 years or above (n 981) living in a high-altitude region of rural Uttarakhand, India, 2015–2016

SC/ST/OBS, Scheduled Castes/Scheduled Tribes/Other Backward Castes; Ref., reference category.
The risk for becoming UW was lower among females v. males (adjusted OR (AOR)=0·4; 95 % CI 0·3, 0·6; P≤0·001), those with high school education or above v. illiterates (AOR=0·4; 95 % CI 0·2, 0·8; P=0·009) and with increasing monthly family income v. lowest income (AOR=0·5, P=0·007 for Rs 5547–9248; AOR=0·3, P=0·007 for Rs 9249–13 873; AOR=0·5, P=0·034 for ≥Rs 13 874).
The odds of becoming UW were 2·3 (95 % CI 1·6, 3·1; P≤0·001) times higher in subjects with chewing problems (v. those without) and 1·5 (95 % CI 1·0, 2·1; P=0·028) times higher in subjects consuming <2 full meals daily (v. those consuming 3 full meals daily).
Risk factors for overweight
High prevalence of OW/OB was observed among subjects in the age group of 60–70 years (27·9 %), in the general community category (25·8 %), those with high school education or above (37·0 %), the unemployed (26·8 %) and those with monthly family income ≥Rs 13 874 (32·3 %; all P<0·001; Table 2).
After controlling for potential confounders, the risk factors associated with OW were found to be lower age, high level of education, higher income and unskilled work (Table 3). We found that the odds of becoming OW were lower with increasing age v. 60–70 years (AOR=0·4, P≤0·001 for 70–80 years; AOR=0·3, P=0·013 for >80 years), unskilled work v. unemployed (AOR=0·3; 95 % CI 0·2, 0·6, P≤0·001) and those with loss of appetite v. without appetite loss (AOR=0·6; 95 % CI 0·4, 1·0, P=0·046).
The risk for becoming OW was found to be 2·9 (95 % CI 1·6, 5·0; P≤0·001) times higher in the general community category (v. Scheduled Castes/Scheduled Tribes/Other Backward Castes), 1·9 (95 % CI 1·1, 3·5; P=0·033) times higher in subjects with high school education or above (v. illiterates) and 2·1 (95 % CI 1·2, 3·8; P=0·013) times higher in those with monthly family income of Rs 5547–9248 (v. <Rs 1865).
Dietary assessment
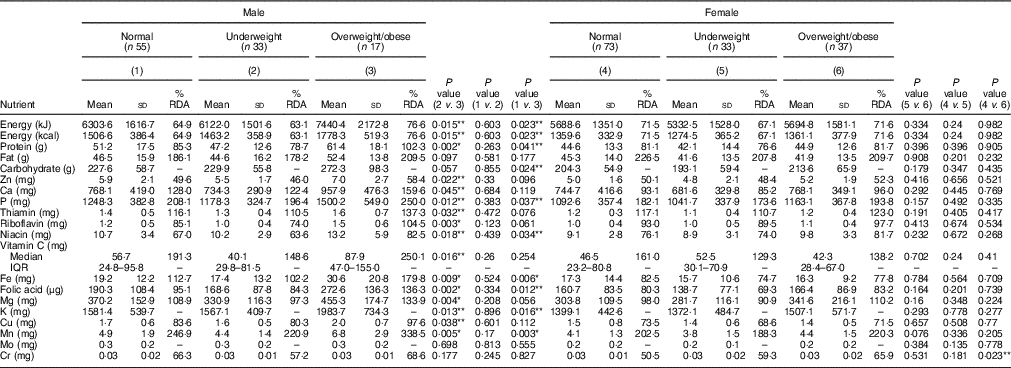
Table 4 presents the mean dietary intake of nutrients by geriatric subjects stratified by BMI. The mean dietary intake of all nutrients was found to be lower among UW and higher among OW/OB geriatric subjects than among those with normal BMI. We found that geriatric subjects did not meet the RDA for energy, protein, Zn, Ca (in females), Fe (in females), folic acid, niacin, riboflavin and Cu across all BMI categories.
Table 4 Mean dietary intake of nutrients, by gender and nutritional status, of community-dwelling geriatric subjects aged 60 years or above (n 248) living in a high-altitude region of rural Uttarakhand, India, 2015–2016

IQR, interquartile range.
*P value significant at 0·01, **P value significant at 0·05.
We found that male UW subjects had a significantly lower intakes of energy, Zn, Ca, P, thiamin, niacin, vitamin C, K, Cu (all P<0·05), protein, riboflavin, folic acid, Mg and Mn (all P<0·01) compared with OW/OB geriatric subjects (Table 4).
Intakes of energy, protein, carbohydrate, P, niacin, K (all P<0·05), Fe and Mn (all P<0·01) were found to be significantly higher among male OW/OB subjects than among subjects with normal BMI (Table 4).
Discussion
The present study reported a high prevalence of both UW and OW (as assessed by BMI), indicating a double burden of malnutrition, among geriatric subjects living in a high-altitude area of Uttarakhand, India. An earlier study conducted in a similar region of Uttarakhand also documented high UW and OW/OB prevalence among geriatric subjects: 35·5 and 15·9 %, respectively( Reference Saxena, Kandpal and Goel 13 ). Studies conducted in plains regions of India have similarly shown a high prevalence of UW (range of 21–55 %)( Reference Mathew, Das and Sampath 1 – Reference Kalaiselvi, Arjumand and Jayalakshmy 7 ) and a higher prevalence of OW/OB (range of 26–46 %)( Reference Goswami, Nongkynrih and Kalaivani 8 – Reference Ratnaprabha, Farah and Twinkle 12 ). We observed a lower prevalence of OW/OB, possibly because of higher physical activity and active lifestyle of our geriatric subjects due to the inadequate transportation facilities and difficult terrains of hilly regions of Uttarakhand. However, abdominal obesity as indicated by waist circumference was found to be high (27·6 %), suggesting increased risk of myocardial infarction, stroke, metabolic syndrome and premature death among the geriatric subjects( 25 ).
We found that the male geriatric subjects (P<0·001) had a significantly higher risk of developing UW. Earlier studies conducted in Puducherry and Haryana showed that males had 2·5 times and 0·3 times higher risk of becoming UW than females, respectively( Reference Jamir, Kalaivani and Nongkynrih 4 , Reference Ratnaprabha, Farah and Twinkle 12 ). Menopause-related weight gain, accumulation of visceral fat and adiposity in females may have accounted for lower risk of UW but higher risk of OW/OB as compared with male geriatric subjects( Reference Campos, Pedroso and Lamounier 28 ).
Studies have suggested that physiological changes related to ageing lead to decrease in both fat mass and fat-free mass after 70 years of age and decrease in height( Reference Baumgartner, Stauber and McHugh 29 , Reference Gallagher, Visser and De Meersman 30 ). This may have possibly resulted in higher prevalence of UW with increasing age (P<0·01) of the subjects.
In the present study, we found low educational status to be a significant risk factor for UW among the geriatric population (Tables 2 and 3). An earlier study conducted in Birmingham, Alabama, USA also reported lower educational status as the strongest predictor for UW( Reference Ritchie, Burgio and Locher 31 ). Conversely, a recent study conducted by Ratnaprabha et al. in Bangalore, India documented that literate subjects had 5·3 times higher risk of becoming OW/OB possibly due to better social conditions and better access to food( Reference Ratnaprabha, Farah and Twinkle 12 ). Several studies conducted in Brazil, Iran and Spain have reported increasing income as an important risk factor for OW/OB among geriatric subjects, as observed in the present study( Reference Andrade, Caldas and Kitoko 32 – Reference Fisac, Lopez and Banegas 35 ), whereas geriatric subjects having less than Rs 1000/month per capita income has been associated with 2·5 times higher chances of becoming UW in an earlier study conducted by Kalaiselvi et al. in Puducherry( Reference Kalaiselvi, Arjumand and Jayalakshmy 7 ). This suggests that educational status and economic status may have an important effect on the weight status of geriatric subjects.
In the present study, other factors such as chewing difficulties (P<0·001) and lower number of daily meals (P=0·028) consumed by geriatric subjects were identified to significantly increase their chances of developing UW. A recent systematic review documented chewing problems and loss of appetite as significant risk factors for protein–energy malnutrition and UW among geriatric subjects( Reference van der Pols-Vijlbrief, Wijnhoven and Schaap 36 ). Previous studies conducted in West Bengal( Reference Lahiri, Biswas and Santra 2 ) and Tamil Nadu( Reference Vedantam, Subramanian and Rao 3 ) also reported that subjects who had decline in food intake had 2·3 and 0·4 times higher risk of developing undernutrition, respectively.
BMI has been utilized as an indicator of chronic energy deficiency and malnutrition among geriatric subjects as it reflects the percentage of body fat and fat-free mass( Reference Shetty and James 37 ). In the present study, we observed that geriatric subjects with low BMI had lower dietary intakes of nutrients than those with normal BMI. Earlier studies conducted in other countries have also reported similar associations( Reference Wahlqvist, Hsu-Hage and Kouris-Blazos 38 – Reference Yim and Lee 40 ). Further weight loss due to inadequate dietary intake among these UW geriatric subjects may increase their risk of developing disability, compromised immune function, increased susceptibility to acute illnesses and reduce survival rate( Reference Defay, Delcourt and Ranvier 41 – Reference Elmadfa and Meyer 43 ).
Conversely, the percentage adequacy and nutrient intakes were documented to be significantly higher among OW/OB than UW and normal-weight geriatric subjects, possibly due to overall higher quantity of food consumed by the former. The diets of the geriatric subjects were found to be high in fat density (double the RDA) and low on nutrient density. Hence, they may be at an increased risk of developing CVD and other chronic non-communicable diseases.
The strengths of the present study are as follows: (i) it is possibly the first study which has investigated the possible risk factors associated with OW/OB and UW among geriatric subjects residing in a high-altitude region of India; and (ii) it is a community-based study in which data were collected through house-to-house visit to ensure appropriate sampling. The limitation of the study is that we had to exclude subjects who were unable to comprehend the questions objectively and who had auditory problems leading to non-response.
Conclusion
In conclusion, the present study documented high prevalence of UW, OW and OB among geriatric subjects residing in a hilly region of Uttarakhand, India. Thus, there is a need to develop targeted, multifactorial interventions that aim to prevent the development of UW, as well as OW/OB, among this geriatric population. This will aid in maintenance of nutritional status among this geriatric population and delay the onset of health-related problems.
Acknowledgements
Funding support: The authors thank the Indian Council of Medical Research for providing financial support for undertaking the present study. The Indian Council of Medical Research had no role in the design, analysis or writing of this article. Conflict of interest: The authors declare no conflict of interest. Authorship: A.G. contributed to literature review, content development and manuscript development. U.K. contributed to literature review, content development, manuscript development and acts as guarantor for the paper. R.K. contributed to literature review, content development and manuscript development. P.K. contributed to literature review, content development and manuscript development. N.S. contributed to the literature review, content development and manuscript development. R.M.P. contributed to data analysis and interpretation. A.D.U. contributed to data analysis and interpretation. Ethics of human subject participation: This study was conducted according to the guidelines laid down in the Declaration of Helsinki and all procedures involving human subjects/patients were approved by the ethics committee of the All India Institute of Medical Sciences.


