Poor diet is linked to a plethora of adverse health outcomes in childhood( Reference Malik, Pan and Willett 1 – Reference Peltzer, Mongkolchati and Satchaiyan 3 ). If easily measured parental health behaviours strongly predict children’s subsequent dietary trajectories, this may lead to the development of risk prediction tools in infancy, enabling greater precision in targeting preventive intervention to families most in need.
Parental health behaviours (alcohol consumption, smoking, diet and physical activity) cluster together( Reference Schneider, Huy and Schuessler 4 , Reference Conry, Morgan and Curry 5 ) and are potentially modifiable. Higher maternal alcohol consumption during pregnancy is associated with a slightly lower likelihood of 14-month-old infants following a ‘health conscious’ dietary pattern( Reference Kiefte-de Jong, de Vries and Bleeker 6 ). Maternal smoking during pregnancy or early infancy and paternal smoking during the prenatal period are predominantly associated with infants or children up to age 7 years following unhealthier diets and/or being less likely to adhere to healthier diets( Reference Kiefte-de Jong, de Vries and Bleeker 6 – Reference Wall, Thompson and Robinson 11 ). Maternal diet before pregnancy is associated with early childhood diet in 6-month- to 3-year-old children( Reference Fisk, Crozier and Inskip 7 , Reference Okubo, Miyake and Sasaki 12 , Reference Robinson, Marriott and Poole 13 ). For example, maternal pre-pregnancy ‘prudent’ diet (comprising high consumption of fruits, vegetables, water, wholemeal bread, fish and fruit juices, and low consumption of white bread, crisps, chips, roast potatoes, processed meat, confectionery, cakes and biscuits) is strongly associated with children following a ‘prudent’ diet at 3 years of age( Reference Fisk, Crozier and Inskip 7 ). By contrast, in cross-sectional research, maternal physical exercise is not associated with children’s intake of energy-dense foods or snacking at age 4 years( Reference Durão, Severo and Oliveira 14 ).
Unfortunately, these studies( Reference Kiefte-de Jong, de Vries and Bleeker 6 – Reference Durão, Severo and Oliveira 14 ) have limitations. Their early childhood focus precludes an understanding of how parental health behaviours early in childhood may predict diet during late childhood or adolescence. Most previous studies( Reference Fisk, Crozier and Inskip 7 – Reference Smithers, Brazionis and Golley 9 , Reference Wall, Thompson and Robinson 11 – Reference Durão, Severo and Oliveira 14 ) have considered only one parent, when it is possible that diets of each parent could contribute uniquely to prediction of children’s diets. Other limitations include follow-up at a maximum of three points in time and/or measuring diet for a maximum of 5 years. It is likely that the effect of diet on health outcomes is cumulative over time( Reference Kuh and Ben-Shlomo 15 , Reference Northstone, Smith and Newby 16 ), so it is important to take dietary measurements at several time points including in late childhood and/or adolescence. The Longitudinal Study of Australian Children (LSAC) overcomes these limitations. The aims of the present study were to determine which parental health behaviours early in childhood best predict children’s dietary (i) score and (ii) pattern trajectories from 2–3 to 10–11 years of age, and from 4–5 to 14–15 years of age, in parallel population-representative cohorts of Australian children. We considered parents’ fruit and vegetable consumption, smoking, alcohol consumption and physical activity. We hypothesised that, consistent with previous research( Reference Kiefte-de Jong, de Vries and Bleeker 6 – Reference Robinson, Marriott and Poole 13 ), higher parental alcohol consumption and smoking, and lower parental fruit and vegetable consumption, would be associated with children being more likely to follow unhealthy dietary trajectories, and less likely to follow healthy dietary trajectories. We also hypothesised that, consistent with previous research( Reference Durão, Severo and Oliveira 14 ), parental physical activity would not be associated with children’s dietary trajectories.
Methods
Recruitment and sampling
The present study used data from the LSAC, collected from 2004 to 2014( Reference Soloff, Lawrence and Johnstone 17 ). For the clustered sampling design( Reference Soloff, Lawrence and Johnstone 17 ), Australian postcodes were randomly chosen following stratification by state/territory, capital city v. rest of state and large v. small population size( Reference Soloff, Lawrence and Johnstone 17 ); approximately 10 % of in-age children were then randomly chosen from each of these postcodes( Reference Soloff, Lawrence and Johnstone 17 ). Sampling was from the Medicare enrolment database( Reference Soloff, Lawrence and Johnstone 17 ). Medicare is Australia’s universal government-funded health-care programme into which virtually all Australian children are enrolled by their first birthday. Except for some remote areas, LSAC is generally representative of the Australian population( Reference Soloff, Lawrence and Johnstone 17 ). The recruited sample comprised 5107 and 4983 children from the B and K cohorts, respectively, representing 57·2 and 50·4 % uptake( Reference Soloff, Lawrence and Johnstone 17 ).
The Australian Institute of Family Studies Ethics Committee approved each data collection wave and families provided written informed consent. The present study drew on all six of LSAC’s biennial waves from both its cohorts: the B Cohort (aged 0–1 years in 2004) and the K Cohort (aged 4–5 years at recruitment in 2004)( Reference Norton and Monahan 18 ). Supplemental Fig. 1 (see online supplementary material) shows numbers and retention across the LSAC waves, and the current analytic sample.
Procedures and measures
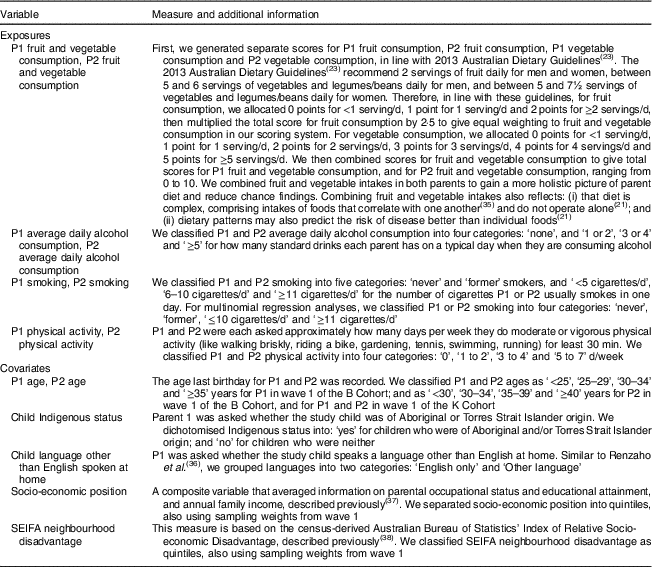
Data collection comprised face-to-face interviews in the home with the primary caregiver (parent 1), and questionnaires completed by parent 1, parent 2 and children aged 10 years or older( 19 ). Parent 1 is considered the parent who best knows the study child, almost always the biological mother( 20 ). Retention methods included small gifts, sent yearly, between wave mail-out and online questionnaires, birthday cards and newsletters to keep contact with study families( 20 ). Table 1 describes exposure variables and covariates measured at baseline.
Table 1 Measures for the parental behaviour exposures and covariates
P1, parent 1; P2, parent 2; SEIFA, Socio-Economic Indexes for Areas.
Dietary trajectory outcomes
Parents or children completed twelve to sixteen dietary questions biennially at five waves (from age 2–3 to 10–11 years) for the B Cohort and all six waves (from age 4–5 to 14–15 years) for the K Cohort (see online supplementary material, Supplemental Table 1). These questions enquired about the frequency at which the study child consumed various healthy and unhealthy food or drink items or groups of foods or drinks in the previous 24 h or yesterday. The B Cohort did not include dietary data from baseline (age 0–1 years) because a large proportion of the sample was being breast-fed or formula-fed.
There are various ways of summarising diet, including dietary patterns and scores( Reference Michels and Schulze 21 ). Dietary scores, often based on previous literature, sum the number or frequency of foods eaten that are considered to be beneficial or harmful to health( Reference Michels and Schulze 21 ). Alternatively, empirically derived dietary patterns provide insight into which foods are consumed together, and are not restricted by needing to align with dietary guidelines or disease( Reference Michels and Schulze 21 ). Supplemental Figs 2–4 (see online supplementary material) show the six outcome variables (three per cohort), which were previously published childhood trajectories of overall dietary scores, ‘healthy’ dietary patterns and ‘unhealthy’ dietary patterns for both the B and K cohorts, separately( Reference Gasser, Kerr and Mensah 22 ). Dietary data for the B Cohort were collected over 8 years at five waves and dietary data for the K Cohort were collected over 10 years at six waves. The methods of deriving these trajectories are described in detail in a prior publication( Reference Gasser, Kerr and Mensah 22 ) but briefly reiterated below.
We derived dietary scores (ranging from 0 to 14, with 14 being healthiest) for each child at each wave, based predominantly on the 2013 Australian Dietary Guidelines( 23 ). Scores summed the child’s frequency of seven categories of foods or drinks consumed during the last 24 h: water, vegetables, fruits and milk products or alternatives (all positively coded); and sweetened drinks, fatty foods and sugary foods (negatively coded).
Dietary patterns were derived using exploratory factor analyses with all twelve to sixteen food or drink items at each wave (listed in the online supplementary material, Supplemental Table 1)( 24 ). Each wave in each cohort yielded comparable ‘healthy’ and ‘unhealthy’ factors or patterns. The ‘healthy’ pattern was characterised by frequent consumption of cooked vegetables, raw vegetables or salad and fresh fruits in all waves, and water in most waves, each with high factor loadings of 0·3 or higher, reflecting these as foods or drinks that stand out most in the ‘healthy’ factor( Reference Costello and Osborne 25 ). In contrast, the ‘unhealthy’ pattern was characterised by frequent consumption of savoury snacks and sweetened drinks in all waves; hamburgers, sausages or sausage rolls, meat pies, hot dogs, hot chips and fruit juice in most waves (each with high factor loadings of 0·3 or higher); and a high negative factor loading (below −0·3) for water consumption in six out of eleven waves. We then used regression scoring to derive dietary pattern scores for the unhealthy and the healthy factors separately, for each child.
Trajectories of dietary scores, ‘healthy’ patterns and ‘unhealthy’ patterns were derived using group-based trajectory modelling with the ‘traj’ plug-in in the statistical software package Stata/IC version 14.1( Reference Jones and Nagin 26 ). This generated trajectories showing how overall dietary scores, the study child’s frequency of ‘healthy’ food consumption (spanning low to high) from each wave and the study child’s frequency of ‘unhealthy’ food consumption (again spanning low to high) from each wave changed with age. Each of the three outcome variables per cohort consisted of four trajectories. To be included in the relevant trajectories, children needed dietary data from at least two waves (see online supplementary material, Supplemental Fig. 1). The four categories for each of the overall dietary score and ‘healthy’ pattern trajectories were ‘always healthy’, ‘becoming less healthy’, ‘moderately healthy’ and ‘never healthy’. The four categories for the ‘unhealthy’ pattern dietary trajectories were ‘never unhealthy’, ‘becoming unhealthy’, ‘moderately unhealthy’ and ‘always unhealthy’.
Statistical analysis
All analyses used Stata/IC version 14.2 and employed survey methods, using cross-sectional sampling weights from wave 1 of each cohort. These methods account for the multistage and clustered sampling design, and non-response( 20 ). We described the baseline characteristics of the total sample using percentages for categorical variables, or means and standard deviations for continuous variables. To determine whether there was an under- or over-representation of particular subgroups in our analyses, we also described the baseline characteristics of participants included in and not included in all trajectories using percentages for categorical variables, or means and standard deviations for continuous variables. We estimated associations between parental health behaviours in wave 1 and subsequent child dietary trajectories using univariable and multivariable multinomial logistic regression analyses. The exposures considered in multivariable analyses were parent 1 and 2 fruit and vegetable consumption, average daily alcohol consumption, smoking and physical activity in the same model, along with the following covariates: family socio-economic position, neighbourhood disadvantage, study child Indigenous status, study child language other than English spoken at home, parent 1 age and parent 2 age. Due to missing parent 2 data for single-parent families, we conducted sensitivity analyses including data from only the primary caregiver in the multivariable models. We also conducted sensitivity analyses which additionally included child sex as a covariate. For exposure variables with at least three categories, we derived overall P values for the combination of all non-reference exposure categories (compared with the reference category), for each non-reference dietary trajectory, using the Wald test.
Results
Sample characteristics
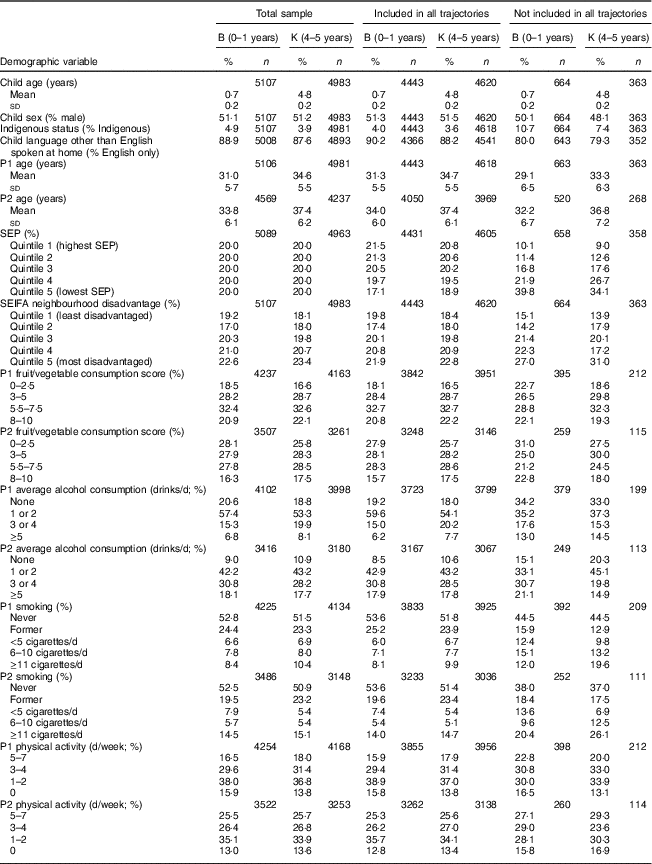
Supplemental Fig. 1 (see online supplementary material) shows the numbers of children participating at each wave of LSAC; 3537 (71·0 %) and 3764 (73·7 %) children from the B and K cohorts, respectively, remained in the study after the most recent wave of data collection (wave 6). Table 2 shows the baseline characteristics of the samples of children from the B and K cohorts for whom there were and were not outcome data (dietary trajectories), 4443 (87·0 %) and 4620 (92·7 %), respectively. Children with dietary trajectory data were similar in age to those without, and more likely to have parents who had never smoked. The proportion of boys was similar among children with and without dietary trajectory data. Of the children, 2719 to 2905 had data on all variables from both parents so were included in multivariable analyses. Sensitivity analyses included 3605 to 3668 children with full data from parent 1 only.
Table 2 Baseline characteristicsFootnote * of the sample, by cohort: Longitudinal Study of Australian Children (LSAC; 2004–2014)
B, wave 1 of the B Cohort; K, wave 1 of the K Cohort; P1, parent 1; P2, parent 2; SEP, socio-economic position; SEIFA, Socio-Economic Indexes for Areas.
* All estimates are weighted.
Associations between parental health behaviours and dietary score trajectory outcomes
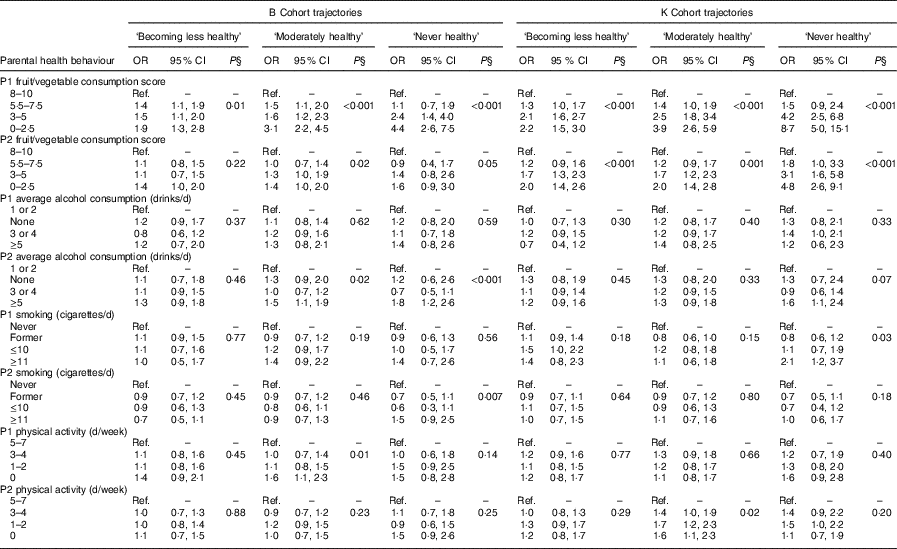
In univariable analyses, the lowest levels of parental fruit and vegetable consumption and parent 1 physical activity, and the highest levels of parental alcohol consumption and parental smoking, were generally associated with children being in all three less healthy dietary score trajectories rather than the healthiest in both cohorts (see online supplementary material, Supplemental Table 2). In multivariable analyses, which included all parental health behaviours and covariates in the same model, only the lowest level of parent 1 fruit and vegetable consumption remained strongly associated with children belonging to all three less healthy dietary score trajectories (Table 3). For example, in the K Cohort, lowest v. highest parent 1 fruit and vegetable consumption was associated with ninefold relative odds of children following the ‘never healthy’ trajectory from age 4–5 to 14–15 years (OR=8·7; 95 % CI 5·0, 15·1 in reference to ‘always healthy’; Table 3). This association was in the same direction but smaller (OR=4·4; 95 % CI 2·6, 7·5) in the B Cohort (ages 2–3 to 10–11 years; Table 3). The lowest parent 2 fruit and vegetable consumption also remained predictive of the ‘becoming less healthy’ and ‘moderately healthy’ trajectories in the B Cohort, and all three of the least healthy trajectories in the K Cohort, although less strongly than for parent 1. Sensitivity analyses, which excluded all parent 2 variables, yielded similar results (available from corresponding author on request). Sensitivity analyses that additionally included child sex yielded similar results (available from corresponding author on request).
Table 3 Multinomial multivariableFootnote * logistic regression analyses, showing associations between parental health behaviours and overall dietary score trajectories, for both cohorts (B Cohort, n 2905; K Cohort, n 2719): Longitudinal Study of Australian Children (LSAC; 2004–2014)Footnote †,Footnote ‡
P1, parent 1; P2, parent 2; Ref., reference category; SEIFA, Socio-Economic Indexes for Areas.
* The model included all parental health behaviours and P1 age, P2 age, study child Indigenous status, study child language other than English spoken at home, socio-economic position and SEIFA neighbourhood disadvantage as covariates.
† ‘Always healthy’ trajectory=reference category for both cohorts.
‡ All estimates are weighted.
§ P value from Wald test for variables with more than two categories.
Associations between parental health behaviours and ‘healthy’ pattern trajectory outcomes
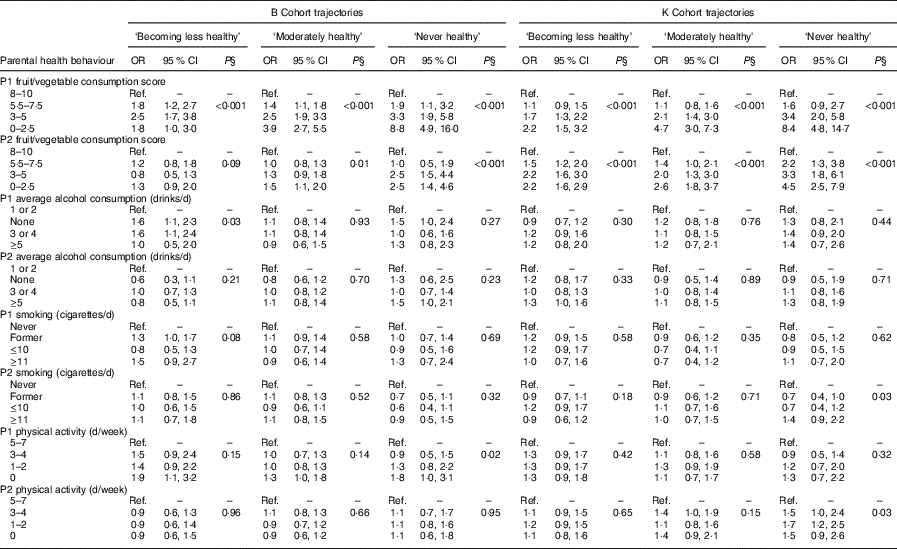
When we alternatively considered trajectories of children’s consumption of ‘healthy’ foods, we observed similar relationships to those for dietary scores in univariable analyses (see online supplementary material, Supplemental Table 3). In multivariable analyses, only the lowest parent 1 fruit and vegetable consumption remained strongly associated with children following the three trajectories with the least healthy patterns, in both cohorts (Table 4). Associations were comparable to or higher than those for the dietary score trajectory outcomes, with odds eight- to ninefold higher for children with the lowest relative to the highest level of parent 1 fruit and vegetable consumption, in both cohorts (Table 4). Additionally, the lowest parent 2 fruit and vegetable consumption also remained predictive of the ‘moderately healthy’ and ‘never healthy’ trajectories in the B Cohort, and all three of the least healthy trajectories in the K Cohort, although less strongly than for parent 1. Sensitivity analyses that additionally included child sex yielded similar results (available from corresponding author on request).
Table 4 Multinomial multivariableFootnote * logistic regression analyses, showing associations between parental health behaviours and ‘healthy’ pattern trajectories, for both cohorts (B Cohort, n 2903; K Cohort, n 2719): Longitudinal Study of Australian Children (LSAC; 2004–2014)Footnote †,Footnote ‡
P1, parent 1; P2, parent 2; Ref., reference category; SEIFA, Socio-Economic Indexes for Areas.
* The model included all parental health behaviours and P1 age, P2 age, study child Indigenous status, study child language other than English spoken at home, socio-economic position and SEIFA neighbourhood disadvantage as covariates.
† ‘Always healthy’ trajectory=reference category for both cohorts.
‡ All estimates are weighted.
§ P value from Wald test for variables with more than two categories.
Associations between parental health behaviours and ‘unhealthy’ pattern trajectory outcomes
Finally, when we examined trajectories showing how children’s frequency of ‘unhealthy’ food consumption changed with age, our findings reverse mirrored those for dietary score and ‘healthy’ pattern trajectories in univariable analyses (see online supplementary material, Supplemental Table 4). In multivariable analyses, the lowest level of parent 1 fruit and vegetable consumption remained strongly associated with children belonging to the ‘moderately unhealthy’ and ‘always unhealthy’ trajectories in the B Cohort, and all three of the unhealthiest pattern trajectories in the K Cohort (Table 5). However, associations were weaker than for dietary score and ‘healthy’ pattern trajectories. The lowest parent 2 fruit and vegetable consumption also remained predictive of the ‘moderately unhealthy’ trajectory in the K Cohort, although less strongly than for parent 1. In sensitivity analyses excluding parent 2, results remained similar. However, the highest level of parent 1 smoking was also strongly associated with children belonging to all three of the unhealthiest pattern trajectories in the B Cohort, and the ‘moderately unhealthy’ and ‘always unhealthy’ trajectories in the K Cohort (available from corresponding author on request). Sensitivity analyses that additionally included child sex yielded similar results (available from corresponding author on request).
Table 5 Multinomial multivariableFootnote * logistic regression analyses, showing associations between parental health behaviours and ‘unhealthy’ pattern trajectories, for both cohorts (B Cohort, n 2903; K Cohort, n 2719): Longitudinal Study of Australian Children (LSAC; 2004–2014)Footnote †,Footnote ‡
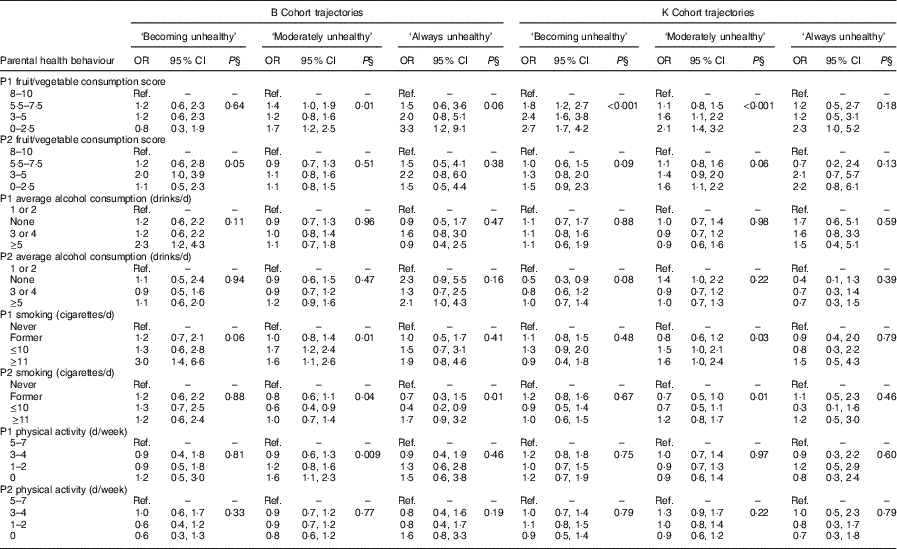
P1, parent 1; P2, parent 2; Ref., reference category; SEIFA, Socio-Economic Indexes for Areas.
* The model included all parental health behaviours and P1 age, P2 age, study child Indigenous status, study child language other than English spoken at home, socio-economic position and SEIFA neighbourhood disadvantage as covariates.
† ‘Never unhealthy’ trajectory=reference category for both cohorts.
‡ All estimates are weighted.
§ P value from Wald test for variables with more than two categories.
Discussion
Principal findings
Using prospective data from both parents, we found that fruit and vegetable consumption of the primary caregiver, usually the biological mother, during infancy or early childhood was a powerful predictor of diet across the entire childhood life course through to mid-adolescence. Specifically, children whose primary caregivers consumed the lowest levels of fruits and vegetables had up to nine times the odds of following a trajectory of low dietary scores and a trajectory characterised by the lowest frequency of healthy foods. The primary caregiver’s fruit and vegetable consumption was much less predictive of children’s consumption of unhealthy foods. Parental smoking, alcohol consumption and physical activity were not predictive of children’s diet. Our findings replicated strongly across both cohorts.
Strengths and weaknesses
A major and unusual strength of the present study was that diet was measured frequently and prospectively over a long period spanning infancy through to the mid-teen years. We considered the same health behaviours in both parents, allowing us to determine whether consideration of both parents adds greatly to prediction, as well as whether effect sizes differ between the primary caregiver and other parent. Our findings were replicated uniquely across two cohorts of children. This replication increased reliability and our confidence in these results( Reference Sanson, Nicholson and Ungerer 27 ), and allowed us to generalise across a wider span of childhood than would otherwise have been possible.
The main limitation was the brevity of the available measures, all of which were self- or parent-reported. Parents reported their consumption of fruits and vegetables but not of unhealthy foods; therefore, we could not obtain an overall picture of parental diet, which would be ideal because people tend to eat foods in dietary patterns. While the children’s dietary measure was both more detailed and strengthened by its repetition across five to six waves, the self- or parent-reported format is open to inaccurate reporting( Reference Garaulet, Martínez and Victoria 28 ) and/or recall( Reference Dwyer and Coleman 29 ) of diet. The items reported were none the less limited; for example, we did not consider children’s consumption of legumes or whole grains. If both children and parents reported healthier diets than they actually consumed, our large associations could in fact be underestimates of true associations in the population. For parent alcohol, we could not consider possible impacts of frequency of consumption or variation in day-to-day alcohol intake. A further potential limitation of our study is that some participants were under-represented in our analyses (e.g. those of low socio-economic position and with high levels of parental smoking). This under-representation of particular subgroups is likely to have resulted in an underestimation of the true associations in the population. Nevertheless, applying survey weights would have partially accounted for this limitation. Finally, another drawback is that because this research is observational, causality cannot be established.
Strengths and weaknesses in relation to other studies
Compared with previous research( Reference Fisk, Crozier and Inskip 7 – Reference Smithers, Brazionis and Golley 9 , Reference Wall, Thompson and Robinson 11 – Reference Durão, Severo and Oliveira 14 ), our study provides a broader view over a longer time horizon of how multiple health behaviours from both parents are associated with dietary trajectories throughout childhood and adolescence. Like previous studies, we show that maternal diet( Reference Fisk, Crozier and Inskip 7 , Reference Okubo, Miyake and Sasaki 12 , Reference Robinson, Marriott and Poole 13 ), but not physical exercise( Reference Durão, Severo and Oliveira 14 ), is associated with early childhood diet, and we confirm univariable associations of maternal smoking with unhealthier diets( Reference Wall, Thompson and Robinson 11 ) and of maternal non-smoking with healthier diets( Reference Fisk, Crozier and Inskip 7 , Reference Voortman, Kiefte-de Jong and Geelen 10 ). However, our multivariable findings differ from previous studies indicating that parental alcohol consumption and smoking predict child diet( Reference Kiefte-de Jong, de Vries and Bleeker 6 – Reference Wall, Thompson and Robinson 11 ). These discrepancies could reflect other studies making different choices of covariates, including a greater subset of food and drink items, being conducted in different geographic locations, measuring exposures at different time points, and/or being conducted over a shorter time period than our study( Reference Kiefte-de Jong, de Vries and Bleeker 6 – Reference Wall, Thompson and Robinson 11 ). It is also possible that the use of stepwise regression procedures( Reference Kiefte-de Jong, de Vries and Bleeker 6 , Reference Kyttälä, Erkkola and Lehtinen-Jacks 8 , Reference Voortman, Kiefte-de Jong and Geelen 10 ) may have increased type I error rates in some studies, leading to false conclusions of associations between parental health behaviours and child diet( Reference George, Beasley and Brown 30 ).
Meaning of the study for clinicians and policy makers
Our study highlights the importance of parental fruit and vegetable consumption on children’s diets. Health promotion efforts to educate and facilitate parents to invest in a healthy diet for themselves and their families have already been met with some success. For example, targeting weekly nutrition workshops to parents and 2–4-year-old children improved children’s diets( Reference Skouteris, Hill and McCabe 31 ), while a nutrition education programme, targeted to both parents and children separately, increased pre-school children’s consumption of milk and vegetables( Reference Williams, Cates and Blitstein 32 ). While none of these trials has reported long-term follow-up, our study underscores the potentially lasting value of such interventions by virtue of the very large associations between primary caregiver fruit and vegetable consumption and dietary trajectories across different measures and cohorts from early childhood through to at least 15 years of age. As discussed above, potential measurement error may mean that both parents and children reported healthier diets than they consumed. Thus, the relative odds of following the least healthy dietary trajectories for children whose parents reported the lowest fruit and vegetable consumption may be even higher than our study showed. Given the lack of associations we observed between parental smoking, alcohol consumption and physical activity, and children’s dietary trajectories, it is likely that some factors aside from parental influences may also play a role in food selection by children. These influences might operate outside the home environment, for example at childcare, pre-school or school.
Unanswered questions and future research
Future longitudinal research should obtain a broader picture both of parents’ and children’s diets, including intakes of both healthy and unhealthy foods, using more comprehensive dietary measurement tools such as computerised 24 h dietary recalls( Reference Foster, Hawkins and Delve 33 ). This research could bring greater clarity to what determines children’s intake of healthy foods compared with what determines their intake of unhealthy foods. These determinants may well differ, given that Anderson et al.’s study of American pre-school children( Reference Anderson, Ramsden and Kaye 34 ) showed a surprising lack of congruence between the healthy and unhealthy aspects of their diets. Thus, interventions focusing solely on increasing healthy foods may not simultaneously decrease unhealthy food patterns. We recommend further research that considers longitudinal variation in elements of these dietary patterns. It could also be valuable to develop and test the utility of a prediction tool, based on parental fruit and vegetable consumption, which pinpoints families in greatest need of tailored dietary interventions.
Conclusion
In conclusion, low primary caregiver fruit/vegetable consumption strongly predicted the lowest intake of healthy, but only weakly predicted unhealthy, food trajectories throughout childhood. These findings suggest that healthy and unhealthy patterns of food intake throughout childhood may differ in their early-life determinants. Secondary caregiver, usually paternal, fruit/vegetable associations were inconsistent, and alcohol consumption, smoking and physical activity did not predict children’s dietary trajectories. These findings could help develop short predictive tools to target interventions that improve intake of healthful foods for children. Other approaches may be needed to identify which toddlers and young children are likely to develop patterns of unhealthful dietary intakes.
Acknowledgements
Acknowledgements: This paper uses unit record data from Growing Up in Australia: The Longitudinal Study of Australian Children (LSAC). The study is conducted in partnership between the Department of Social Services (DSS), the Australian Institute of Family Studies (AIFS) and the Australian Bureau of Statistics (ABS). The findings and views reported in this paper are those of the authors and should not be attributed to DSS, AIFS or ABS. The authors thank all the parents and children who took part in the LSAC. Financial support: Authors of this work were supported by the Australian National Health and Medical Research Council (F.K.M., Early Career Fellowship 1037449, Career Development Fellowship 1111160), (M.W., Senior Research Fellowship 1046518); an Australian Government Research Training Program Scholarship (C.E.G.); a Murdoch Children’s Research Institute PhD Top Up Scholarship (C.E.G.); and Cure Kids, New Zealand (M.W.). Research at the Murdoch Children’s Research Institute is supported by the Victorian Government’s Operational Infrastructure Support Program. The Australian National Health and Medical Research Council, Australian Government, Murdoch Children’s Research Institute, Cure Kids and the Victorian Government had no role in the design, analysis or writing of this article. The LSAC is funded by the Commonwealth Government of Australia. Conflict of interest: M.W. receives hourly financial reimbursement from the Australian Government for her advisory role on the LSAC. The other authors have indicated they have no potential conflicts of interest to disclose. Authorship: The authors’ contributions are as follows: C.E.G., F.K.M., S.A.C., J.A.K. and M.W. formulated the research questions; C.E.G. designed the research, with input from F.K.M., S.A.C., J.A.K. and M.W.; C.E.G. conducted the research; C.E.G. analysed the data, with supervision from F.K.M., S.A.C., J.A.K. and M.W.; and C.E.G. wrote the article, with input from F.K.M., S.A.C., J.A.K. and M.W. All authors read and approved the final version of the manuscript. Ethics of human subject participation: The Australian Institute of Family Studies Ethics Committee approved each data collection wave of the LSAC and families provided written informed consent.
Supplementary material
To view supplementary material for this article, please visit https://doi.org/10.1017/S1368980018000563


