


Urban sub-Saharan Africa (SSA) is experiencing an epidemiological transition from infectious to non-communicable diseases, resulting in a double burden of disease(1). Currently, non-communicable diseases account for almost half of all deaths and disabilities in low- and middle-income countries including SSA(1). In urban SSA, the non-communicable diseases are projected to overtake infectious diseases by 2030(Reference Haddad, Hawkes and Udomkesmalee2–5). Africa is the only region in the world with a projected increase in type 2 diabetes prevalence of more than 100 % (134 %) by 2045(6). Over the last two decades, the prevalence of type 2 diabetes in Uganda and Kenya has, respectively, risen from 3 % to 5·6 % and from 4·3 % to 7·2 %(1). The increasing non-communicable disease burden is attributed to the ongoing nutrition transition in urban SSA characterised by a shift towards energy-dense nutrient-poor diets. Dietary patterns observed among urban populations in SSA show poor alignment with the WHO dietary recommendations(7,8) . For example, it is estimated that 90 % of urban Ugandans and Kenyans do not achieve the daily recommended intake of 400 g of fruits and vegetables(7,8) .
Our recent findings show that unhealthy dietary patterns in urban SSA are due to socio-cultural misconceptions, knowledge or skills gaps and low self-efficacy amidst a fast-changing food environment(Reference Yiga, Seghers and Ogwok9–Reference Mokaya, Saruni and Kyallo11). Detrimental socio-cultural misconceptions include the perception that vegetables are foods for the poor(Reference Yiga, Seghers and Ogwok9–Reference Mokaya, Saruni and Kyallo11). Recent evidence from high-income countries depicts food literacy (FL) as an easy-to-contextualise and effective approach to improve complex dietary behaviour determinants(Reference Vaitkeviciute, Ball and Harris12–Reference Poelman, Dijkstra and Sponselee15). FL may enhance an individual’s capacity to function within the prevailing environment. FL is defined as ‘the interrelated combination of knowledge, skills and self-efficacy required to evaluate information about food, and plan, manage, select, prepare and eat foods with the ultimate goal of developing a lifelong healthy, sustainable and gastronomic relationship with food within a prevailing socio-economic, cultural, physical and virtual environment(Reference Vidgen and Gallegos16,Reference Perry, Samra and Edmonstone17) .’ Hence, improving FL may be a potential strategy to improve dietary patterns in urban SSA.
Interventions that aim to improve FL require proper evaluation studies to assess their effectiveness and future reproducibility. However, there is a lack of tools to measure FL that are (1) validated (reasonably accurate and reliable) and (2) culture-specific(Reference Amouzandeh, Fingland and Vidgen18). Consequently, most nutrition interventions are evaluated based on their effects on specific behavioural determinants (e.g. attitudes or self-efficacy towards healthy eating) but not on people’s overall capability to plan, manage, select, prepare and eat healthy foods(Reference Amouzandeh, Fingland and Vidgen18). Further, measuring FL requires instruments that are population- and culture-specific because FL is a complex, highly contextual and culture-dependent concept. As such FL scales need to be developed and validated in the appropriate context(Reference Vidgen and Gallegos16,Reference Perry, Samra and Edmonstone17,Reference Boedt, Steenackers and Verbeke19) . To the best of our knowledge, presently there are no tools that have been specifically developed and validated to measure FL in SSA. The lack of validated culture-specific assessment tools is a setback to both observational and intervention research applying FL(Reference Amouzandeh, Fingland and Vidgen18). For instance, it is of interest to identify individual, social or contextual factors that influence FL. Likewise, due to resource constraints, culturally adaptable tools are needed in SSA. Cross-cultural usage of tools necessitates tools that can be linguistically translated (language framing) and retain content validity at the conceptual level across the different cultures(Reference Beaton, Bombardier and Guillemin20). This study aimed to develop and validate a multidimensional food literacy scale (FL-scale) culturally adaptable to the adult population (18–69 years) in urban East African settings.
Methodology
Study design
Currently, there is no gold standard to validate FL-scales(Reference Boateng, Neilands and Frongillo21). Therefore, a mixed approach consisting of three phases with ten underlying steps was used to develop and validate the new FL-scale (Fig. 1)(Reference Boateng, Neilands and Frongillo21).

Fig. 1 Overview of the study design: the study consisted of three phases (boxes with green borders) and 10 steps in line with recent guidelines(Reference Boateng, Neilands and Frongillo21). Legend: In Step 1, a team comprising FL experts (core expert panel) generated a universal FL-scale. To ensure cultural adaptability to urban Kenya and Ugandan settings, Steps 2–6 of this figure were executed independently in the two countries. In Steps 7–10, the two-country-specific FL-scales were synchronised into an East African FL-scale. Boxes with blue borders represent the steps that were conducted independently in each country, and boxes with black borders represent the steps which were executed universally.
In Phase 1, the FL-scale was developed through an iterative process involving literature review, consultation of experts (content validity) and insights from the target population (face validity). Phase 1 was conducted between April 2020 and March 2021.
In Phase 2, two sets of cross-sectional surveys were conducted to evaluate the newly developed FL scale. The first set of cross-sectional surveys was conducted to assess (1) the reliability and internal consistency of the FL-scale, (2) construct validity by comparing the developed FL-scale against healthy eating self-efficacy scale (HEWSE)(Reference Wilson-Barlow, Hollins and Clopton22) and the prime dietary quality score (PDQS)(Reference Kronsteiner-Gicevic, Mou and Bromage23) and (3) criterion validity by exploring the association between developed FL-scale with fruit and vegetable consumption. FL may optimise one’s healthy dietary behaviour; hence, we used dietary quality assessment scales (PDQS and HEWSE) to validate our FL scale. We considered fruit and vegetable consumption as 90 % of urban Ugandans and Kenyans do not meet the WHO recommendations. The second set of cross-sectional surveys was conducted to assess the concurrent validity.
In Phase 3, the two country-specific validated FL-scales were synchronised into one FL-scale to act as an FL-scale for urban Uganda and Kenyan settings, the East African FL-scale.
Phase 1: development of the food literacy-scale
Step 1: item development
The FL-scale items were generated by a team of five core academic experts in the domain of FL. In the first stage of the FL-scale development, one expert (PY) generated a comprehensive list of items relating to FL in Uganda and Kenya’s context. To compile the list, initially, a search of the literature for existing questionnaires on FL and questionnaires covering the determinants of FL was conducted. In the second stage, the compiled list was shared with four academic experts (CM), (PO), (MM) and (FK) to provide feedback by (1) highlighting important and unclear items, (2) adding missing items and (3) deleting or merging double items or non-FL items. Based on the input of the experts, the items were critically revised to a final draft of the FL-scale.
Step 2: content and face validity
Content validation was conducted with experts and face validity with the target population(Reference Boateng, Neilands and Frongillo21,Reference Yusoff24) .
Content validation
In Uganda, an independent expert panel (n=7) consisting of lecturers from the department of Human Nutrition of Kyambogo University was used, while in Kenya, a panel (n=7) selected from the Ministry of Health, the Kenya Nutritionists and Dieticians Institute, the Nutrition Association of Kenya, Kenyatta University and Kenyatta National Hospital validated the FL-scale for its content. Letters of invitation were sent to the experts soliciting their participation in the content validation. Consenting experts were emailed the FL-scale and asked to rate each question’s relevance to the concept of FL on a four-point Likert scale: 1 (item not relevant) to 4 (item highly relevant), Additional file 1. The item content validation index (I-CVI) and Scale content validity index (S-CVI/Ave) were calculated from experts’ responses to measure content validity(Reference Polit and Beck25,Reference Polit and Beck26) . I-CVI was computed as the proportion of experts rating an item at either 3 (quite relevant) or 4 (highly relevant), divided by the total number of experts. Scale content validity index/Ave was computed as the average I-CVI scores for all items on the scale judged by all experts(Reference Polit and Beck25). The I-CVI and Scale content validity index should be at least 0·78 and 0·9, respectively, to qualify the questionnaire as content valid(Reference Polit and Beck26,Reference Davis27) .
Face validity
Semi-structured cognitive interviews were conducted according to Patrick et al. (Reference Patrick, Burke and Gwaltney28) with Ugandan (n=10) and Kenyan adults (n=10) to assess the clarity and understandability of the FL-scale. In Uganda, participants were recruited in Entebbe City through the Full Gospel Church while in Kenya, the recruitment site was the Seventh Day Adventist Church Juja, Kiambu County. During the interviews (the tool was administered on paper in person), participants were encouraged to think aloud about the questions and explain how they interpreted the questions. At the end of the interviews, participants were asked to comment on: (1) aspects they thought were not in the questionnaire but would be relevant to include and (2) what they thought about the length of the questionnaire. All interviews were audio recorded, and qualitative analysis was performed according to the principles of Patrick et al. (Reference Patrick, Burke and Gwaltney28). The number of participants who misinterpreted a question was counted for each question. Where necessary, the misinterpreted questions were revised according to the feedback of participants during the interviews.
Phase 2: validation of food literacy-scale
Study population
Two sets of study sample were recruited to validate the developed FL-scale. First, to assess reliability, construct and criterion validity, a sample of Ugandan (between April 2021 and May 2021) and Kenyan (November to December 2021) adults (18–69 years) were recruited through the institutional religious groups of Entebbe Full Gospel church in Entebbe city, Uganda and the Seventh Day Adventist Church Juja, Kiambu County, Kenya. The institutions were selected owing to their established social networks and community outreach across Entebbe and Kiambu. On church service days, the researchers presented the study and invited potential participants to take part in the study. According to Willett, a reasonable sample size for validation studies includes about 100–200 participants(Reference Willett29). Second, to assess the concurrent validity, undergraduate Human Nutrition (final year) and IT (second year) students were recruited from Kyambogo University in Kampala, Uganda (April 2021) and Jomo Kenyatta University of Agriculture and Technology in Nairobi, Kenya (February 2022). To recruit the students, the researchers and heads of the respective departments made brief presentations about the study during the routine lectures. At the end of the presentations, interested students were invited to participate in the study.
Measures
Socio-demographic characteristics
Data on age, sex, occupation or employment status, marital status and education level were collected using a socio-demographic questionnaire.
Food literacy
A total FL score was calculated from the newly developed FL-scales based on the individual scores obtained for each question. Response options included a four-point Likert scale (1=‘strongly disagree/never’ to 4=‘strongly agree/always’). Response options for questions on eating practicalities were based on the WHO recommendations(30). Questions on nutrition knowledge and fruit and vegetable consumption were scored according to the WHO recommended daily allowance. We generated a scoring scheme where participants scores decreased as consumption deviated from the recommended daily allowance. The rest of the questions were evaluated based on a four-point Likert scale and were scored accordingly. Negative items received an inverse score, indicating that the higher the score, the higher the FL, Additional file 2. The FL score was obtained by summing up the scores of the individual questions and dividing the total obtained score by the maximum possible score. If a participant indicated that he/she was not employed, questions assessing FL practices in the work environment were excluded from calculating the total FL score. The total FL score was recalculated to a percentage score of 100, where a score of 0 suggests a low level of FL and a score of 100 suggests the highest level of FL.
Dietary quality
PDQS was taken as a proxy for dietary quality. PDQS was assessed using a validated PDQS-based diet quality screener(Reference Kronsteiner-Gicevic, Mou and Bromage23). The PDQS is a global rapid and cost-efficient food-based diet quality index developed to measure dietary quality at a global level. PDQS has been evaluated among US women against 24-h dietary recall Healthy Eating Index 2015, and energy nutrient intakes from the 24-h dietary recalls. The PDQS positively correlated with energy-adjusted nutrient intakes and Healthy Eating Index 2015. The granular scoring approach was applied to generate the PDQS(Reference Kronsteiner-Gicevic, Mou and Bromage23). In the granular scoring approach, healthy components are scored as 0 = once or less/month, 1 = 2–3 times/month, 2 = 1–2 times/week, 3 = 3–4 times/week, 4 = 5–6 times/week, 5 = once/day, 6 = 2 or more times/day and a reverse coding for the unhealthy components.
Healthy eating self-efficacy
Healthy eating self-efficacy was assessed using the seven-item healthy eating self-efficacy subscale of the HEWSE(Reference Wilson-Barlow, Hollins and Clopton22).
Validation steps
Step 3: reliability
To assess reliability, participants completed the FL-scales twice after a 2-week interval(Reference Boateng, Neilands and Frongillo21). Intraclass correlation was conducted to ascertain the test–retest reliability. The cut-off for reliability was an intraclass correlation of 0·7(Reference Polit and Beck26). Additionally, internal consistency was assessed by calculating Cronbach’s alpha. A value of Cronbach’s alpha above 0·7 was considered to be an indicator of adequate internal consistency, while a value below 0·4 indicated low internal consistency(Reference Polit and Beck26).
Step 4: construct validity
To evaluate the construct validity of the developed FL-scales, Pearson correlation coefficients (normal distribution of the scores) between PDQS and HEWSE and FL scores were calculated. Correlations were categorised as follows: 0·3 < 0·5 implying a small correlation; 0·5 < 0·7, a moderate correlation and 0·7–1·0 a large correlation(Reference Polit and Beck25,Reference Polit and Beck26) .
Step 5: criterion validity
Linear regression analyses were conducted to determine whether the consumption of healthy foods (fruit and vegetables) is associated with FL scores. A model was built where FL scores were fitted as a continuous dependent variable while fruits and vegetable intake was the independent variable(Reference Poelman, Dijkstra and Sponselee15). From a conceptual point of view, FL score would be the logical independent variable and fruits and vegetable intake the dependent variable in the analyses. However, we reverted the order to conduct linear regression analyses (with FL scores as a continuous dependent variable) to enable easier interpretation of the coefficients(Reference Poelman, Dijkstra and Sponselee15). Poelman et al. (Reference Poelman, Dijkstra and Sponselee15) have applied a similar logical approach. The model was adjusted for potential FL confounders: age, marital status, sex and educational level(Reference Poelman, Dijkstra and Sponselee15). Regression coefficients and 95 % CI were obtained.
Step 6: concurrent validity
Concurrent validity evaluates the capacity of the developed FL scale to distinguish between subgroups with an assumed higher or lower FL. We hypothesised that fourth- and third-year Human Nutrition students would, on average, have higher levels of FL compared with the general population (IT students). Linear regression analyses were conducted to determine the FL-scales’ capacity to distinguish between high and low FL. A model was built in which the ‘population’ (Human Nutrition students v. IT students) were the independent variable, and the FL score was the dependent variable. The model was adjusted for age and sex. Regression coefficients and 95 % CI were obtained.
Phase 3: development and validation of an East African food literacy scale
Step 7: synchronisation of the two country-specific validated food literacy-scales to create an East African food literacy scale
The two FL-scales generated from the independent validation process from each country were compared to identify variations. Items only present in both FL-scales were maintained in the East African FL-scale. The items which were found to differ in content in the two FL-scales were dropped. Items that were different in framing (modified to fit the specific context) but elicited the same content were maintained in the East-African FL scale.
Step 8: misclassification tests
Using data collected in Phase 2, weighted kappa tests were carried out between the East-African FL-scale and the country-specific validated FL-scale to ascertain whether the synchronisation process could have resulted in the misclassification of individuals’ FL levels. Strength of agreement was categorised as κ < 0·00: poor; κ = (0·00–0·20): slight; κ = (0·21–0·40): fair; κ = (0·41–0·60): moderate; κ = (0·61–0·80): substantial; κ = (0·81–1·00): almost perfect(Reference Küchenhoff, Augustin and Kunz31).
Step 9: correlation tests
Using data collected in Phase 2, Pearson correlation tests were carried out between the East African FL-scale and country-specific FL-scale for each country to ascertain whether the East African FL-scale and country-specific validated FL-scales were correlated.
Step 10: construct/concurrent validity and reliability of the East African food literacy scale
Using data collected in Phase 2, the construct validity of the East-African FL-scale was evaluated using Pearson correlation tests between PDQS and HEWSE and the East-African FL-scale scores. In addition, reliability and concurrent validity were calculated using the methodology described in Phase 2.
Results
Phase 1: development of the food literacy scale
Step 1: item development
Based on the literature search, the Self-Perceived Food Literacy Scale (SPFL) designed by Poelman et al. (Reference Poelman, Dijkstra and Sponselee15) was selected as a starting reference for generating the items for the new FL-scale. The SPFL scale has good reliability, internal consistency, high criterion validity and the capacity to distinguish populations with high FL compared with those with low FL. The SPFL scale was adapted to the Ugandan and Kenyan context by considering determinants of dietary behaviour in urban Uganda and Kenya(Reference Yiga, Seghers and Ogwok9–Reference Mokaya, Saruni and Kyallo11). Based on the determinants of dietary behaviour in urban Uganda and Kenya, the adapted items from SPFL were further supplemented with items from the FL framework (plan and management, select, prepare and eat) proposed by Vidgen et al. (Reference Vidgen and Gallegos16) and (information evaluation) Perry et al. (Reference Perry, Samra and Edmonstone17). The iterative process involving the literature review and the FL core expert panel feedback sessions yielded a draft FL-scale consisting of forty-eight questions, Additional file 3.
Step 2: content and face validation
Content validation
Although the content validity as measured by Scale content validity index was slightly lower than the recommended 0·90 (0·82 in Uganda and 0·84 in Kenya), the relevance of the FL-scale was considered acceptable to the concept of FL. In Uganda, twenty items on (1) selection (making a shopping list, storage and stocking), (2) preparation (hygiene and capabilities regarding the preparation of vegetables) and (3) eating practicalities (knowledge of recommendations for fruits and vegetables and consumption in potential food desert contexts) had an I-CVI below the recommended 0·78. Of the items which received an I-CVI < 0·78, questions only on ‘hygiene’ were removed from the scale. Items assessing the hygiene of fruit and vegetables prepared at home were rated less relevant as it may be difficult for people to confess that their home (cooking) environment is unhygienic. Other items were considered important by the core academic expert panel and were maintained in the FL-scale. Additionally, even though items probing consulted sources of information were considered relevant by nutrition experts, they were removed from the FL-scale as it would be difficult to evaluate the reliability of different sources. For instance, somebody’s source of information may be friends or peers/family members who are nutritionists. In addition, mass or social media may be a source of information when either person discussing nutrition on mass or social media is not a nutritional expert (which is very common in Uganda) or an expert.
In Kenya, a total of sixteen items received an I-CVI < 0·78. Four items had an I-CVI < 0·70 and were eliminated: (i) ability to cook vegetables in at least three different ways, (ii) confidence in changing recipes to make them healthier, (iii) ability to choose relevant nutrition information and (iv) ability to judge whether healthy eating information shared on various platforms can be trusted. Drawing from the models of FL by Vidgen et al.,(Reference Vidgen and Gallegos16) and Perry et al. (Reference Perry, Samra and Edmonstone17), the other items with an I-CVI < 0·78 were considered relevant by the expert panel and hence maintained in the FL-scale. The propositions that were suggested to reframe questions were considered because experts considered them essential for contextual fitness to the Kenyan setting.
Face validity
In Uganda, the content validity assessment with the target population revealed that our FL-scale was clear and well understood by the adult population and had a suitable length. However, some participants remarked that the item ‘rate your confidence in changing recipes to make them healthier’ was difficult to understand. The item was reframed as it was judged important by the expert FL panel. Additionally, the item on ‘how often do you cook meals at home’ was rephrased to ‘how often do you cook/eat meals prepared at home’ as the respondent may not be directly involved in food preparation, but they eat meals prepared at home. Content validation yielded a final draft of an FL-scale used in Uganda consisting of forty questions, Additional file 4.
Likewise, in Kenya, the target group rated the FL-scale as being clear. However, some participants noted that the questions on fruit and vegetable consumption with a nine-point Likert scale were confusing. As such, the nine-point Likert scale was reduced to a five-point Likert scale. Additionally, some participants noted that the numbering of some items (e.g. 38a, 38b, 38c) would imply that the respondent had the option of choosing one item on the scale. As result, the numbering of the entire FL-scale was reordered to be continuous, and each question was structured to be complete, without having to read part of the question separately. In total, after content validation, the FL-scale used in Kenya was composed of forty-one questions, Additional file 4.
Phase 2: validation
Socio-demographic characteristics
General adult population
A total of 105 participants in Uganda and 109 in Kenya took part in the reliability and construct validity of the FL-scale. The majority were women and had attained a higher institution qualification, Table 1.
Table 1 Socio-demographic characteristics of participants

Student population
In Uganda, a total of 109 students participated, of which fifty-four were human nutrition students while in Kenya fifty students took part in the study, of which twenty-five were studying Human Nutrition.
Step 3: reliability
In Uganda, average FL scores of 51·02 ± 10·52 and 51·78 ± 11·01 were, respectively, recorded for measurements 1 and 2. While in Kenya, FL scores of 55·18 ± 11·74 and 55·95 ± 13·13 were recorded. The intraclass correlation for test–retest showed good reliability of the Ugandan FL-scale (ß = 0·70 (95 % CI: 0·59, 0·79). The FL-scale also had good internal consistency (Cronbach’s α = 0·83 (95 % CI: 0·75, 0·88). Equally, the Kenyan FL-scale also showed good reliability (ß = 0·78 (0·69, 0·84) and internal consistency (Cronbach’s α = 0·87 (95 % CI: 0·82, 0·91), Table 2.
Table 2 Reliability, construct validity and capacity to distinguish FL-scale
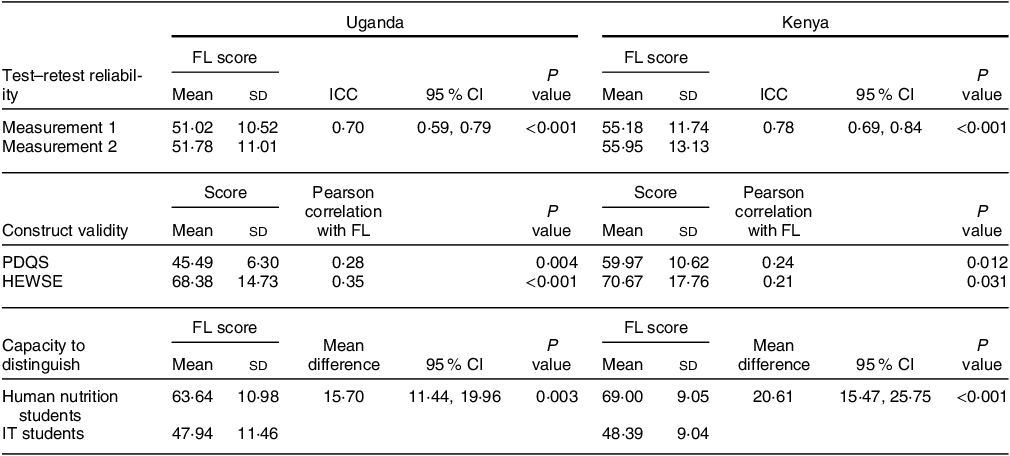
FL-score, food literacy score; ICC, intra class correlation; PDQS, prime dietary quality score; HEWSE, healthy eating and weight self-efficacy scale; IT, information technology. Test to retest reliability and concurrent validity (n 105, Uganda; n 109, Kenya). Concurrent validity (n 109, Uganda; n 50, Kenya).
Step 4: construct validity
Regarding construct validity (Table 2), PDQS and FL were positively correlated to weak magnitude (Pearson correlation r = 0·28, P = 0·004 in Uganda and r = 0·24, P = 0·012 in Kenya). HEWSE and FL also showed weak positive correlations (Pearson correlation r = 0·35, P < 0·001 in Uganda and r = 0·21, P < 0·031 in Kenya).
Step 5: criterion validity
As theoretically predicted, a higher FL was associated with a higher frequency of fruit consumption (≥ 1 time/day, P = 0·023, Table 3). Participants who reported consuming fruits every day had higher FL levels (β = 5·03 (0·69, 9·37). However, no association was observed after adjustment for sex, education, age and marital status (β = 3·64 (–0·52, 7·80). With regards to vegetable consumption, no association was observed (β = 4·27 (–0·46, 8·99).
Table 3 Linear regression analyses for the associations between fruit and vegetable consumption (categorical variables) and FL-scale (continuous variable) for Ugandan adults

FL, food literacy; PDQS, prime dietary quality score.
Vegetable and fruit consumption calculated from the PDQS 30-day food frequency screener.
Step 6: capacity to distinguish
On average, the Human Nutrition students had a higher FL score compared with IT students, as shown in Table 2. In Uganda, the linear regression analysis showed statistically significant differences between the two student groups (β = 15·70, se = 2·151, 95 % CI = 19·97, 11·44, P < 0·001) that remained statistically significant after adjustments for age and sex (β = 15·20, se = 2·796, 95 % CI = 20·75, 9·66). A similar observation was noted in Kenya (β = 20·61, se = 2·557, 95 % CI = 25·75, 15·47, P < 0·001) and (β = 19·81, se = 3·008, 95 % CI = 25·87, 13·76) before and after adjustments.
Phase 3: synchronisation of the Kenyan and Ugandan food literacy scales into an integrated food literacy scale for East Africa
Step 7: creating an East African food literacy scale
Compared with the universally generated FL-scale (Additional file 3) in Step 1, a total of twenty-six items had been rephrased to fit the different country contexts, while ten items were unchanged.
Six items were present in the Ugandan FL-scale but had been excluded in the Kenyan FL-scale. These included items assessing (i) ability to cook vegetables in at least three different ways, (ii) confidence to change recipes to make them healthier, (iii) behaviour to pack fruits when going to work, (iv) behaviour to pack vegetables when going to work, (v) ability to screen relevant information from available information on healthy eating and (vi) ability to judge whether information on healthy eating that is available through various platforms can be trusted. Likewise, six items were present in the Kenyan FL-scale but had been dropped in the Ugandan version. These include items assessing (i) confidence about the hygiene of fruits eaten at home, (ii) behaviour of using nutritional information from friends, (iii) mass media, (iv) social media, (v) health workers who are not nutrition specialists and (vi) nutrition specialists.
In total, these twelve items, which were different across the two country-specific validated FL-scales, were dropped from either FL-scale to arrive at a synchronised East African FL-scale, composed of thirty-four items, Additional file 5. For comparability purposes, Steps 8–10 were executed based on the thirty-four-item scale. However, the core academic expert panel noted that five of the twelve items considered unimportant by the content validation experts were fundamental to the concept of FL. The items included (i) the ability to cook vegetables in at least three different ways, (ii) the behaviour to pack fruits when going to work, (iii) the behaviour to pack vegetables when going to work, (iv) the ability to screen relevant information from encountered information on healthy eating and (v) ability to judge whether healthy eating information shared on various platforms can be trusted. The core academic experts recommended extending the thirty-four items scale with the five items. As a result, the suggested East African scale is composed of thirty-nine items, Additional file 6.
Step 8: misclassification tests
Weighted Kappa tests revealed no deviations in individuals’ FL levels when either the East African FL-scale or the country-specific validated FL-scales were used (0·86 (95 % CI: 0·83, 0·89) P = 0·000) in Uganda and (0·86 (95 % CI: 0·84, 0·88) P = 0·000) in Kenya, Table 4.
Table 4 Construct validity, correlation and misclassification tests of the East African FL-scale as evaluated in a Ugandan and Kenyan population

FL, food literacy; PDQS, prime dietary quality score; HEWSE, healthy eating self-efficacy scale.
Step 9: correlation tests
Pearson correlational analyses revealed very strong correlations between the two country-validated FL-scales and the East African FL-scale (Table 4).
Step 10: construct validity of the East African food literacy scale
Regarding construct validity, Pearson correlational analyses revealed weak positive correlations between FL and PDQS, and HEWSE (Table 4). Likewise, the FL-scale showed good reliability (0·71 (95 % CI: 0·60, 0·79) P < 0·001, Uganda; 0·78 (95 % CI: 0·69, 0·84) P < 0·001, Kenya), internal consistency (0·83 (95 % CI: 0·75, 0·88) P < 0·001, Uganda; 0·88 (95 % CI: 0·82, 0·92) P < 0·001, Kenya) and capacity to distinguish populations depending on their FL levels (β = 14·54 (95 % CI: 10·27, 18·81), Uganda; β = 18·79 (95 % CI: 13·92, 23·68), Kenya).
Discussion
A thirty-nine-item East African (using Uganda and Kenya as case examples) FL-scale was developed to measure FL among the East African adult populations. The East African FL-scale covers the five major FL domains (plan/manage, select, prepare, eating practicalities and information evaluation)(Reference Vidgen and Gallegos16,Reference Perry, Samra and Edmonstone17) . The East African FL-scale has been validated using both quantitative and qualitative approaches based on guidelines by Boateng et al.,(Reference Boateng, Neilands and Frongillo21). The East African FL-scale was developed based on the globally recognised FL frameworks(Reference Vidgen and Gallegos16,Reference Perry, Samra and Edmonstone17) and a validated SPFL scale by Poelman et al. (Reference Poelman, Dijkstra and Sponselee15). Building on existing scales to develop scales for use in new contexts has been shown to result in scales with good psychometric properties provided cultural adaptation (language and culture of the new setting) guidelines are followed(Reference Jomori, da Costa Proença and Echevarria-Guanilo32). Beaton et al. (Reference Beaton, Bombardier and Guillemin20) recommend a process that ensures semantic, idiomatic, experiential and conceptual equivalence between the source and target scales, and retesting of the psychometric properties especially where considerable differences exist across the two contexts. During the development of the current FL-scale, the determinants of dietary behaviours in urban Uganda and Kenya were considered(Reference Yiga, Seghers and Ogwok9–Reference Mokaya, Saruni and Kyallo11). For example, our qualitative inquiries showed lower consumption of fruits and vegetables largely due to cultural misconceptions, planning and preparation skills, food deserts at work environments and misinformation regarding healthy eating. Accordingly, the developed scale focussed mainly on FL themes relating to these determinants of fruit and vegetable consumption. Additionally, the FL-scale was content validated by local nutrition experts and the target population. Content validation of scales with the target group is especially important as it minimises unforeseen discrepancies between the intended meaning and participants’ interpretation of the questions(Reference Patrick, Burke and Gwaltney28) and is a unique inclusion in our study. The two FL scales were shown to be well understood through evaluations of cognitive validity and it reasons that the East Africa FL scale would also be reasonably understood by the population.
The newly developed East African FL-scale is a product of independent validation in two countries: Kenya and Uganda. The independent validation in the two country settings is a unique approach and shows the importance of contextualising a tool. Even though tools may have identical content, it is important that the question framing is adapted to specific contexts. For example, our approach revealed the need to adapt the question framing even though the contexts of Kenya and Uganda are closely related.
The content validation with the experts recommended the removal of five items which are fundamental to the concept of FL(Reference Vidgen and Gallegos16,Reference Perry, Samra and Edmonstone17) . Topical studies have reported a limited shared understanding of FL by nutritional experts across the globe(Reference Fingland, Thompson and Vidgen33,Reference Thompson, Adams and Vidgen34) . This finding may indicate that FL as a concept is yet to be understood by nutritional experts in Uganda and Kenya. The finding further demonstrates that a Delphi consensus could be an additional approach to conduct expert content validation when designing scales on new domains like FL. In light of the increasingly complex determinants driving the nutrition transition in urban Africa(Reference Yiga, Seghers and Ogwok9–Reference Mokaya, Saruni and Kyallo11), the core expert panel recommended maintaining the five items in the East African FL-scale. For example, the item ‘how often do you pack fruits when going to work’ is an important practicality amidst the increasing food deserts across urban East Africa. Likewise, the complexity of the virtual food environment requires the skills and self-efficacy to choose relevant nutrition information and evaluate the information for facts and non-facts.
The FL-scale showed a positive correlation with healthy eating assessed by the PDQS. However, like the findings of the two countries’ specific validated FL-scales, the correlation was of a small magnitude, and this could be attributed to the use of PDQS. The PDQS is a new global diet quality index that is still under testing in low- and middle-income countries and may not yet be an optimal measure for dietary quality in SSA settings(Reference Kronsteiner-Gicevic, Mou and Bromage23). For example, according to the scoring scheme, it was difficult to assess whether to score ‘matooke’, a staple food in Uganda, positively or negatively. Such limitations could have resulted in the observed small correlations between both methods. Nevertheless, as there are no currently validated dietary quality assessment tools in East Africa, the PDQS is the closest quality assessment tool we could use.
Our FL scale emphasises the consumption of fruits and vegetables due to the consistently low consumption levels in urban SSA(7–Reference Yiga, Seghers and Ogwok9). Capturing people’s FL in terms of fruit and vegetable consumption is vital in urban SSA settings like Uganda and Kenya. Our FL-scale showed associations between FL and fruit and vegetable consumption, but no associations were observed after adjusting for socio-demographic factors, sex, age, education and marital status. Furthermore, the current FL-scale focuses on the individual level, but it may be important to ascertain how FL varies across the different socio-demographic levels, both at intra-individual (age, sex, education status) and external level (access to education, minimum wage, physical food environment). Understanding the contextual external factors that interfere with the potential of having a higher FL is vital for designing contextual-specific/personalised FL interventions.
Strengths and limitation
Our scale is comprehensive (covers all the five major FL domains), of an acceptable length and the first in SSA. To the best of our knowledge, our study is the first to develop and validate a scale to assess adult FL concerning healthy eating in urban SSA.
Apart from the scales’ by Boedt et al. (Reference Boedt, Steenackers and Verbeke19), Poelman et al. (Reference Poelman, Dijkstra and Sponselee15) and Thompson et al.,(Reference Thompson, Byrne and Adams35), all developed for high-income country settings, globally there is a lack of adult FL scales collectively covering the five FL domains(Reference Amouzandeh, Fingland and Vidgen18). The majority of the existing FL scales focus on specific sub-domains of FL, making their transferability to assessing FL as a whole challenge(Reference Amouzandeh, Fingland and Vidgen18). Comprehensive FL scales may have higher practical applicability. Even though we developed and validated a comprehensive FL-scale based on theory and expert views, we recognise that FL is a complex aspect which remains a challenging concept to measure(Reference Poelman, Dijkstra and Sponselee15–Reference Amouzandeh, Fingland and Vidgen18). Aside from individual FL domains, themes like cultural aspects, emotions, socio-economic status, food systems and related infrastructure arrangements at the community and national level may variably influence FL(Reference Poelman, Dijkstra and Sponselee15–Reference Amouzandeh, Fingland and Vidgen18). Without capturing all the FL-related themes, it may be difficult to ascertain people’s FL.
The use of a mixed-method approach comprising experts, target groups, qualitative studies and globally recognised FL theoretical frameworks is a unique strength of our study and results in a FL scale which showed the ability to distinguish a population presumed to have high food literacy (final year Human Nutrition undergraduate students), from the general population.
Our study had some limitations. First, all our measures in the cross-sectional survey were self-reported. This may introduce reporting bias as participants express their ideas instead of the actual behaviour or induce a social desirability bias. Unfortunately, these limitations are common in the behavioural nutrition research domain. Secondly, our approach slightly deviated from the recommendations proposed by Boateng et al. (Reference Boateng, Neilands and Frongillo21) for developing scales. As we worked by contextualising the scale designed by Poelman et al. (Reference Poelman, Dijkstra and Sponselee15) and the globally recognised FL frameworks of Vidgen & Gallegos(Reference Vidgen and Gallegos16) and Perry et al. (Reference Perry, Samra and Edmonstone17) to generate the items for the new tool, questions may arise on the validity of our approach. Generally, building on existing scales to develop scales for use in new contexts has been shown to result in valid scales, provided cultural adaptation guidelines are followed(Reference Jomori, da Costa Proença and Echevarria-Guanilo32,Reference Stjernqvist, Elsborg and Ljungmann36) . For example, Jomori et al. (Reference Jomori, da Costa Proença and Echevarria-Guanilo32) contextualised a cooking skills and healthy scale from North America for use in Brazil. The scale showed a good validity in Brazilian context and has been successfully used for the evaluation of interventions in this context(Reference Bernardo, Jomori and Fernandes37). As seen above, our FL scale showed a good validity. In our view, the approach of contextualisation of evidence from other settings for use in new contexts has no methodological flaws, provided cultural adaptation guidelines are followed. Lastly, even though, our recruitment strategy was random, we observed that unintentionally, the majority of our sample had post-secondary education and were employed. Accordingly, this may limit the generalisability to the general population. Specifically, caution may need to be taken when using the scale among populations with education below post-secondary.
Implications for practice and research
The new East-African FL-scale is unique as it covers most of the essential attributes of individual FL and is a handy tool to give a clear perspective of an individual’s FL. With the need for interventions to address the nutrition transition in urban SSA, attempts to improve FL could be a holistic strategy.
Our FL-scale can be used to assess FL in adults and as well to evaluate behaviour change lifestyle interventions aimed at increasing FL and fruit and vegetable consumption in urban Kenya and Uganda. Nevertheless, the ability of the scale to capture pre–post intervention changes still needs to be evaluated. Furthermore, there is still a need to explore/examine the specific domains of FL with outcomes to determine any drivers of specific behaviours or intake. The FL-scale can be used as basis in other East African and SSA settings when the cultural adaptation guidelines elaborated by Beaton et al. (Reference Beaton, Bombardier and Guillemin20) are applied. When applying the FL-scale, it may be important to adjust for confounding factors like economic and socio-demographic factors. Adjustment for gender particularly may be important in SSA, as some of the FL practicalities, particularly within the ‘preparation domain’, are still largely charged with women. As well, there is a need to establish cut-off points for defining high v low FL to guide future intervention studies, evaluating interventions targeted at improving FL. Additionally, the performance of any validated scales may be compromised when as a result of changes in the population or context, errors in measurement or unforeseen variables affecting the outcomes(Reference Boateng, Neilands and Frongillo21).
Conclusion
The results of this study demonstrate the development and validation of a comprehensive FL-scale for the measurement of FL among adults living in Uganda and Kenya. The thirty-nine-item FL-scale is a valid, reliable and theory and expert-based scale covering the five major domains of FL. The FL-scale can be applied in a range of studies, particularly in research measuring FL. Provided culture-sensitive translation and adaptation are performed, the FL-scale can be used as a basis in other East African and SSA countries.
Acknowledgements
We acknowledge the input of Richard Onywere (SDA Church Juja, Kenya) for the mobilisation of participants for data collection. We also appreciate Susan Nakaayi Muluuta and Nakatudde Catherine for their input towards data collection. We are grateful to all the participants for volunteering to take part in the study.
Financial support
This work was supported by the Belgian Directorate General for Development Cooperation and Humanitarian Aid (DGD) and VLIR-UOS. Peter Yiga was supported by a PhD scholarship by DGD, while Moses Mokaya was supported by a PhD scholarship from VLIR-UOS through the Institutional University Cooperation (IUC) to Jomo Kenyatta University of Agriculture and Technology (Grant number: KE2017IUC037A101). DGD (www.diplomatie.belgium.be/) and VLIR-UOS (www.vliruos.be) were not involved in the conceptualisation and interpretation of this manuscript.
Conflict of interest
None to declare.
Authorship
P.Y., C.M. and M.M. designed the study. P.Y., T.K., M.M. and F.K. conducted the study. P.Y., M.M. and C.M. analysed the data. P.Y. wrote the first draft of the manuscript, and C.M., M.M., A.K., F.K., T.B., P.O. and T.K. read, revised, improved and approved the final manuscript. Joint first co-authorship of Peter Yiga and Mokaya Moses.
Ethics of human subject participation
This study was conducted according to the guidelines laid down in the Declaration of Helsinki and all procedures involving research study participants were approved by the Uganda National Council for Science and Technology (Registration number: HS1415ES) and the African Medical Research Foundation (Registration number: ESRC P972-2021). Written informed consent was obtained from all subjects.
Availability of data and materials
The datasets used and/or analysed during the current study are available from the corresponding author upon reasonable request.
Supplementary material
For supplementary material accompanying this paper visit https://doi.org/10.1017/S136898002400168X


 Open access