Consuming a diet rich in fruits and vegetables is associated with a decreased risk of CVD( Reference Danaei, Ding and Mozaffarian 1 – Reference Hung, Joshipura and Jiang 4 ), the leading cause of mortality in the USA( 5 ). When incorporated into an overall healthy lifestyle, regular consumption of fruits and vegetables is associated with a reduced risk of all-cause mortality( Reference Loef and Walach 6 ). A growing body of evidence also shows a positive relationship between dietary variety and micronutrient intake( Reference Griep, Verschuren and Kromhout 7 – Reference Foote, Murphy and Wilkens 9 ). Accordingly, the 2010 Dietary Guidelines for Americans provide recommendations for consuming adequate amounts and variety of fruits and vegetables. Yet, despite an ongoing national programme to improve consumption habits( 10 ), the proportion of Americans meeting these guidelines remains low( Reference Demydas 11 – Reference Casagrande, Wang and Anderson 14 ). Marked differences in consumption patterns have been observed across race/ethnic groups( Reference Kant, Graubard and Kumanyika 15 , Reference Serdula, Gillespie and Kettel-Khan 16 ) as well as regions of residence( Reference Grimm, Blanck and Scanlon 12 ) and, importantly, some evidence suggests that race/ethnicity and region of residence may synergistically influence consumption patterns( Reference Newby, Noel and Grant 17 – Reference Thompson, Demark-Wahnefried and Taylor 19 ). These findings suggest that determinants of fruit and vegetable consumption may be more nuanced than had previously been understood and that highly targeted dietary interventions may be needed for certain population groups. Examining the relationship of race/ethnicity and region of residence with fruit and vegetable consumption is therefore critical to improving Americans’ food consumption habits.
Differences in fruit and vegetable consumption across racial/ethnic groups have been well demonstrated( Reference Demydas 11 , Reference Grimm, Blanck and Scanlon 12 , Reference Casagrande, Wang and Anderson 14 – Reference Serdula, Gillespie and Kettel-Khan 16 , Reference Thompson, Demark-Wahnefried and Taylor 19 – Reference Krebs-Smith, Cook and Subar 25 ). Studies have found that non-Hispanic blacks consume fewer fruits and vegetables than other race/ethnic groups( Reference Casagrande, Wang and Anderson 14 – Reference Serdula, Gillespie and Kettel-Khan 16 , Reference Kim, Moore and Galuska 20 , Reference Blanck, Gillespie and Kimmons 22 , Reference Li, Serdula and Bland 24 – Reference Diaz, Mainous Iii and Koopman 27 ), although more recent findings suggest otherwise( Reference Demydas 11 , Reference Lutfiyya, Chang and Lipsky 21 ). Several studies have described differences in fruit and vegetable consumption across regions( Reference Serdula, Gillespie and Kettel-Khan 16 , Reference Troost, Rafferty and Luo 28 , Reference Hajjar and Kotchen 29 ), with results indicating more favourable consumption patterns in the West and Northeast compared with the South and Midwest. According to the US Census Bureau( 30 ), the West region includes the Pacific Coast and stretches east to Colorado, where it meets the Midwest and the South. The South stretches from Texas and Oklahoma up to New Jersey, where the Northeast begins. Few studies have explored the interaction between region and race/ethnicity on food consumption and nutrient intake, but those that have suggest region may have a modifying effect on race/ethnicity( Reference Newby, Noel and Grant 17 – Reference Thompson, Demark-Wahnefried and Taylor 19 ). Our objectives in the present work were to: (i) estimate the independent and combined effects of race/ethnicity and region on the variety of fruits and vegetables consumed; and (ii) assess whether and to what extent race/ethnicity and region may synergistically influence variety of fruit and vegetable consumption.
Materials and methods
We used the 2011 Behavioral Risk Factor Surveillance System (BRFSS) for the current analysis. The BRFSS is a telephone survey administered by US state health departments in partnership with the Centers for Disease Control and Prevention. Data are collected on health risk behaviours and preventive health practices of the US civilian population aged ≥18 years. Over 500 000 individuals are interviewed each year, making it the largest telephone-based survey in the world. Random digit dialing is used to select an independent probability sample of residents in each state and trained interviewers administer identical core questionnaires to one adult per household.
Two key changes were made to the 2011 BRFSS sampling design that make this data set particularly attractive for our analysis. A cell phone sampling frame was added to account for the nearly one-third of US households that use a cell phone instead of a landline telephone( 31 ). As racial/ethnic minorities, renters and low-income populations are more likely to live in households with a cell phone instead of a landline telephone, this sampling frame better represents the population of interest in our study compared with BRFSS sampling frames from previous years( Reference Hu, Balluz and Battaglia 32 ). Additionally, the weighting methodology was changed from a post-stratification approach to a raking approach (also known as iterative proportional fitting), where the sample data is weighted to fit the distribution of control variables, making the sample more reflective of sociodemographic characteristics within each state( 31 ).
Fruit and vegetable consumption frequencies were measured by six questions in the BRFSS core module: (i) ‘During the past month, how many times per day, week or month did you drink 100 % PURE fruit juices? Do not include fruit-flavoured drinks with added sugar or fruit juice you made at home and added sugar to. Only include 100 % fruit juice.’ (ii) ‘During the past month, not counting juice, how many times per day, week or month did you eat fruit? Count fresh, frozen or canned fruit.’ (iii) ‘During the past month, how many times per day, week or month did you eat cooked or canned beans, such as refried, baked, black, garbanzo beans, beans in soup, soyabeans, edamame, tofu or lentils? Do NOT include long green beans.’ (iv) ‘During the past month, how many times per day, week or month did you eat dark green vegetables; for example, broccoli or dark leafy greens including romaine, chard, collard greens or spinach?’ (v) ‘During the past month, how many times per day, week or month did you eat orange-coloured vegetables such as sweet potatoes, pumpkin, winter squash or carrots?’ (vi) ‘Not counting what you just told me about, during the past month, about how many times per day, week or month did you eat OTHER vegetables? Examples of other vegetables include tomatoes, tomato juice or V-8 juice, corn, eggplant, peas, lettuce, cabbage and white potatoes that are not fried, such as baked or mashed potatoes?’
An overall fruit and vegetable variety indicator was operationalized as consuming fruit as well as each subgroup of vegetables (beans, dark green vegetables, orange vegetables and other vegetables) ≥1 time/week, informed by the Food Patterns recommendations for vegetable subgroup consumption on a weekly basis in the Dietary Guidelines for Americans 2010 from the US Department of Agriculture( 33 ). Individual vegetable subgroups and fruit consumed ≥1 time/week were also analysed to explore differences in variety of consumption. As the Food Patterns subcategory recommendations are servings-based and tailored to energy intake, adherence to variety recommendations could not be modelled due BRFSS data limitations.
Main predictor variables were race/ethnicity (non-Hispanic white, non-Hispanic black, non-Hispanic other races, Hispanic) and region (South, Midwest, Northeast, West). A total of 504 408 people completed the interviews. Covariates were identified and operationalized according to precedent set by others and included gender, age, education, income, smoking status, BMI and physical activity( Reference Serdula, Gillespie and Kettel-Khan 16 , Reference Troost, Rafferty and Luo 28 ). Physical activity level included occupational and leisure-time physical activity, and was categorized as sufficient (150 min of moderate-intensity or 75 min of vigorous intensity aerobic exercise per week)( 34 ), insufficient (active but not sufficient) and inactive (no occupational or leisure-time physical activity). Respondents omitting information on fruit and vegetable consumption or covariates, in addition to those who reported consuming fruit >16 times/d or vegetables >23 times/d, were excluded( Reference Grimm, Blanck and Scanlon 12 , Reference Serdula, Gillespie and Kettel-Khan 16 , Reference Blanck, Gillespie and Kimmons 22 ) (n 228 544). Persons who responded to all fruit and vegetable questions but reported zero consumption were assigned a frequency of 0·1 times/month to allow for inclusion in the analysis( Reference Serdula, Gillespie and Kettel-Khan 16 ). A total of 275 864 respondents were included in the final sample. Respondents were grouped into four regions (South, Northeast, Midwest, and West) according to the US Census Bureau categorization scheme( 30 ).
Multivariate logistic regression was performed on weighted data to estimate odds ratios after adjusting for covariates. Main effects models predicted the likelihood of consuming fruits and vegetable subcategories at least once weekly independently and in combination for each race/ethnicity and region. Interaction effects models were used to test for the presence and magnitude of interaction effects between race/ethnicity and region on fruit and vegetable variety. The statistical significance of interaction terms was computed in a two-step process. Logistic regression models were used to estimate the odds ratios for interaction terms and a subsequent Wald test was executed to determine whether the odds ratios for the interaction terms within each fruit and vegetable category were significantly different from one another in aggregate. Interaction terms were statistically significant if deemed so by the logistic regression model and the Wald test. Statistical significance was set at P<0·05 and all hypothesis tests were two-tailed. The statistical software package Stata 12 was used to account for the complex sampling design and to calculate weighted effect sizes.
Results
Respondent characteristics
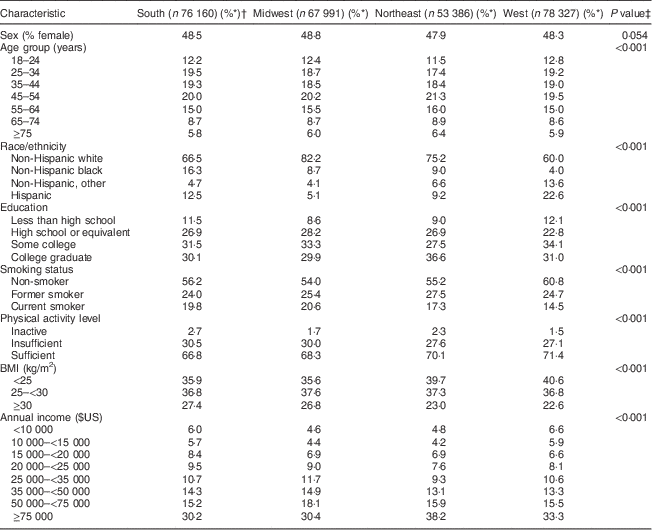
Approximately half of all respondents in each region were female. The age distribution of respondents in each region was similar, with the greatest proportion of respondents aged 45–54 years and the lowest proportion aged ≥75 years (Table 1). Non-Hispanic white respondents represented the majority racial/ethnic group in all regions, but the greatest proportions were found in the Midwest and Northeast. Compared with other regions, a greater proportion of non-Hispanic black respondents were found in the South, and a greater proportion of Hispanic respondents and those reporting other race/ethnicities were located in the West. More than half of respondents in each region reported completing some college, with the highest proportion located in the Northeast. More than half of respondents in each region were non-smokers, with the highest proportion located in the West. At least two-thirds of respondents in each region reported sufficient physical activity levels. The proportion of respondents reporting BMI≥30·0 kg/m2 ranged from nearly 23 % in the West to over 27 % in the South. Within each region, the greatest proportion of respondents reported earning ≥$US 75 000 per annum.
Table 1 Demographic characteristics of respondents by region, Behavioral Risk Factor Surveillance System (BRFSS) 2011
* Percentages are weighted.
† Sample sizes are unweighted.
‡ Inter-regional differences were examined using the two-tailed design-adjusted Pearson χ² statistic.
Prevalence and likelihood of consuming fruit and vegetables at least once weekly
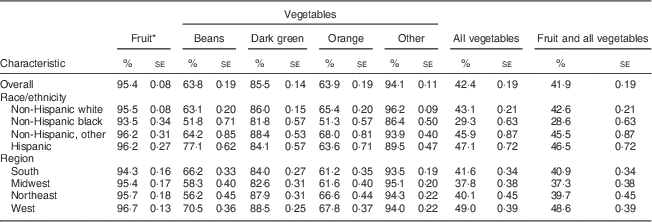
Approximately 42 % of respondents reported consuming fruit and all vegetables ≥1 time/week, with the lowest proportion reported among non-Hispanic blacks (28·6 %) and respondents in the Midwest (37·3 %); similar consumption patterns were observed for consuming all vegetables ≥1 time/week (Table 2). There were no large disparities between races or regions for consuming fruit, other vegetables or dark green vegetables ≥1 time/week. Nearly two-thirds of respondents reported consuming orange vegetables ≥1 time/week, which was similar across all regions and race/ethnicities, except for non-Hispanic blacks. Nearly two-thirds of respondents reported consuming beans ≥1 time/week, which was highest among Hispanics and in the West, and lowest among non-Hispanic blacks and in the Northeast.
Table 2 Percentage of respondents consuming fruit and vegetables at least once weekly by race/ethnicity and region, Behavioral Risk Factor Surveillance System (BRFSS) 2011
All values are statistically significant at the 0·01 level; differences were examined using the two-tailed design-adjusted Pearson χ² statistic.
Design-adjusted df=496 586.
* Whole fruit and/or 100 % fruit juice.
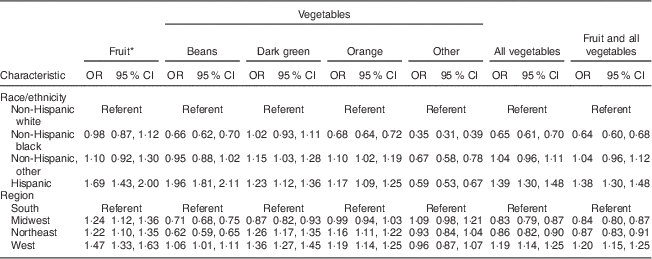
Compared with non-Hispanic white respondents, non-Hispanic black respondents were least likely to consume each category of fruit and vegetables ≥1 time/week except for dark green vegetables, and Hispanics were most likely to consume each category of fruit and vegetables ≥1 time/week except for other vegetables (Table 3). Compared with respondents in the South, respondents in the Midwest were less likely to consume each category of fruits and vegetables ≥1 time/week except for fruit and other vegetables, and respondents in the West were more likely to consume each category of fruits and vegetables ≥1 time/week except for other vegetables.
Table 3 Adjusted odds ratios of respondents consuming fruit and vegetables at least once weekly, Behavioral Risk Factor Surveillance System (BRFSS) 2011
Design-adjusted df=496 586.
Adjusted for gender, age, education, smoking status, physical activity, BMI and income.
* Whole fruit and/or 100 % fruit juice.
Populations with relatively low likelihoods of meeting fruit and vegetable variety indicators can be identified by multiplying race/ethnicity coefficients with region coefficients. This reveals relatively low likelihoods of consuming fruit and all vegetables ≥1 time/week for non-Hispanic blacks in the Midwest (OR: 0·64×0·84=0·54) and non-Hispanic blacks in the Northeast (OR: 0·64×0·87=0·56; Table 3), who were almost 50 % less likely to meet this indicator than non-Hispanic whites in their regions. Non-Hispanic blacks in these regions also had the lowest likelihoods for consuming all vegetables ≥1 time/week and beans ≥1 time/week.
Interaction effect of race/ethnicity and region on consuming fruit and vegetables at least once weekly
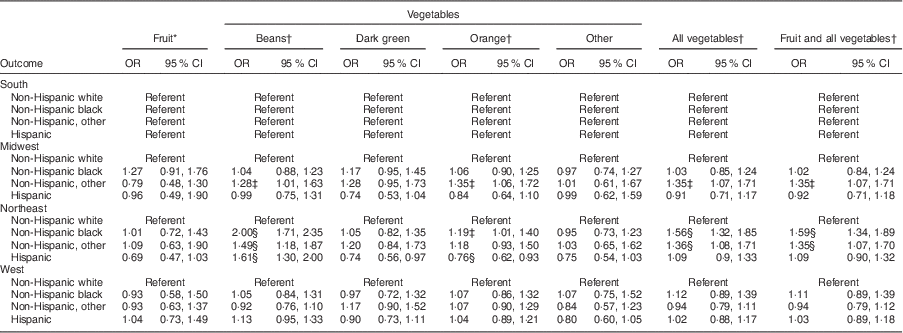
Table 4 displays the odds ratios for race/ethnicity×region interaction terms for each race/ethnicity and region combination. Statistically significant interactions were observed for fruit and all vegetables, all vegetables, beans and orange vegetables. All statistically significant interaction effects were observed in the Northeast and Midwest, with most observed in the Northeast. For consuming beans ≥1 time/week, orange vegetables ≥1 time/week, all vegetables ≥1 time/week, and fruit and all vegetables ≥1 time/week, the relationship between non-Hispanic blacks and non-Hispanic whites in the Northeast was significantly different from the relationship between these race/ethnicities in all other regions.
Table 4 Odds ratios for race/ethnicity×region interaction terms, Behavioral Risk Factor Surveillance System (BRFSS) 2011
Adjusted for gender, age, education, smoking status, physical activity, BMI, income, region and race/ethnicity.
* Whole fruit and/or 100 % fruit juice.
† Race×region interaction term in column jointly statistically significant at the 0·05 level (Wald test).
‡ Race×region interaction term statistically significant at the 0·05 level.
§ Race×region interaction term statistically significant at the 0·01 level.
Examination of intraregional disparities by incorporating interaction effects
The likelihood of meeting variety indicators by region and races within regions, accounting for interaction effects, is displayed in Table 5. Non-Hispanic blacks were ~40 % less likely than non-Hispanic whites to consume fruit and all vegetables ≥1 time/week in the South, Midwest and West (Table 5). There was no difference between non-Hispanic blacks and whites in the Northeast on this indicator, due to a synergistic effect between race/ethnicity and region highlighted in Table 4. A similar pattern was observed for non-Hispanic blacks consuming all vegetables ≥1 time/week.
Table 5 Adjusted odds ratios for respondents consuming fruit and vegetables at least once weekly by region and races within regions, Behavioral Risk Factor Surveillance System (BRFSS) 2011
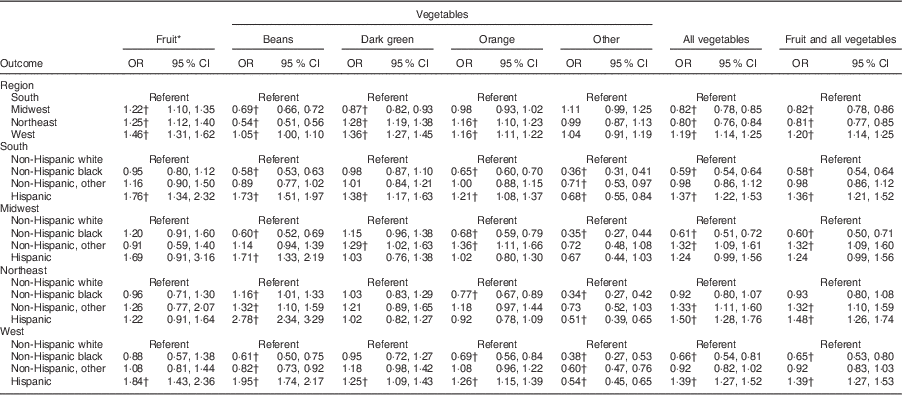
Adjusted for gender, age, education, smoking status, physical activity, BMI, income, race/ethnicity, and race/ethnicity×region
* Whole fruit and/or 100 % fruit juice
† Statistically significant at the 0·05 level.
Non-Hispanic blacks in the South, Midwest and West were ~40 % less likely to consume beans than non-Hispanic whites in these regions (Table 5). However, in the Northeast, non-Hispanic blacks were 16 % more likely to consume beans ≥1 time/week than non-Hispanic whites, due to the positive interaction effect displayed in Table 4. In all regions, Hispanics were more likely to consume beans ≥1 time/week than non-Hispanic whites (Table 5), but the positive interaction effect in the Northeast (Table 4) enhanced this gap.
There was no difference in the likelihood of consuming orange vegetables ≥1 time/week between Hispanics and non-Hispanic whites in the Northeast (Table 5); this was the only example found of a negative interaction (i.e. OR <1·00) between race/ethnicity and region (Table 4). In the South and West, Hispanics were 21 and 26 % more likely, respectively, to consume orange vegetables compared with non-Hispanic whites in these regions (Table 5).
Discussion
The present study provides findings of the prevalence and likelihood of meeting fruit and vegetable variety indicators and elucidates the possible interaction effects between race/ethnicity and region of residence. Using the BRFSS 2011 data, which included a new survey methodology to enhance the representativeness of minority populations, and revised FFQ categories, these data may better reflect potential disparities in fruit and vegetable consumption than prior BRFSS iterations.
The results generated by the study show that a greater proportion of respondents consumed fruit ≥1 time/week and other vegetables ≥1 time/week compared with each of the other fruit and vegetable categories (Table 2). This may be concerning for two reasons. First, nearly 30 % of respondents reported consuming their fruit as juice ≥50 % of the time (data not shown) and nearly 10 % of respondents reported consuming their fruit as juice ≥70 % of the time. Diets that include more fruit juice than whole fruit have been associated with an increased risk of type 2 diabetes( Reference Muraki, Imamura and Manson 35 ), which suggests that the form in which fruit is consumed may be just as important as the amount of fruit that is consumed. Second, our results reinforce previous findings that the variety of vegetable consumption is lacking( Reference Foote, Murphy and Wilkens 9 , Reference Marcoe, Juan and Yamini 36 ). Among all race/ethnic groups, consumption of vegetables is skewed towards other vegetables (which includes starchy vegetables, such as non-fried potatoes), a finding that has also been observed by others( Reference Kimmons, Gillespie and Seymour 13 , Reference Bachman, Reedy and Subar 37 ). Further research should assess which regions and race/ethnicities may require targeted interventions to substitute whole fruit for fruit juice and to increase the variety of vegetable consumption.
Testing the interaction between race/ethnicity and region allows for the identification of synergistic influences between race/ethnicity and region on fruit and vegetable consumption. Hispanics in the Northeast were impacted by an interaction, but in a mixed way. Being Hispanic in the Northeast was associated with a significant synergistic effect on consuming beans ≥1 time/week and a negative effect on consuming orange vegetables ≥1 time/week.
We identify non-Hispanic blacks in the Northeast as the population group that was most affected by the synergistic effect between race/ethnicity and region. Non-Hispanic blacks had the lowest prevalence of consuming fruit and all vegetables at least once weekly. Examining the independent and combined effects of race/ethnicity and region of residence, without accounting for effect modification, highlighted non-Hispanic blacks in the Northeast and Midwest as subpopulations with particularly low likelihoods of consumption. However, being non-Hispanic black in the Northeast was associated with a positive effect on consuming fruit and all vegetables ≥1 time/week (Table 4). Compared with other regions, the Northeast appears to provide conditions that positively influence fruit and vegetable consumption among non-Hispanic blacks. Accounting for synergies between race/ethnicity and region in meeting the variety indicators also adds increased precision in targeting: non-Hispanic blacks in the Midwest may be a critical subpopulation to engage with to increase variety of fruit and vegetable consumption.
Regional and cultural dietary patterns may contribute to the effects of race/ethnicity and region that were observed in the present study. For example, Mahaffey et al.( Reference Mahaffey, Clickner and Jeffries 38 ) found that women living in coastal regions consumed more fish than their non-coastal counterparts and others( Reference Bovell-Benjamin, Dawkins and Pace 39 ) have described the unique diet pattern of blacks in the South. Additionally, dietary acculturation in foreign-born populations may be a factor contributing to observed synergistic effects. Dietary acculturation tends to reduce fruit and vegetable consumption( Reference Dubowitz, Subramanian and Acevedo-Garcia 40 , Reference Ayala, Baquero and Klinger 41 ), although there are differences between racial/ethnic groups and within ethnic subgroups( Reference Ayala, Baquero and Klinger 41 – Reference Lancaster, Watts and Dixon 43 ). As acculturation increases among Hispanic immigrant populations, consumption of legumes and fruit tends to decrease and non-leguminous vegetable consumption increases( Reference Ayala, Baquero and Klinger 41 ). More acculturated Hispanics consume diets similar to non-Hispanic whites( Reference Ayala, Baquero and Klinger 41 ). Far fewer studies document dietary acculturation trends among non-Hispanic black foreign-born populations. Those that do often compare this subpopulation with non-Hispanic blacks born in the USA, who tend to consume less fruit( Reference Lancaster, Watts and Dixon 43 ) and different kinds of vegetables (e.g. more green leafy vegetables and white potatoes, fewer beans and yellow vegetables)( Reference Lancaster, Watts and Dixon 43 ) than foreign-born, non-Hispanic blacks.
US regions are markedly different from one another in the proportion and diversity of their residents who were born outside the USA( Reference Grieco, Trevelyan and Larsen 44 ). New York and New Jersey (located in the Northeast) are the states with the second and third largest percentage of their populations as foreign born, respectively( Reference Grieco, Acosta and de la Cruz 45 ). The Northeast is the most diverse region in terms of its foreign-born residents: no country of origin made up >10 % of the foreign-born population in 2010, unlike other regions( Reference Grieco, Trevelyan and Larsen 44 ). Immigrants from the Dominican Republic and Jamaica were two out of top five immigrant groups in the Northeast, whereas there were no black ethnicities among the top five immigrant groups in other regions( Reference Grieco, Acosta and de la Cruz 45 ).
The dynamics between dietary acculturation in foreign-born populations and the degree of urbanization within the Northeast could explain the synergistic effects observed in the present study. Approximately 80 % of the population in the Northeast is located in urban areas, compared with 66 and 63 % in the South and Midwest, respectively( 46 ). Furthermore, four of the top ten most populous urban areas in the USA are located in the Northeast( 46 ). Residing in ethnic enclaves in densely populated urban centres may mediate dietary acculturation via social and/or food environmental structures. For example, Dubowitz et al.( Reference Dubowitz, Subramanian and Acevedo-Garcia 40 ) observed that the proportion of a neighbourhood that is foreign born was positively associated with individuals’ fruit and vegetable consumption, regardless of whether they were foreign or native to the USA.
Local and community-level food environments in the Northeast may contribute favourably towards individuals’ fruit and vegetable consumption( 47 ). Fruits, vegetables and nuts represent the majority of direct food sales (e.g. farmers’ markets and community-supported agriculture operations) and direct sales are densely concentrated in the Northeast region( Reference Martinez, Hand and Da Pra 48 ). Of the ten states with the highest share of direct food sales out of total food sales, eight are located in the Northeast( Reference Diamond and Soto 49 ). A greater proportion of primary grocery shoppers make food purchases at farmers’ markets in the Northeast compared with other regions, and they are ~40–60 % more likely to purchase fruits and vegetables through direct sales during some parts of the year compared with other regions( Reference Blanck, Thompson and Nebeling 50 ).
The limitations to the present study are several. It is a cross-sectional analysis, which precludes analysis of time trends in disparities in meeting fruit and vegetable consumption outcomes. A cross-sectional approach was necessary due to the novel design of the 2011 BRFSS module and further research is needed to complement this baseline once subsequent BRFSS data are published. The BRFSS is a telephone survey that relies on self-reported data for information, which may over- or under-report particular characteristics or behaviours. The accuracy of dietary surveys relies on respondents’ memory and respondents may adjust their reported consumption patterns to simplify the interview process as well as to impress the interviewer( Reference Roark and Niederhauser 51 , Reference Woodside, Young and McKinley 52 ). Respondents may also differ in how they categorize fruits and vegetables and this may be different between race/ethnic groups( Reference Roark and Niederhauser 51 , Reference Thompson, Willis and Thompson 53 ). The BRFSS also does not capture fruits and vegetables consumed as part of mixed dishes. Additionally, the 2010 Dietary Guidelines( 33 ) provide fruit and vegetable recommendations on the basis of daily servings, whereas the BRFSS captures daily frequencies.
Although the National Health and Nutrition Examination Survey (NHANES) provides dietary data on the basis of mass (which can be converted to servings), NHANES data are not collected at the state level and therefore are not as useful as the BRFSS for estimating regional food consumption patterns. Finally, all published studies validating the FFQ module for BRFSS were completed for versions prior to 2011, although a similar version of the 2011 FFQ was pilot tested in several states and reliability tested in one state (K Grimm, Centers for Disease Control and Prevention, personal communication, 3 April 2013). Further research is needed to assess the validity and reliability of these and other BRFSS modules as a result of the 2011 changes( Reference Pierannunzi, Hu and Balluz 54 ).
Conclusion
The present findings suggest that targeted dietary interventions may be needed for some population groups, such as non-Hispanic blacks in the Midwest. Interventions should focus on increasing consumption of all types of vegetables, particularly orange vegetables and beans. Further research is needed to determine the drivers behind the synergistic effects of race/ethnicity and region in the Northeast and Midwest.
Acknowledgements
Acknowledgements: The authors gratefully acknowledge Robert Houser, PhD and Parke Wilde, PhD for input on statistical analysis. Financial support: This research received no specific grant from any finding agency in the public, commercial or not-for-profit sectors. Conflict of interest: None. Authorship: N.T. conceived the study. N.T. and Z.C. designed the study, conducted statistical analysis and wrote the manuscript. Both authors read and approved the final manuscript. Ethics of human subject participation: Ethical approval was not required.


