India is in the midst of a demographic, epidemiological and nutrition transition. A growing population, increasing urbanisation, a shift in the patterns of diseases and changes in lifestyle characterise this transition(Reference Shetty1). The past decade has seen a dramatic increase in lifestyle-related chronic diseases including obesity, diabetes mellitus, CVD, hypertension, stroke and all cancers(2). In India, CVD, diabetes, cancers, chronic respiratory disease and some other chronic diseases accounted for 53 % of all projected deaths in 2005, and by 2015, the decline in infectious diseases, maternal and perinatal conditions and nutritional deficiencies will be more than matched by the increase in chronic diseases(3).
Behavioural–lifestyle factors, in particular smoking, diet and physical activity, are the major causes of chronic diseases. A diet high in saturated fats and sugars and low in fruit and vegetables has been identified as one of the leading risk factors for chronic diseases(4, 5). These dietary changes are linked to the epidemiological transition and have been dubbed the ‘nutrition transition’, and they appear to affect most developing countries(Reference Popkin, Horton and Kim6). The nutrition transition is characterised by a shift away from a less varied and indigenous diet to a varied diet, composed of more processed foods, more food of animal origin and more fats and sugars(Reference Popkin, Horton and Kim6).
There has not only been a change in the composition of foods, but also a shift in the structure of meals, where foods of non-traditional origin are now consumed to a greater extent(Reference Popkin7). Consumption of carbonated drinks, fast foods and pre-packaged meal has increased rapidly in Latin America, Asia and parts of Europe. In India, studies indicate an increasing consumption of fast foods such as soft drinks among the younger segment of society(Reference Tiwari and Sankhala8).
Urbanisation has been linked to increased Western food consumption in many developing societies. The marked regional differences that exist in India, the variation between urban and rural locations and the role of rural to urban migration in provoking dietary change therefore warrant further study. Thus, the aim of the study was to assess the impact of migration from rural to urban locations on overall food consumption patterns. Data from the Indian Migration Study (IMS)(Reference Lyngdoh, Kinra and Shlomo9) were examined. We hypothesised that there would be differences in food types consumed between rural, urban and migrant groups, with trends of Western foods consumption being higher in urban and migrant groups.
Methods
The Indian Migration Study, part of the larger Cardiovascular Disease Risk Factor Study(Reference Reddy, Prabhakaran and Chaturvedi10), was conducted in Bangalore, Lucknow, Nagpur and Hyderabad, thereby giving a wide geographic coverage of India. Details of the study design and methods have been reported earlier(Reference Lyngdoh, Kinra and Shlomo9). Briefly, to compare the effect of migration on food consumption patterns, rural–urban migrant factory workers and their co-resident spouses along with a rural-dwelling sibling nearest in age were invited to participate in the study. In addition, 25 % of randomly selected non-migrant (urban) factory workers together with their urban-dwelling siblings were recruited into the study. Migration status was attributed only to the ‘first generation’ of migrants who had been living in urban areas for at least a year before being recruited into the study. Thus, the sample comprised three distinct groups – rural, rural-to-urban migrant and urban.
Dietary assessment
Diet was assessed by an interviewer-administered semi-quantitative FFQ. The questionnaire assessed the frequency of intake (daily, weekly, monthly and annually/never) of 184 commonly consumed food items. The questionnaire was formulated using food lists that were developed in each centre by administering single 24 h recalls and asking additional questions about special diets and seasonality of foods. These were streamlined into a 184-item FFQ. Each food item was assigned a standard portion size that was shown to the participants while administering the questionnaire. A nutrient database was also developed for the FFQ by obtaining recipes for each item from participants who volunteered to prepare the recipes under a nutritionist’s supervision; separate recipes were collected for each food item from the rural and urban areas of each of the four centres to prepare region- and rural- or urban-specific nutrient databases.
In order to assess the reliability of the FFQ, a subsample comprising 490 individuals was asked to complete the questionnaire 1–2 months (n 185), as well as 12 months (n 305) after completion of the questionnaire during the original period of data collection. These two sub-samples were randomly selected and were independent of each other. Cohen’s κ-statistic was used to compare participants’ tertile grouping across any two FFQ administrations. In addition, intraclass correlation coefficients were also calculated. The short-term (1–2 months) reliability of the FFQ was better than the long-term (1 year) reliability, with κ-statistics ranging from 0·40 (energy) to 0·69 (egg) for the former, and from 0·26 (green leafy vegetables) to 0·71 (fish) for the latter. The reproducibility of this FFQ is fairly comparable to, if not slightly better than, other Indian reproducibility studies(Reference Sudha, Radhika and Sathya11, Reference Hebert, Gupta and Mehta12).
The validation of the IMS FFQ was performed using two methods. One method assessed the physiological plausibility of the reported consumption by using FAO/WHO/United Nations University age- and sex-specific BMR equations. Approximately 30 % of participants were found to report non-plausible intakes, with there being more over- than under-reporters; however, this did not alter the migration effects observed in the study.
In addition to the above, a validation study was also conducted, in which 418 subjects were administered a reference method of three 24 h recalls. Participants’ tertile grouping in the FFQ and 24 h recalls were compared using Cohen’s κ-statistic. Pearson correlation coefficients and Spearman’s rank correlation coefficients were also calculated. All κ-statistics were >0·4. In general, the validation study showed higher reported intakes of nutrients in the FFQ relative to the 24 h recalls, with energy, macronutrients (with the exception of fat), legumes, cereals and dairy showing the most favourable validity, and spices, tea and coffee showing the least favourable validity. These results are comparable with other Indian FFQ–24 h recall validations, most of which have shown an overestimation of consumption using FFQ relative to recalls and diaries(Reference Sudha, Radhika and Sathya11, Reference Hebert, Gupta and Mehta12).
Statistical analyses
Frequency distributions of the 184 food items were examined for the entire sample by sex, age groups, study sites and migration status. Frequently consumed foods (i.e. daily or weekly) were identified and were the focus for further analyses. Chi-square tests were performed to assess significant differences across frequency of intake by sex, age groups, study sites and migration status. The effect of migration status on food consumption patterns was further analysed after adjusting for age and sex using binary logistic regression. Statistical Package for Social Sciences statistical software package version 16·0 (SPSS Inc., Chicago, IL, USA) was used to perform all analyses.
Results
Sample characteristics
Of the 7049 participants enrolled in our study, 41·6 % were female. Mean age was 40·82 (sd 10·36) years and over 90 % of the sample could at least read and write. Of the total sample, 88·8 % and 75·5 % respondents had attended at least primary- and secondary-level schooling, respectively. Socio-economic status was measured using a composite standard of living index (SLI) that consisted of fourteen questions on household characteristics and possessions, taken from a larger set of thirty questions in the National Family Health Survey (NFHS)(13). Mean values of the IMS SLI, when projected to the NFHS-2 SLI categories, showed the sample to fall in the high SLI range. Sample characteristics are shown in Table 1.
Table 1 Sample characteristics

SLI, standard of living index; NFHS, National Family Health Survey.
*Values show basic literacy of respondents (can at least read and write).
†NFHS-2 SLI categories: low (0–14), medium (15–24) and high (25–67).
Although participants from Nagpur had a lower age (mean age was 29·5 (sd 6·43) years) than those from other places, when classified by place of origin, rural (n 2620, 39·84 years), rural-to-urban migrant (n 2120, 42·30 years) and urban (n 2309, 40·58 years) groups had similar ages. Participants from rural areas were found to have higher levels of illiteracy, a lower mean SLI and a lower proportion of them were married. Most migrants had spent a considerable time in the urban environment (median: 26 (range 1–55) years for men and 21 (range <1–49) years for women) with 9·3 % (95 % CI 7·6, 11·0) of men and 21·3 % (95 % CI 18·7, 23·9) of women spending ≤10 years in the urban areas. In addition, most of the migrants (81 % men and 87 % women) came from within the states they had migrated to.
Food consumption patterns
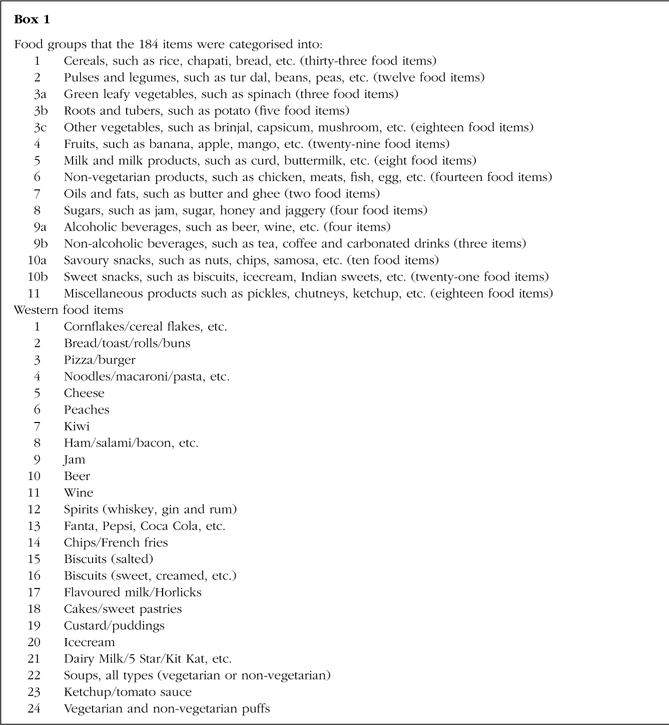
The 184 food items were classified into eleven food categories/groups that have been listed in
Box 1.
Box 1
Food items consumed on a daily basis
Out of 184 food items, thirteen were identified as being eaten most commonly (mode) on a daily basis (relative to weekly, monthly and annually/never basis), in at least one study site. These were tandoori roti/phulka/wheat phulka, plain rice, plain ragi ball (cereals), plain tur dal sambar/dal, tur dal sambar/dal with vegetables (pulses), potato, curd, plain milk, buttermilk, ghee (a traditional Indian saturated fat), sugar, tea and coffee.
Preliminary analysis found significant differences in the proportion of individuals consuming these foods across the four study sites. Tandoori roti was consumed on a daily basis predominantly in Lucknow and Nagpur, whereas plain rice was consumed daily by >90 % of the individuals in Nagpur, Hyderabad and Bangalore. The proportion of individuals consuming potato, milk and ghee on a daily basis was highest in Lucknow; that consuming plain tur dal, sugar and tea daily was highest in Nagpur; that consuming curd daily was highest in Hyderabad; and that consuming plain ragi ball, tur dal with vegetables, buttermilk and coffee daily was highest in Bangalore (P ≤ 0·001; data not shown). Differences were also seen in the daily consumption of these food items with age and sex (data not presented).
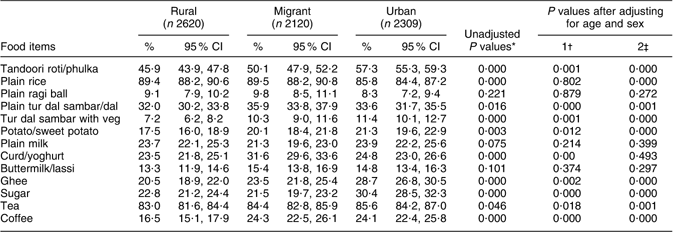
Table 2 shows comparisons between the rural, migrant and urban groups for these thirteen food items. Significant differences in food consumption patterns between these three groups were observed even after adjusting for age and sex. The most common pattern was one of an increasing proportion of individuals consuming tandoori roti/phulka/wheat phulka, tur dal sambar/dal with vegetables, potato/sweet potato, tea and ghee on a daily basis from the rural to migrant to urban groups. Another pattern observed was where the migrant group had the maximum proportion of individuals consuming plain tur dal sambar/dal and coffee followed by the urban group, and then the rural group. For plain ragi ball, plain milk and buttermilk/lassi consumption, no significant variation between groups was found.
Table 2 Proportion of individuals consuming the following food items on a daily basis by rural, migrant and urban groups
*Chi-square test.
†P value for difference in the proportions of migrant individuals consuming a food item compared with rural individuals, using binary logistic regression.
‡P value for difference in the proportions of urban individuals consuming a food item compared with rural individuals, using binary logistic regression.
Consumption of ‘Western’ food items
Western food items (see Box 1) were not commonly eaten. Cornflakes, pizza, ham, wine, cheese, custard, peaches and kiwi were consumed very infrequently (i.e. annually or never) by a majority of the participants on a weekly basis across all groups. The daily consumption of the other Western food items was minimal but their weekly consumption – typically once or twice a week – was appreciable and forms the basis of further analysis.
Bread/toast/rolls/buns and biscuits (sweet and salted) were consumed by ≥30 % of participants. Noodles/macaroni/pasta, puffs, cakes/sweet pastries, ice cream, chocolates, flavoured milk, alcoholic spirits, beer, jam, ketchup and soups were consumed by ≤10 % of participants on a weekly basis. Between 10 % and 30 % of participants reported weekly consumption of chips/French fries and carbonated drinks. It must be noted that the weekly consumption of these foods was restricted to just once or twice a week.
Western food consumption was most predominant in Bangalore, with the proportion of individuals consuming noodles, chips, cakes, soups, puffs, jam and flavoured milk being highest there (P ≤ 0·01). The consumption of carbonated drinks, beer and spirits was most common in Hyderabad, that of bread, chocolates and salted biscuits was most common in Nagpur and that of ketchup and sweet biscuits was most common in Lucknow (P ≤ 001; data not shown). A greater proportion of women than men consumed noodles, bread, ketchup and jam and a greater proportion of men than women consumed biscuits (sweet), spirits, beer and carbonated drinks (data not shown). In terms of age, the predominant trend was of a decrease in the proportion of individuals consuming Western foods on a weekly basis with increasing age (Fig. 1). The proportion of men consuming alcoholic spirits increased steadily from the lowest to the highest age groups (P = 0·000).
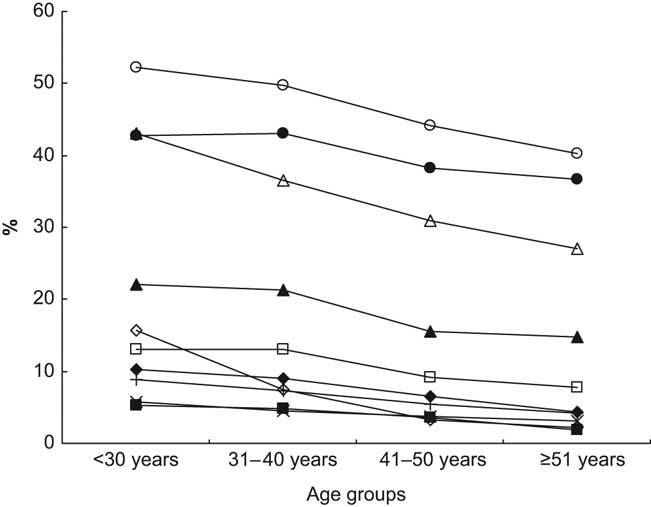
Fig. 1 Proportion of individuals in the ≤ 30, 31–40, 41–50 and ≥51 years age groups consuming Western foods (○, sweet biscuits; ●, salted biscuits; ▵, bread; ▴, chips; □, carbonated drinks; ▪, noodles; ×, cakes; +, ice cream; ![]() , puffs;
, puffs; ![]() , chocolates) on a weekly basis, in the cities of Lucknow, Nagpur, Hyderabad and Bangalore, in India. Chi-square tests showed age group differences to be significant (P ≤ 0.05) for all these food items
, chocolates) on a weekly basis, in the cities of Lucknow, Nagpur, Hyderabad and Bangalore, in India. Chi-square tests showed age group differences to be significant (P ≤ 0.05) for all these food items
There was a clear trend in the consumption patterns of most Western foods across the rural, migrant and urban samples, as illustrated in Fig. 2. The proportion of people reporting weekly consumption of Western foods including noodles, bread/toast, chips, soups, ketchup, vegetarian and non-vegetarian puffs, jam, cakes/sweet pastries, ice cream and biscuits (sweet) was highest in the urban sample, lowest in the rural sample and intermediate in the migrant sample. Adjusting for age and sex did not alter this trend, with the exception of ice cream and cakes where adjustment attenuated the association (Table 3).
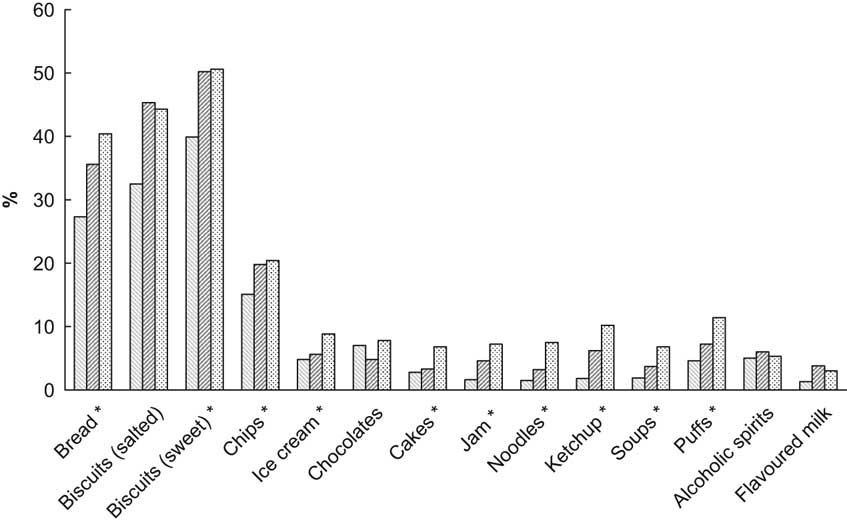
Fig. 2 Proportion of individuals of varying migration status (![]() , rural;
, rural; ![]() , rural-to-urban migrant;
, rural-to-urban migrant; ![]() , urban) consuming Western foods on a weekly basis, in the cities of Lucknow, Nagpur, Hyderabad and Bangalore, in India. Binary logistic regression showed differences among the three groups to be significant (P ≤ 0.05) for all these food items, after adjusting for age and sex. The predominant pattern was one of an increasing proportion of individuals consuming a Western food from the rural to the migrant to the urban groups. Food items marked with * follow this trend
, urban) consuming Western foods on a weekly basis, in the cities of Lucknow, Nagpur, Hyderabad and Bangalore, in India. Binary logistic regression showed differences among the three groups to be significant (P ≤ 0.05) for all these food items, after adjusting for age and sex. The predominant pattern was one of an increasing proportion of individuals consuming a Western food from the rural to the migrant to the urban groups. Food items marked with * follow this trend
Table 3 Proportion of individuals consuming Western food items on a weekly basis by rural, migrant and urban groups
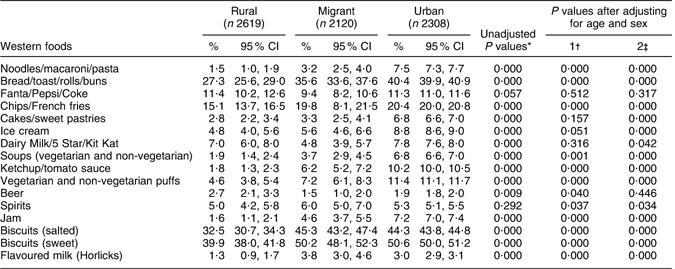
*Chi-square test.
†P value for difference in the proportions of migrant individuals consuming a food item compared with rural individuals, using binary logistic regression.
‡P value for difference in the proportions of urban individuals consuming a food item compared with rural individuals, using binary logistic regression.
There were a few exceptions to this general pattern. For instance, salted biscuits and flavoured milk were consumed at similar levels in both the migrant and urban groups but to a lower extent in the rural group (P = 0·000 after adjusting for age and sex). There were no significant differences in the weekly consumption of carbonated drinks across groups.
Discussion
We found that traditional foods were consumed by the highest proportion of men and women of all ages and migration backgrounds. In this sample, Western foods were seldom eaten every day, were typically consumed weekly by <30 % of people and were more commonly eaten (highest proportion) by urban and migrant groups than the rural groups, as well as by the younger rather than older individuals. Our findings are in line with trends found in other populations, showing that older people consume traditional foods to a greater extent than younger people(Reference Sharma, Cade and Griffiths14, Reference Osler, Andreasen and Heitmann15). The consumption of carbonated drinks, alcoholic spirits and beer was more common among men than women, confirming previous studies(Reference Yadav and Kumar16, Reference Bhopal, Unwin and White17). Other Indian studies(Reference Tiwari and Sankhala8) have shown a similar trend in food consumption with results indicating a predominantly weekly intake of Western foods like bread, biscuits, chocolate, soft drinks and ice creams.
The changes that occur in the traditional food intake of the migrants have been documented by studies comparing diets of migrant populations to those of the native populations. An increase in the consumption of Western foods and a decrease in the intake of traditional foods was found in South Asians in the United Kingdom(Reference Kassam-Khamis, Judd and Thomas18) and Pakistani children in the United Kingdom(Reference Heald, Sharma and Anderson19) compared to their counterparts at their places of origin. The effects of rural to urban migration on diet have also been documented. For instance Torun et al.(Reference Torun, Stein and Schroeder20) found that individuals who had migrated to or commuted for work to Guatemala city consumed more red meat and sweetened beverages than their rural counterparts.
According to Popkin(Reference Popkin21), one of the most profound characteristics of the nutrition transition, particularly in developing countries, is that rapid urbanisation is strongly associated with the shifts in diet and physical activity that characterise it. As theorised, it is likely that continuing and increasing media influences and higher penetration of marketing activities in urban areas, better transportation in urban areas leading to greater availability of food items, different occupational patterns that make home food preparation more difficult in urban areas, changes in the local food environment with increasing globalisation and increased purchasing power among urban populations may lead to substantial increases in consumption of Western foods among people living in and migrating into urban areas.
Our results are in line with the above literature, showing that more people in urban and migrant settings consume Western foods relative to those in rural areas. However, the extent of Western food consumption in this sample was limited, with little penetration of Western food types into the daily eating habits of urban and migrant individuals, living in major cities in India.
Limitations and strengths of the study
In order to draw reliable conclusions on food intake patterns, we decided to restrict our analysis to foods being consumed at least weekly as such consumption is likely to have direct health implications. Moreover, it is likely that the reliability of FFQ data will be greater for more recent recall.
We used FFQ rather than 24 h recalls or diary methods of dietary assessment as our samples included migrants who had often travelled for over 24 h to the survey site resulting in acute changes in their habitual dietary habits. The FFQ we used was designed for the project as it had to cover four cities representing three geographic areas of India; our repeatability and validation studies indicate that the FFQ had acceptable measurement properties and was suitable for the purpose of comparing consumption of food types between groups. Use of any questionnaire methodology for eliciting information on food consumption is prone to recall and acquiescence bias. The latter may lead to under-reporting of the intake of certain food items, such as alcoholic drinks and non-vegetarian food, due to the stigma attached with their consumption in India.
One of the strengths of the present study is the large and diverse sample size. Despite this, we cannot conclude that they were representative of the general Indian population and hence the findings must be interpreted with caution.
Implications of the study and directions for future research
Our findings have important implications, the most important being that traditional diets are still very commonly consumed, and therefore their role in the current obesity epidemic in India needs to be explored. The prevalence of overweight (BMI = 25–29·9 kg/m2) in this sample was 28·9 %, and that of obesity (BMI ≥ 30 kg/m2) was 8·7 %. The consumption of Western foods in this sample is too infrequent to make such an impact on a population level, although this could change among younger cohorts in the coming years.
Further studies investigating the role of traditional foods in chronic diseases are warranted. In addition, the impact of factors such as education, socio-economic status, television viewing, religious and cultural beliefs, etc. on individuals’ acceptance of or resistance to Western foods needs to be studied.
If the findings from the present study are corroborated by other nationally representative samples, then the dietary health promotion campaigns in India would need to include the traditional Indian diet. Dietary health promotion should target urban and migrant groups and be part of a comprehensive policy to reduce the availability, promotion and ease of accessibility of both traditional and Western unhealthy foods.
Conclusions
The daily diet of participants was predominantly traditional and Western food items were not eaten very frequently. The role of the traditional Indian diet as a source of excess energy contributing to the Indian obesity epidemic needs to be explored in more detail. Health promotion efforts should target traditional as well as Western foods.
Acknowledgements
The present study was supported by the Wellcome Trust project grant GR070797MF. The authors have no conflict of interest to declare. S.E., D.P., K.S.R. and L.B. designed the study; A.S., N.K., D.B. and S.E. helped the result analysis, interpretation and drafting of the manuscript; all authors are responsible for final editing and approval of the manuscript.


