Public health professionals and clinicians continue to see the benefits of fruit and vegetable intake for maintaining health. Current recommendations call for increased servings of fruits and vegetables per day and decreased fats1. Over the past decades, focus has centred on health education as the primary mechanism to influence people’s dietary decisions. More recently, however, an appreciation for the contextual influence of the built environment has gained attention and its influence on dietary patterns has been investigated. Researchers have documented racial and economic disparities in the types of food store available by neighbourhood typeReference Morland, Wing, Diez Roux and Poole2, Reference Zenk, Schultz, Israel, James, Bao and Wilson3 and the availability of certain types of food store has been shown to be associated with residents’ dietsReference Morland, Wing and Diez Roux4, Reference Laraia, Siega-Riz, Kaufman and Jones5. Other researchers have documented that food items sold in stores vary by neighbourhood typeReference Horowitz, Colson, Hebert and Lancaster6, Reference Sloan, Diamant, Lewis, Yancey, Flynn and Nascimento7 and the availability of specific food types predicts consumption by residentsReference Zenk, Schultz, Hollis-Neely, Campbell, Holmes and Watkins8–Reference Cheadle, Psaty, Curry, Wagner, Diehr and Koepsell15. More recently, investigators have shown that the availability of food store types is associated with obesity among residentsReference Morland, Diez Roux and Wing16, Reference Sturm and Datar17. Fewer studies have investigated the accessibility of recommended foods by store type. When evaluating stores in San Diego, California, more than two decades ago, Sallis et al. documented that a greater number of heart-healthy foods were more likely to be located in supermarketsReference Sallis, Nadar and Atkins18.
Encouragingly, public health professionals are beginning to take a closer look at the influence of built environments on health, particularly the effects of the local food environment. Despite this increased attention, evidence-based characterisations of neighbourhoods and food store types are still needed in order to properly evaluate and intervene at this level. Therefore, because (1) research suggests that Americans eat a limited variety of fruits and vegetablesReference Putnam, Allshouse and Kantor19 and (2) consumption of these foods is widely recommended for the prevention of a number of diseases1, 20, we aimed to evaluate the availability and variety of produce in four types of food store (supermarkets, small grocery stores, delicatessens, and fruit and vegetable markets) by neighbourhood racial segregation. Using extensive Geographic Information System techniques, we examined two racially and economically diverse neighbourhoods located in Brooklyn, New York.
Methods
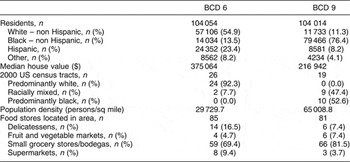
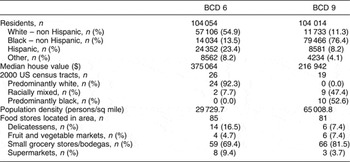
The names and addresses of all of the food stores located in two Brooklyn Community Districts (BCDs) were obtained from the New York State Department of Agriculture and Markets (NYSDAM) in 2004. BCDs are New York City Regional Planning defined borders and usually include several neighbourhoods. At the time of the study, BCD 6 included Carroll Gardens, Cobble Hill, Park Slope, Gowanus and Red Hook neighbourhoods, while BCD 9 included Crown Heights South, Prospect Lefferts Gardens and Wingate neighbourhoods. The BCDs selected for this study were based on the diversity of racial demographics among the residents of these areas (Table 1).
Table 1 Characteristics of Brooklyn Community Districts (BCDs)
Methods for food store surveys
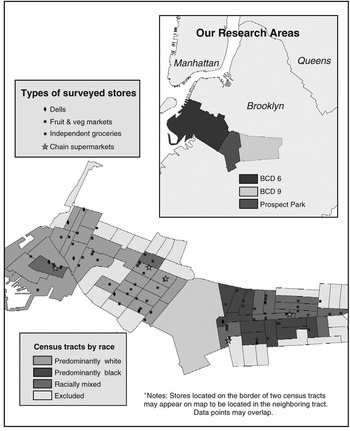
Fifty per cent of all of the supermarkets, small grocery stores, delis, and fruit and vegetable markets were randomly sampled by BCD and surveyed between September 2004 and July 2005 (Fig. 1). The types of food stores were determined based on the names of the businesses. Some food stores were not evaluated due to limited resources and because it was assumed that fruits and vegetables would not be sold at these locations. These types of food stores included convenience stores with gas stations (n = 9), pharmacies (n = 9) and speciality foods stores (other than fruit and vegetable markets) (n = 56). Businesses were also excluded when the type of industry could not be determined (n = 63). As a result, a total of 166 stores (20 delis, 10 fruit and vegetable markets, 125 small grocery stores and 11 supermarkets) remained, from which a 50% stratified (based on BCD and food store type) random sample was used to determine the stores surveyed. In addition, independently owned grocery stores were distinguished from chain supermarketsReference Morland, Wing, Diez Roux and Poole2. Store types were surveyed in each BCD at similar times to control for the effect seasonality might have had on the availability of fresh produce. The types of food stores surveyed by BCD are shown in Table 1.
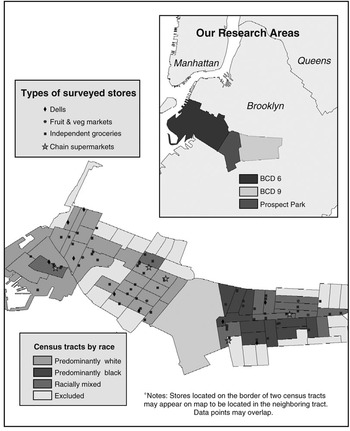
Fig. 1 Map of surveyed stores (BCD – Brooklyn Community District)
One trained surveyor collected all of the data using Pendragon software loaded onto a Palm Pilot® (Pendragon Software Corporation; version 3.2, 1998–2001). Five sampled stores had closed and another store of that type in the same BCD was selected from the NYSDAM list to be surveyed.
A comprehensive evaluation of the fresh produce available in each food store was conducted on 18 types of fruit (apples, apricots, avocados, bananas, berries, cherries, grapefruit, lemons, limes, mangoes, melons, nectarines, oranges, peaches, pears, pineapple, plums and tomatoes) and 21 types of vegetables (asparagus, beets, broccoli, Brussels sprouts, carrots, cauliflower, celery, corn, cucumber, eggplant, green beans, leafy greens, mushrooms, okra, peppers, potatoes, peas, squash, yams, yucca and zucchini). Although other researchers have surveyed selected food items based on a disease of interestReference Horowitz, Colson, Hebert and Lancaster6, Reference Sloan, Diamant, Lewis, Yancey, Flynn and Nascimento7, the hypothesis for this study asserts that the availability and variety of fruits and vegetables is predicted by the availability of supermarkets, which are not equally accessible to all neighbourhoodsReference Morland, Wing, Diez Roux and Poole2, Reference Zenk, Schultz, Israel, James, Bao and Wilson3. Moreover, we developed the list of fruits and vegetables to be surveyed based on chain supermarkets that are known for having great varieties of high-quality produce, including Whole Foods® and Garden of Eden® (a local chain in New York City). Stores were surveyed for the availability of organic produce as well. Finally, in addition to evaluating fresh produce, we collected the availability of canned produce (corn, green beans, legumes, mushrooms, spinach, tomatoes, citrus, fruit cocktail and peaches) and frozen produce (broccoli, carrots, corn, green beans, peas, berries and peaches), as well as pre-packaged fresh produce, which we refer to as prepared produce (carrots, celery, cauliflower, mixed veg, pre-washed greens, mango, melons, papaya and pineapple).
Defining neighbourhood racial segregation
The unit of analysis was census tracts and the 2000 US Census data were used to determine the proportion of total residents that were black Americans. There were a total of 68 census tracts located in the two BCDs (BCD 6, n = 38; BCD 9, n = 30). Census tracts that shared two BCDs (n = 21), as well as census tracts where the population was zero (n = 2), were excluded. This approach left 26 census tracts in BCD 6 and 19 in BCD 9 in these analyses. The following categories of neighbourhood racial segregation were created: predominantly black (n = 10, greater than 80% black American); predominantly white (n = 24, less than 20% black American) and racially mixed (n = 11, 20–80% black American). Food store addresses were geo-coded to census tracts using ARCGIS9 (ESRI, 1999–2004).
Statistical analysis
Because dependent variables were expressed as count data, Poisson regression was used to evaluate the relationship between the number of stores (dependent variable) and neighbourhood racial segregation (independent variables). The Poisson models were not overdispersed. Separate models were created for each food store type (supermarkets, grocery stores, delis, and fruit and vegetable markets). Because the number of food stores tended to be higher in more densely populated areas, a linear term for population density (persons/sq mile) was included in the models. In addition, a linear term for median house value was included in all models to control for neighbourhood wealth. Prevalence of food stores (number of food stores/number of census tracts), adjusted prevalence ratios (PR) and standard errors (SE) were calculated from regression coefficients where predominantly white census tracts were used as the reference. All statistics were calculated using SAS GENMOD procedure version 9.1 (SAS Institute Inc., 2001).
Results
Characteristics of the BCDs are found in Table 1. Although the total population of the two areas was quite similar, BCD 9 was predominantly black (76.4%), whereas BCD 6 was white (54.5%) and Hispanic (23.4%). The wealth and density of the areas were also different. BCD 6 was a wealthier area, but the population density of BCD 9 was over twice that of BCD 6. A total of 45 census tracts located in these areas met our eligibility requirements for inclusion in the analyses and 58% (n = 26) of these tracts were located in BCD 6, where 92% (n = 24) of those census tracts were defined as ‘predominantly white’. Small independently owned grocery stores, which are often referred to as ‘bodegas’ in New York City, made up the greatest proportion of food stores in both districts (BCD 6, 69.4%; BCD 9, 81.5%). The presence of supermarkets relative to the presence of other stores was lowest in BCD 9 (3.7%).
The prevalence of food stores by neighbourhood racial segregation is presented in Table 2. A supermarket was located in approximately every third census tract in predominantly white areas (prevalence = 0.33) compared with every fourth census tract in racially mixed areas (prevalence = 0.27). There were no supermarkets located in the predominantly black areas. The prevalence of grocery stores/bodegas was lower in predominantly white (PR = 0.97, SE = 1.38) and racially mixed (PR = 0.58, SE = 1.29) areas after adjustment for population density and neighbourhood wealth, but delis were most likely to be located in white areas (PR = 3.31, SE = 2.39) than in the black and mixed neighbourhoods. The greatest proportion of food stores in all areas was bodegas. This type of food store accounted for 89% of the food stores in predominantly black areas, 79% of the food stores in racially mixed neighbourhoods, and 67% of the food stores in predominantly white areas.
Table 2 Adjusted average number of food stores per census tract by neighbourhood racial segregation*

N – number of stores; P – average number of food stores per census tract; SE – standard error; ref. – reference category; ~ indicates not calculated due to no supermarkets.
* Adjusted for population density and median house value.
Availability of fresh produce by neighbourhood racial segregation
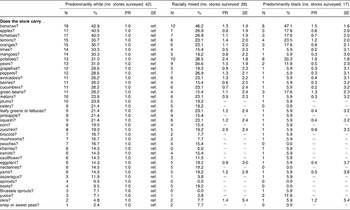
The proportion of food store types that carried each type of fruit and vegetable by neighbourhood racial segregation is found in Table 3. Overall, 21–43% of the stores surveyed carried at least 50% of the types of produce surveyed. However, 64% (n = 25) of all fresh produce surveyed had a higher presence in predominantly white area stores, compared with 31% (n = 12) in racially mixed areas and 5% (n = 2) in predominantly black areas.
Table 3 Fresh fruits and vegetables by neighbourhood racial segregation
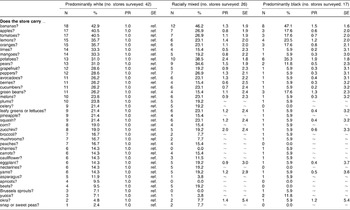
N – number of stores carrying the item; PR – prevalence ratio; SE – standard error; ref. – reference category; ~ indicates model did not converge.
In terms of specific items, more than 40% of food stores in all three types of neighbourhood carried bananas. In addition, apples and tomatoes were carried by over 40% of the food stores surveyed in the predominantly white areas, while less than 5% of the stores located in these areas carried okra or peas.
The presence of most types of fruits and vegetables was less common in predominantly black compared with predominantly white areas. All types of fresh fruits and vegetables surveyed were found in at least one food store located in predominantly white areas, whereas 15% (n = 6) were not available at all in predominantly black area stores (peaches, nectarines, apricots, snap peas, beets and celery). Furthermore, 62% (n = 24) of produce types surveyed were carried by only one store in predominantly black areas, while in white neighbourhoods only 15% of surveyed items were found in fewer than five stores.
With the exception of bananas, potatoes, okra and yucca, all other types of fresh fruits and vegetables (90%) were found in a lower proportion of predominantly black area stores compared with stores in predominantly white areas. Adjustment for population density and neighbourhood wealth resulted in a higher prevalence of stores with lemons and green beans in these areas as well; however, standard errors were large or could not be calculated due to sparse data in some cases. In addition, only two types of produce (bananas and yucca) were more present in black areas compared with both white and racially mixed area stores.
Conversely, all but three types of fruits and vegetables surveyed were available in at least one of the racially mixed area stores. Compared with the predominantly white areas, the proportion of stores that carried specific fruits and vegetables was greater in racially mixed areas for only 12 (31%) of the 39 types of produce surveyed. Once adjustments for population density and neighbourhood wealth were made, 46% of the types of produce were more prevalent in racially mixed than in predominantly white area stores, but again, standard errors were large and could not be calculated in some cases due to sparse data.
Availability of canned, frozen and prepared fruits and vegetables by neighbourhood racial segregation
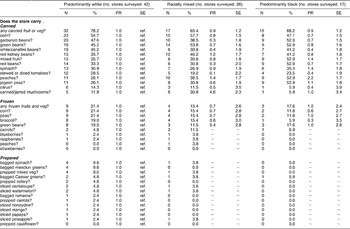
In addition to the availability of fresh produce, stores were also surveyed for the availability of canned, frozen and prepared fruits and vegetables (Table 4). Compared with the availability of fresh produce (less than half of the stores in these areas carried fresh produce), a larger proportion of the stores in all areas carried canned produce: predominantly white, 76%; racially mixed, 65%; predominantly black, 88%. Compared with stores in black areas, more stores located in predominantly white and racially mixed areas carried canned corn, citrus, green beans, white beans, kidney beans, stewed or diced tomatoes, and mushrooms. However, canned red beans, garbanzo beans, pigeon peas, spinach, mixed fruit and peaches were found in more stores in predominantly black areas.
Table 4 Canned, frozen and prepared fruits and vegetables by neighbourhood type
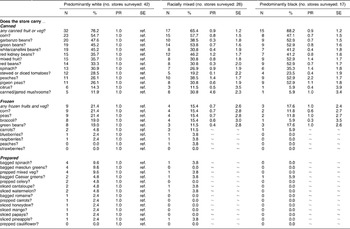
N – number of stores carrying the item; PR – prevalence ratio; SE – standard error; ref. – reference category; ~ indicates model did not converge.
Note: PR and SE adjusted for population density and neighbourhood wealth.
Only 56% of the frozen fruits and vegetables surveyed were found in at least one food store located in predominantly black areas compared with 78% in predominantly white and 89% in racially mixed areas. As well, the prevalence of frozen produce was lower than that of canned produce in all three types of neighbourhood: 21% (n = 9) of stores in white areas; 15% (n = 4) in racially mixed areas; and 18% (n = 3) in black areas.
Compared with canned and frozen produce, prepared fruits and vegetables were not as prevalent in any of the neighbourhoods (Table 4). In predominantly black areas, only one store sold one type of the prepared produce surveyed; no other type of prepared fresh produce was available in black neighbourhoods. Conversely, nearly all prepared fresh produce surveyed was available in predominantly white area stores, although the prevalence of food stores offering these items was low, and less than half of all of the varieties were available in racially mixed areas. Finally, organic produce was available exclusively in predominantly white areas stores, where 46% (n = 18) of surveyed varieties were found in one to four stores: apples, tomatoes, potatoes, bananas, berries, oranges, peppers, cucumbers, grapes, green beans, leafy greens, melons, mushrooms, nectarines, peaches, pears, plums and squash (data not shown).
Availability of fresh produce by neighbourhood racial segregation and food store type
In white neighbourhoods, 76% of supermarkets carried 75–100% of fruits and vegetables surveyed compared with 51% in racially mixed neighbourhoods. A greater proportion of supermarkets in both areas carried all types of fruits and vegetables compared with small grocery stores and delis. With the exception of potatoes and bananas, a greater proportion of grocery stores located in white areas carried all types of produce and grocery stores were more likely to carry most types of produce than delis in all areas. Although 85% of fruits and vegetables surveyed could be found in at least one predominantly black area grocery store, three-quarters (77%) of these types of produce were limited to one of the 15 bodegas in the area (data not shown).
Discussion
These data demonstrate that the availability and variety of fresh produce is associated with the racial composition of neighbourhoods, where a greater number of stores in white areas carry fresh produce than in other racially segregated areas. Moreover, the availability and varieties of fresh produce carried in supermarkets is greater compared with the other types of food store surveyed.
Additionally, canned produce is present in a larger proportion of stores in black areas than in other areas. However, it is worth noting that while canned produce is a recognised source of nutrients, added sodium and sugar in canned produce may make frozen produce preferable. The presence of frozen produce was lower in all three types of neighbourhood compared with the presence of canned produce, but frozen produce was less available in black neighbourhoods than in white.
These findings may be influenced by the following limitations. First, our ability to control for other neighbourhood characteristics, such as neighbourhood wealth, was limited in many models due to sparse data. The sparse data in many analyses were due to the small number of stores in black areas that carried the fruit or vegetable of interest. Second, we used the NYSDAM 2004 list of food stores from which to draw our sample. If the food environment changed between the time when New York State developed the list and we conducted our surveys, our study may be influenced by sampling error. Third, we coded types of food stores to be sampled based on the names of the stores. Food stores that could not be coded based on this method were excluded. Some of these food stores may have sold produce; however, similar proportions of these ‘unknown’ types of food stores were excluded from both BCDs. Similarly, other places excluded (such as pharmacies, gas stations and speciality stores) may have sold some produce, which would result in an underestimate of the prevalence of produce availability. However, these stores were excluded in both BCDs in similar proportions, and therefore no differential bias is expected in our results. Finally, small grocery stores and delis may have been misclassified in the event that the names of the businesses did not reflect that food was sold on the premises; however, any misclassification is expected to be non-differential between BCDs, and chain supermarkets were unlikely to be misclassified because of brand typing in New York City.
In total, five stores had closed in BCDs 6 and 9 since the NYSDAM generated the data used for this study. The closed stores were two delis, one independently owned grocery store, and two fruit and vegetable markets. One of the closed fruit and vegetable markets was in a predominantly black census tract; the rest of the stores were in white or racially mixed neighbourhoods. No supermarket had closed in either BCD. However, it can be assumed that new food stores opened since the NYSDAM data, but their number is unknown.
Unfortunately, the contextual factors associated with changes in the food environment in this analysis remain unknown. Yet, the facts that (1) there were no supermarkets located in the predominantly black census tracts, and (2) the only fruit and vegetable market located in a predominantly black census tract had closed since NYSDAM generated the list of markets used for this study, suggest that residents of the predominantly black areas were reliant on bodegas and delis to purchase fresh produce, or were forced to shop outside their immediate area. We have shown, as other investigators have demonstrated, that these types of stores have fewer choices of produce and availability at higher prices21. Moreover, for the areas studied, the population density is twice as great in BCD 9, where the predominantly black census tracts are located. Hence, these disparities in the built environment affect twice as many residents.
Our data build on previous findings that the availability of specific food types predicts consumption by residentsReference Zenk, Schultz, Hollis-Neely, Campbell, Holmes and Watkins8–Reference Cheadle, Psaty, Curry, Wagner, Diehr and Koepsell15 and that food store type is associated with obesity among residentsReference Morland, Diez Roux and Wing16, Reference Sturm and Datar17. Although it is well recognised that fresh fruits and vegetables are a good source of antioxidants, fibre and other nutrients found to prevent diseases, our findings further suggest that people living in some of the study areas may experience barriers in access to these foods because of the lack of supermarkets and the low prevalence of other stores in their neighbourhoods that carry these foods.
Further study is needed to understand these barriers, and to illuminate specifically the relationship between availability of produce and the diets of residents in these neighbourhoods, although other researchers have demonstrated a link between diet and the availability of certain food types in other areas. Additionally, further study is necessary to adequately discuss economic and cultural factors.
This and future studies investigating how disparities across local food environments ultimately impact residents’ health will further elucidate avenues for public health interventions so that urban planners, city governments and food distributors may work towards building more equitable built environments.
Acknowledgements
Sources of funding: This study was funded by the National Institute of Aging (R03 AG022726).
Conflict of interest declaration: The authors have no confilicts of interest.
Authorship responsibilities: K.M. was responsible for conceptualising the study, performing data analysis and preparing the manuscript for publication. S.F. obtained the data and contributed to editing the manuscript.


