Recently, new multidimensional tools of global diet quality have been developed to assess diet as a whole rather than based on individual nutrients( Reference Hu 1 ). The alternative Health Eating Index 2010 (aHEI-2010)( Reference Chiuve, Fung and Rimm 2 ) and the Food Quality Score (FQS)( Reference Fung, Pan and Hou 3 ) measure the overall diet quality, whereas the NOVA classification allows measurement of the contribution of ultra-processed products (UPP) to total daily dietary energy intake( Reference Vandevijvere, Monteiro and Krebs-Smith 4 ). Based on epidemiological studies, when compared with diet patterns based on whole grains, vegetables and fruits, low diet quality scores contribute to higher chronic disease risks( Reference Martínez-González, Salas-Salvadó and Estruch 5 – Reference Sofi, Abbate and Gensini 7 ) and promote weight gain( Reference Schulze, Nothlings and Hoffmann 8 – Reference Schulze, Fung and Manson 10 ). Consumption of UPP was associated with higher incidence of obesity( Reference Mendonça, Pimenta and Gea 11 ) and hypertension (R de D Mendonça, unpublished results) in a prospective cohort of Spanish middle-aged adult university graduates.
Indigenous populations suffer from a greater disease burden, including obesity, abdominal adiposity, type 2 diabetes mellitus (T2DM) and metabolic syndrome (MetS)( Reference Reading 12 , 13 ). The prevalence of MetS, which is a cluster of risk factors of T2DM and CVD, ranges from 21 to 40 % among Canadian Indigenous communities( Reference Chateau-Degat, Dewailly and Poirier 14 , Reference Kaler, Ralph-Campbell and Pohar 15 ). The age-adjusted prevalence of T2DM among First Nations is 17·2 (95 % CI 16·5, 19·0) %, three- to fivefold higher than in the general Canadian population( Reference Young, Reading and Elias 16 – Reference Green, Blanchard and Young 18 ).
The Eeyouch from James Bay, northern Québec, are no exception. The crude prevalence of T2DM in this population was estimated at 17·3 % in 2005–2009( Reference Nieboer, Dewailly and Johnson-Down 19 ). The prevalence of overweight among Eeyouch adults is 91·6 %, including 70·6 % of obesity( Reference Ngueta, Laouan-Sidi and Lucas 20 ). The loss of traditional practices, limited access to certain fresh and minimally processed foods as well as nutritional transition have been identified as contributing factors( Reference Johnson-Down and Egeland 21 , Reference Johnson-Down, Labonte and Martin 22 ). The local foods – gathered fish, game (moose, caribou, bear, etc.), birds (geese and ducks) and wild plants and fruits – have been replaced with a Westernized diet rich in UPP known to be high in energy density, free sugars, saturated fat and sodium, and low in protein, fibre and micronutrients( Reference Moubarac, Martins and Claro 23 – Reference Steele, Baraldi and Louzada 25 ). The diet of Eeyouch has been associated with obesity( Reference Downs, Arnold and Marshall 26 , Reference Khalil, Johnson-Down and Egeland 27 ) and insulin resistance( Reference Johnson-Down, Labonte and Martin 22 ).
Although studies have observed a relationship between diet quality and several chronic diseases( Reference Hu 1 , Reference Schwingshackl and Hoffmann 28 ), the information provided by three diet quality assessment tools – the aHEI-2010, FQS and the contribution of UPP to total daily dietary energy intake using the NOVA classification – has never been evaluated among Indigenous peoples, notably the Eeyouch communities from Québec.
Therefore the primary objective of the present study was to evaluate the association between diet quality and MetS in adult Eeyouch of Eastern James Bay in Québec, using three methods: the aHEI-2010, FQS and the contribution of UPP to total daily dietary energy intake using the NOVA classification. The secondary objective was to assess the pertinence of these diet quality indices in an Eeyouch context.
Methods
Study population
The Eeyouch from seven communities of Eastern James Bay were invited to participate in the cross-sectional Nituuchischaayihititaau Aschii Environment-and-Health Study between 2005 and 2009. All Eeyouch adults with the exception of pregnant and nursing women were eligible. Details of the age-stratified and random recruitment have been provided elsewhere( Reference Nieboer, Dewailly and Johnson-Down 19 , Reference Johnson-Down and Egeland 21 , Reference Johnson-Down, Labonte and Martin 22 ). Participation rate ranged from 28·5 to 60·1 % depending on the community. A total of 881 Eeyouch adults, aged 18 years or above, were surveyed. Complete data were available for 811 participants who were included in the present analysis.
Dietary assessment
Interviews were conducted, in English or Cree, by the trained community research personnel. A 24 h recall was conducted, between the months of June and September of 2005–2009, according to a five-step multiple-pass method( Reference Conway, Ingwersen and Moshfegh 29 ) using three-dimensional food models to increase accuracy of assessed intakes.
In order to assess diet quality, two scores were calculated as well as the contribution of UPP to total daily dietary energy intake using the NOVA classification (Table 1). The aHEI-2010 is based on a combination of eleven nutrients or foods previously associated with chronic diseases and mortality in epidemiological studies( Reference Chiuve, Fung and Rimm 2 ). The total aHEI-2010 score ranged from 0 (worst) to 110 (best). Higher scores (maximum 10) were attributed for higher intakes of vegetables, fruits, whole grains, nuts/legumes, long-chain n-3 fatty acids, PUFA and moderate alcohol consumption. Consumption of sugar-sweetened beverages/juices, red and processed meats, trans-fatty acids as well as sodium led to lower scores (minimum 0).
Table 1 The aHEI-2010, FQS scoring method and NOVA foods classification
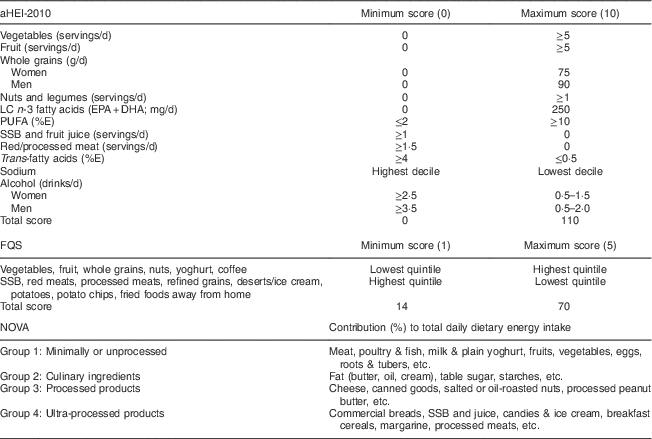
aHEI-2010, alternative Healthy Eating Index 2010; LC, long chain; FQS, Food Quality Score; %E, percentage of energy; SSB, sugar-sweetened beverages.
The FQS is based solely on the consumption frequency of fourteen foods. Six of these (vegetable, fruits, whole grain, yoghurt, coffee and nuts) have been strongly associated with lower risk of coronary artery disease and weight gain( Reference Fung, Pan and Hou 3 ). Intakes of these foods were grouped into quintiles and assigned a score ranging from 1 to 5. Reversed quintile ranking score, from 5 to 1, was attributed to the remaining eight foods (red and processed meats, potatoes, potato chips, refined grains, sugar-sweetened beverages, dessert and fried foods) known to increase the risk of coronary artery disease and weight gain. The sum of quintiles for all fourteen foods provides an overall score ranging from 14 (worst) to 70 (optimal).
The NOVA classification allowed us to classify all foods from the 24 h recall by processing type. The NOVA classification is based on the extent and purpose of food processing and categorizes foods and drinks into four main groups: Group 1, unprocessed or minimally processed (i.e. fresh fruits and vegetables, roots, legumes, eggs, etc.); Group 2, culinary ingredients (i.e. oils, sugar, salt, etc.); Group 3, processed products (i.e. canned or bottled vegetables, fruits and legumes, salted, sugared or cured meat, fish or nuts, etc.); and Group 4, ultra-processed products (i.e. carbonated drinks, salty or sweet snacks, commercial breads, cereals or energy bars, etc.). Using NOVA, we measured the contribution of UPP to total daily dietary energy intake, which was associated with poor diet quality and adverse health outcomes( Reference Vandevijvere, Monteiro and Krebs-Smith 4 ).
Sociodemographic characteristics
Participants completed questionnaires, with the bilingual community interviewers, providing sociodemographic information such as age, sex, smoking status, usual alcohol consumption and area of residence.
Metabolic syndrome
The presence of MetS among adult Cree was assessed according to latest harmonized definition( Reference Alberti, Eckel and Grundy 30 ) (Table 2). Trained research nurses measured waist circumference (WC; in centimetres) upon exhalation with the measuring tape between the last floating rib and the iliac crest( 31 ). In the absence of specific recommendations for North American Indigenous populations, it has been proposed that the South Asian thresholds are the most appropriate( Reference Kaler, Ralph-Campbell and Pohar 15 , Reference Anand 32 , Reference Delisle, Desilets and Vargas 33 ). Thus WC was interpreted as a measure of central obesity according to the specific ethnic threshold of ≥90 cm for men and ≥80 cm for women to align with the current recommendations( Reference Alberti, Eckel and Grundy 30 , Reference Delisle, Desilets and Vargas 33 , Reference Alberti, Zimmet and Shaw 34 ). Three measures of blood pressure were taken by the research nurses according to the current Canadian Hypertension Education Program recommendation( Reference Touyz 35 ). The average of two measures was then calculated. Hypertension was considered if systolic blood pressure was 130 mmHg or above, or if diastolic blood pressure was 85 mmHg or above( Reference Alberti, Zimmet and Shaw 34 ).
Table 2 Harmonized metabolic syndrome definition
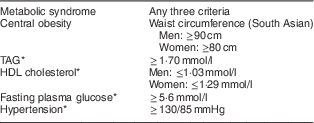
* Condition is considered present if patient is receiving specific treatment for this condition or in presence of a previous diagnosis.
Also, blood samples for the measurement of a number of metabolites were taken. Participants of the Nituuchischaayihititaau Aschii were instructed to fast overnight before blood samples were taken. The methods for laboratory measurements, including fasting plasma glucose (FPG) and fasting lipids, are described elsewhere( Reference Johnson-Down, Labonte and Martin 22 ). The following thresholds for TAG, HDL cholesterol (HDL-C) and FPG were used: TAG>1·7 mmol/l; HDL-C<1·03 mmol/l in men and <1·29 mmol/l in women; and FPG>5·6 mmol/l.
To be categorized as having MetS, participants must present any three risk factors among central obesity, hypertension, elevated TAG, reduced HDL-C and elevated FPG( Reference Alberti, Eckel and Grundy 30 ).
Statistical analysis
First, normality was assessed with the Shapiro–Wilk test and non-Gaussian distributions underwent a logarithmic transformation. Descriptive statistics of logarithmic transformation were calculated with geometric means and presented with a 95 % CI. Categorical values are given by proportions. The aHEI-2010 scores (range 0–110) and the FQS (range 14–70) were classified into quintiles( Reference Chiuve, Fung and Rimm 2 , Reference Fung, Pan and Hou 3 ). The contribution (0–100 %) of UPP to total daily dietary energy intake was also classified into quintiles.
The aHEI-2010 and FQS measure the positive impact of adherence to current dietary guidelines whereas the NOVA classification allows measurement of the caloric contribution of UPP to total daily dietary energy intake – a proxy for intakes of food products with low nutritional quality.
Logistic regression was used to describe the relationship between quintiles of diet quality scores and MetS. Models were adjusted for age, sex, area of residence, total daily dietary energy intake, alcohol and smoking status.
Statistical analyses were conducted with a two-sided significance level of α=5 % using the statistical software package SAS version 9.4.
Results
The mean age of our study population was 36·4 (95 % CI 35·4, 37·4) years and 59 % were female (n 476; Table 3). A large majority of the Eeyouch adults in our study were obese (70 %), with an additional 21 % who were overweight, and on average BMI was 33·1 (95 % CI 32·7, 33·6) kg/m2. Central obesity was found in 95 % of participants.
Table 3 Characteristics of Eeyou adults (≥18 years old) from seven northern Québec communities, Canada, 2005–2009 Nituuchischaayihititaau Aschii Environment-and-Health Study
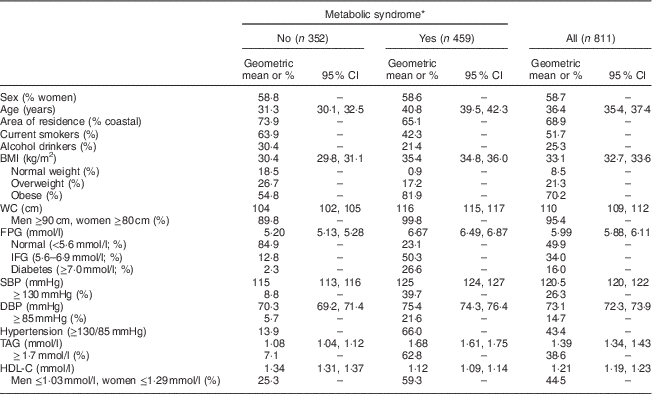
WC, waist circumference; FPG, fasting plasma glucose; IFG, impaired fasting glucose; SBP, systolic blood pressure; DBP, diastolic blood pressure; HDL-C, HDL cholesterol.
* Based on the MetS harmonized definition (see criteria in Table 2).
In our sample, the most common metabolic disturbance was elevated FPG above 5·6 mmol/l (50 %) followed by reduced HDL-C level (45 %). Forty-three per cent presented hypertension and 39 % had elevated TAG. MetS was identified in more than half of our sample (56·6 %). Participants with MetS were older and had higher BMI.
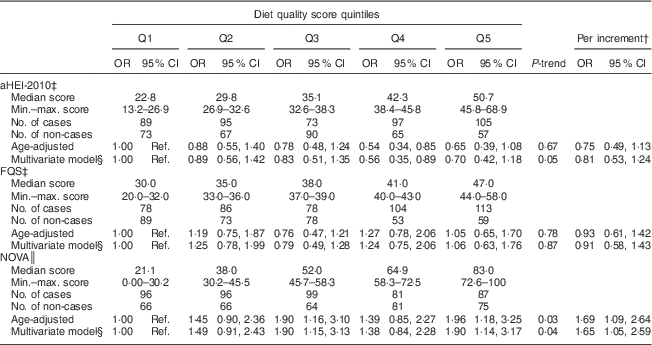
Diet quality assessment from the aHEI-2010 scores ranged from 13·2 to 68·9 with a mean of 36·3 (sd 10·7) out of a maximum score of 110 (Table 4). From a maximum possible score of 70, mean FQS was 38·2 (sd 6·4) and ranged from 20 to 58. The contribution of UPP to total daily dietary energy intake consumed by Eeyouch varied from 0 to 100 % with a mean of 51·9 (sd 22·9) %. Pearson correlation coefficients between all three diet quality scores were the strongest between aHEI-2010 and FQS (r=0·52). When comparing with the dietary share of UPP, negative correlations were observed with the aHEI-2010 score (r=−0·47) as well as with the FQS (r=−0·29). All correlations were significant (P<0·0001; data not shown).
Table 4 Adjusted odds of metabolic syndrome (MetS)Footnote * according to diet quality score quintiles of Eeyou adults (≥18 years old) from seven northern Québec communities, Canada, 2005–2009 Nituuchischaayihititaau Aschii Environment-and-Health Study
aHEI-2010, alternative Healthy Eating Index 2010; min.–max., minimum–maximum; FQS, Food Quality Score; ref., reference category.
* Based on the MetS harmonized definition (see criteria in Table 2).
† The per-increment scale represents the difference between 90th and 10th percentiles of each diet quality index and was 27·9 for aHEI-2010, 17 for FQS and 0·62 for NOVA.
‡ Q1 represents lower scores (worst) whereas Q5 the highest scores (better).
§ Adjusted for age (continuous), sex, area of residence (coastal/inland), current smoker (yes/no), alcohol drinker (yes/no, except for the aHEI-2010 model) and total dietary energy intake (kcal/d, continuous).
║ Q1 represents the lowest contribution of ultra-processed foods (best) whereas Q5 the highest contribution (worst).
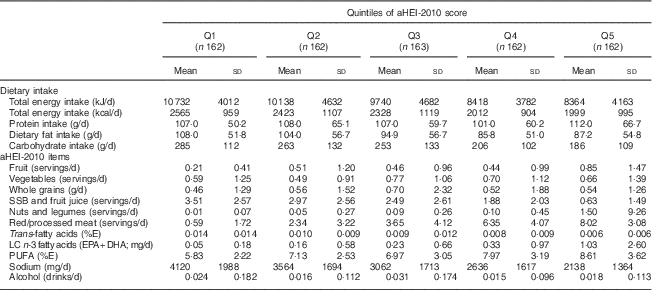
Dietary intake by aHEI-2010 score quintiles is provided in the Appendix.
After adjustment for potential confounding variables, diet quality scores showed a significant trend with prevalence of MetS in one model (Table 4). Higher quintiles of energy contribution of UPP showed significant association with MetS (OR=1·90; 95 % CI 1·14, 3·17; P-trend=0·04). A marginally significant lower trend (P=0·05) of MetS was observed for aHEI-2010 quintiles, but only the fourth quintile was statically significant (OR=0·56; 95 % CI 0·35, 0·89).
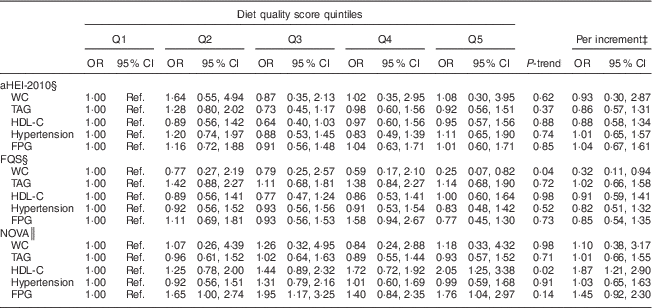
Addressing the MetS diagnosis criteria independently (Table 5), we observed a higher prevalence of reduced HDL-C with an increased contribution of UPP (P-trend=0·02). A significant trend towards lower risk of elevated WC was observed with higher FQS (P-trend=0·04). The OR of elevated WC was 0·25 (95 % CI 0·07, 0·82) for the highest quintile, compared with the lowest.
Table 5 Multivariate adjustedFootnote * odds of components of the metabolic syndrome (MetS)Footnote † according to diet quality score quintiles of Eeyou adults (≥18 years old) from seven northern Québec communities, Canada, 2005–2009 Nituuchischaayihititaau Aschii Environment-and-Health Study
aHEI-2010, alternative Healthy Eating Index 2010; WC, waist circumference; HDL-C, HDL cholesterol; FPG; fasting plasma glucose; FQS, Food Quality Score; ref., reference category.
* Adjusted for age (continuous), sex, area of residence (coastal/inland), current smoker (yes/no), alcohol drinker (yes/no, except for the aHEI-2010 model) and total dietary energy intake (kcal/d, continuous).
† Based on the MetS harmonized threshold (see criteria in Table 2).
‡ The per-increment scale represents the difference between 90th and 10th percentiles of each diet quality index and was 27·9 for aHEI-2010, 17 for FQS and 0·62 for NOVA.
§ Q1 represents lower scores (worst) whereas Q5 the highest scores (better).
║ Q1 represents the lowest contribution of ultra-processed foods (best) whereas Q5 the highest contribution (worst).
Discussion
The present study reports the first available information on diet quality and food processing relating to MetS among Indigenous peoples, notably Eeyouch adults from Eastern James Bay (Québec). Diet quality scores (aHEI-2010, FQS) were very low and the contribution of UPP to energy intake was relatively high at 52 %. When assessing the aHEI-2010, FQS and contribution of UPP to total daily dietary energy intake with risk of MetS, the contribution of UPP showed the strongest association. However, no significant association was observed with the diet quality scores provided by aHEI-2010 and FQS.
Eeyouch participants in our study suffered from a heavy burden of MetS (57 %), approximately 2·7 times higher than that among the general Canadian population( 36 ), despite a younger average age among the Eeyouch. These rates are consistent with those found in Cree communities from western Canada( Reference Kaler, Ralph-Campbell and Pohar 15 ). Other First Nations populations in Canada have reported (2006) lower rates of MetS (range 16·0–37·5 %)( Reference Liu, Hanley and Young 37 ). Chateau-Degat et al.( Reference Chateau-Degat, Dewailly and Poirier 14 ) observed lower rates (men 21·1 %, women 25·1 %) of MetS (2005 International Diabetes Federation definition) among James Bay Cree in 1990–1992 than those found in our study (men 56·7 %, women 56·5 %). Wide variation in prevalence of MetS risk factors has been observed among different ethnic groups, such as the WC cut-offs( Reference Kaler, Ralph-Campbell and Pohar 15 , Reference Delisle, Desilets and Vargas 33 ). As such, elevated TAG and impaired fasting glucose are considered good indicators of MetS in most populations( Reference Delisle, Desilets and Vargas 33 ). The high prevalence of MetS in our study (57 %) was accompanied by a very high rate of obesity (70 %) and central adiposity (95 %). This is also consistent with observations from Canadian, American and European studies( Reference Grundy 38 ).
The current study on the association between diet quality indices and the prevalence of MetS among Eeyouch may contribute to our knowledge of the current nutritional environment and transition that many Indigenous populations are facing( Reference Popkin 39 ).
In recent years, several diet quality scores have been developed as an alternative to studying the intake of single nutrients to better reflect diet complexity( Reference Hu 1 , Reference Patterson, Haines and Popkin 40 ). Many epidemiological studies have observed strong associations between diet quality scores and cardiometabolic risks. Moubarac et al.( Reference Moubarac, Martins and Claro 23 ) observed that UPP in Canada have a higher energy density and contain more free sugar, fat and salt than non ultra-processed products (fresh or minimally processed food, culinary ingredients and processed food together). The limited intake of fresh and unprocessed foods and the importance of energy-dense products in Canadian Aboriginal communities’ diets are corroborated by several studies( Reference Johnson-Down, Labonte and Martin 22 , Reference Downs, Arnold and Marshall 26 , Reference Downs, Marshall and Ng 41 – Reference Kuhnlein, Receveur and Soueida 43 ).
Our findings agreed with other epidemiological research focusing on the relationship between UPP and health( Reference Steele, Baraldi and Louzada 25 , Reference Rauber, Campagnolo and Hoffman 44 – Reference Moreira, Baraldi and Moubarac 51 ). For the prevention and management of obesity, T2DM and other chronic diseases, the Canadian evidence has shown that UPP should contribute less than one-third to total daily dietary energy intake in order to meet the WHO recommendations for fat, free sugars, sodium and fibre intake( Reference Moubarac, Martins and Claro 23 ). The contribution (52 %) of UPP to total daily dietary energy intake in our sample is well above that recommendation. It is also higher than the Québec average of 47 %( Reference Moubarac and Batal 52 ). UPP have been associated with MetS( Reference Tavares, Fonseca and Garcia Rosa 49 ), obesity( Reference Mendonça, Pimenta and Gea 11 , Reference Canella, Levy and Martins 46 , 47 , Reference Louzada, Baraldi and Steele 53 ), lipid profile( Reference Rauber, Campagnolo and Hoffman 44 ) and CVD( Reference Moreira, Baraldi and Moubarac 51 ).
Lower aHEI-2010 scores have been strongly associated with chronic disease risk, particularly T2DM( Reference Chiuve, Fung and Rimm 2 ) and obesity( Reference Boggs, Rosenberg and Rodriguez-Bernal 54 ). Mean aHEI-2010 score in our sample was 36·3 (range 13·2–68·9), which is similar to the average found by Boggs et al.( Reference Boggs, Rosenberg and Rodriguez-Bernal 54 ). These scores are considerably lower than in other study populations, even in regions with lower socio-economic status( Reference Chiuve, Fung and Rimm 2 , Reference Varraso, Chiuve and Fung 55 , Reference Wang, Leung and Li 56 ). This agrees with current knowledge of the dietary environment of Canadian First Nation communities( Reference Johnson-Down and Egeland 21 , Reference Bergeron, Richer and Bruneau 57 – Reference Earle 59 ). Although the aHEI-2010 score is built on strong epidemiological evidence( Reference Chiuve, Fung and Rimm 2 , Reference Boggs, Rosenberg and Rodriguez-Bernal 54 , Reference Varraso, Chiuve and Fung 55 ), the index has never been validated in an Aboriginal setting. The low scores may relate to inadequacy of the tool with the specificities of Eeyouch Istchee communities. The distribution of aHEI-2010 scores in our sample is within the lower half of the scale out of a possible maximum score of 110. The very low scores of aHEI-2010 might explain why comparing highest (45·8–68·9) and lowest (13·2–26·9) score quintiles showed no significant association. The highest score quintile in our sample may not translate into statistically significant health benefits.
Although the FQS did not show a significant association with MetS in our sample, the FQS stands out by its simplicity and the absence of reliance on nutrient intake( Reference Fung, Pan and Hou 3 ). This represents a net advantage in clinical and research contexts where traditional dietary evaluations take a considerable time to complete and analyse. Unfortunately, the current tool may not be appropriate in the First Nations context. Items such as whole grains and nuts represent only small portions of the Cree diet( Reference Johnson-Down, Labonte and Martin 22 ). Therefore, a dietary assessment tool with a food-based checklist tailored to the Indigenous situation would be of great help in clinical and research settings. This list could identify foods that have been associated with chronic disease in Indigenous peoples. Beside specific products, these indices do not discriminate food products based on the processing level. This represents another limit of these indices.
Strengths of the study
To our knowledge, the present study is the first to assess the pertinence in a Canadian Indigenous context of three dietary quality indices (aHEI-2010, FQS and the contribution of UPP to total daily dietary energy intake using the NOVA classification). It is also the first to study the relationship between these indices and MetS. Considering the random recruitment method, the prevalence of MetS reported is most likely representative of the real prevalence in adult Eeyouch from Eastern James Bay, Québec. Our data confirming high rates of MetS in Eeyouch with respect to the important contribution of UPP to the diet are therefore particularly striking.
Weaknesses of the study
Information bias is inherent to all dietary recall methods( Reference Shim, Oh and Kim 60 , Reference Willett 61 ). It has been shown that certain foods which are present in FQS and aHEI-2010 lists are forgotten or omitted in 24 h recall( Reference Moshfegh, Rhodes and Baer 62 ). However, the five-step multiple-pass method, including a list of often forgotten foods, ensures a greater reliability of dietary food intake( Reference Conway, Ingwersen and Moshfegh 29 , Reference Moshfegh, Rhodes and Baer 62 , Reference Conway, Ingwersen and Vinyard 63 ). Finally, the 24 h recall was not designed to use the NOVA classification; therefore, some foods could have been misclassified due to lack of sufficient details.
The cross-sectional design of the study is another limitation and does not allow us to determine any causal relationships. Moreover, it is possible that participants with high MetS risk factors may have already made changes to their diet that could not be identified in the current study design. Therefore, prospective studies are needed.
Conclusion
Our results suggest a high prevalence of MetS among Eeyouch adults from Eastern James Bay, Québec. The NOVA classification, particularly the contribution of UPP to total daily dietary energy intake, provides the strongest relationship with MetS. These results support the use of UPP contribution to total daily dietary energy intake as a new meaningful predictive indicator of overall diet nutritional quality. Although the overall scores calculated by the three indices used in the present study suggest a low diet quality in these communities, more pertinent and culturally adapted instruments are needed to fully understand the impact of diet quality on MetS. These results support the importance of developing tools that are tailored to the particular nutritional environment in Canadian Indigenous communities. Further research should also address determinants of diet quality, especially food availability, access and utilization (knowledge and preferences).
Acknowledgements
Acknowledgements: The authors would like to thank the Eeyou communities that participated and all the staff from the communities, the Cree Board of Health and Social Service of James Bay and universities who made this project a success. Financial support: This scientific communication is a report from the Nituuchischaayihtitaau Aschii: Multi-Community Environment-and-Health Longitudinal Study in Iiyiyiu Aschii supported by the Cree people of northern Québec, the Cree First Nations and the Cree Board of Health and Social Services of James Bay through financial contributions from Niskamoon Corporation (agreement number 2005.06). M.L.-R. was supported by the Recruitment Master’s Scholarship 2015–2016 Wilbrod-Bherer from Laval University, the 2016 Canada Graduate Scholarships–Master’s and the 2016–2017 CHU Foundation of Quebec. The funders had no role in the design, analysis or writing of this article. Conflict of interest: None. Authorship: L.J.-D. participated in the data collection; M.L.-R., E.A.L.S., J.-C.M. and M.L. designed the analysis; S.L.-L., J.-C.M., M.L.-R. and E.A.L.S. contributed to the data analysis; M.L.-R. conducted the analysis and interpretation and wrote the first draft of the manuscript; J.-C.M., S.L.-L., L.J.-D., M.B. and M.L. critically revised the manuscript for important intellectual content; M.L. had primary responsibility for the manuscript final content. All authors read and approved the final version of the manuscript. Ethics of human subject participation: This study was conducted according to the guidelines laid down in the Declaration of Helsinki and all procedures involving human subjects/patients were approved by the Laval University, McMaster University, McGill University and the Cree Board of Health and Social Services of James Bay ethics committees. Written informed consent was obtained from all participants.
Appendix
Dietary intake by aHEI-2010 score quintiles of Eeyou adults (≥18 years old) from seven northern Québec communities, Canada, 2005–2009 Aschii Nituuchischaayihititaau Environment-and-Health Study
