Community-based screening and treatment of acute malnutrition can reduce malnutrition-related hospitalization and mortality(Reference Collins, Dent and Binns1,Reference Collins, Sadler and Dent2) . The risk of mortality for children with a weight-for-height Z-score (WHZ) of <–3 or a mid-upper arm circumference (MUAC) of <115 mm is substantially elevated compared with children with higher scores(Reference Collins, Sadler and Dent2). The WHO uses these cut-offs in addition to the presence of nutritional oedema to identify children with severe acute malnutrition (SAM)(3).
Practitioners in clinic-based settings use both MUAC and WHZ to identify children with SAM for admission to nutritional programmes. MUAC is more suitable for community-based programmes(Reference Velzeboer, Selwyn and Sargent4,Reference Myatt, Khara and Collins5) , which typically use MUAC alone to screen for SAM. WHZ requires weight and height measurement and comparison to reference standards, whereas MUAC relies on a single, independent measurement. WHZ is also associated with body shape and might result in inaccurate estimates of the prevalence of malnutrition in certain populations(Reference Myatt, Duffield and Seal6,Reference Post and Victora7) . MUAC is thus simpler, less expensive and more acceptable to children and practitioners in community settings than WHZ, while being both an accurate and a reliable indicator of malnutrition(Reference Myatt, Khara and Collins5).
MUAC has been shown to be a better predictor of near-term mortality than WHZ in children in both clinic- and community-based settings(Reference Berkley, Mwangi and Griffiths8–Reference Chiabi, Mbanga and Mah15). Increasingly, studies have explored the use of MUAC alone to identify children for admission to nutritional programmes(Reference Myatt, Khara and Collins5,Reference Ali, Zachariah and Shams11,Reference Goossens, Bekele and Yun16) . Despite identifying the most at-risk children, using MUAC < 115 mm as the only anthropometric criterion for admission might miss children who would benefit from treatment(Reference Grellety, Krause and Shams Eldin13,Reference Isanaka, Guesdon and Labar17) . MUAC and WHZ tend to have poor agreement and identify different subsets of children(Reference Berkley, Mwangi and Griffiths8,Reference Grellety, Krause and Shams Eldin13,Reference Isanaka, Guesdon and Labar17–Reference Myatt, Khara and Dolan20) . In addition, much of the available evidence for MUAC’s ability to identify children at risk for mortality is from clinical studies and as such is subject to selection bias related in part to health-care-seeking behaviours(Reference Berkley, Mwangi and Griffiths8,Reference Aguayo, Aneja and Badgaiyan12–Reference Chiabi, Mbanga and Mah15) . The effectiveness of using MUAC to efficiently identify malnourished children and reduce mortality relies on MUAC being an adequate indicator for mortality in multiple settings.
Here, we aimed to compare anthropometric indicators as predictors of mortality over 2 years in a population-based cohort of children nested in a cluster-randomized trachoma trial in Niger(Reference Amza, Kadri and Nassirou21–Reference Amza, Yu and Kadri23).
Methods
Study setting
The current secondary analysis was part of the Partnership for the Rapid Elimination of Trachoma (PRET; clinicaltrials.gov NCT00792922)(Reference Stare, Harding-Esch and Munoz24). The multicentre, cluster-randomized PRET trial took place in the Gambia, Niger and Tanzania; the present study uses data from the Niger site. Eligibility criteria for participation in the Niger trial have been reported elsewhere(Reference Amza, Kadri and Nassirou21,Reference Amza, Kadri and Nassirou25) . Briefly, the trial included forty-eight communities with populations between 250 and 600 people in six Centres de Santé Intégrés in the Matameye district and excluded communities with a prevalence of trachoma of less than 10 % among children younger than 72 months.
Study design and participants
The PRET trial randomized communities to four arms: (i) annual treatment, standard (80 %) coverage; (ii) annual treatment, enhanced (≥90 %) coverage; (iii) biannual treatment, standard (80 %) coverage; and (iv) biannual treatment, enhanced (≥90 %) coverage. Treatment was a single directly observed dose of oral azithromycin (20 mg/kg of body weight up to a maximum dose of 1 g). An annual census was conducted to collect data on demographics and vital status and to assess treatment coverage over the 3-year study period. Biannual study visits were conducted to monitor trachoma prevalence and collect data on secondary outcomes. The design of the parent trial has been reported previously(Reference Amza, Kadri and Nassirou21,Reference Amza, Kadri and Nassirou25) .
The baseline visit for the present study corresponds to the PRET trial’s 12-month study visit. The present study includes children 6–60 months old who completed anthropometric assessments during the baseline visit from the twenty-four communities randomized to annual or biannual treatment at 80 % coverage. A random sample of sixty-two children aged 6–60 months per community was generated from prior census data in order to include at least fifty children per community. If a community had fewer than sixty-two children, all children were selected.
Trained study personnel collected data on demographics and anthropometry, including length or height, weight and MUAC. Study personnel measured recumbent length in children younger than 24 months and standing height in children aged 24 months or older. Length and height were recorded to the nearest 0·1 cm and were assessed using a Schorrboard (Schorr Productions, Olney, MD, USA). Children were weighed standing or in the arms of a caregiver. Weight was recorded to the nearest 0·1 kg using a Seca 874 scale (Seca GmbH & Co. KG, Hamburg, Germany). MUAC was measured to the nearest 1 mm using a tape developed by Johns Hopkins University (Baltimore, MD, USA)(Reference Labrique, Christian and Klemm26). All measurements were conducted three times and the median value was used for analysis. Study personnel referred children with MUAC < 115 mm or illness to the local health post.
Variables
The outcome for the present study is death as recorded on any census or monitoring visit from baseline to 2 years after enrolment, which corresponds to the PRET trial’s 36-month visit. Children were classified as died during this period or alive at the final study visit. Children who moved during the study period or had an unknown status at the final study visit were classified as lost to follow-up.
The predictors in the present study are height-for-age Z-score (HAZ), weight-for-age Z-score (WAZ), WHZ and MUAC. HAZ, WAZ and WHZ were calculated according to the 2006 WHO Child Growth Standards using the zscore06 package in the statistical software package Stata version 14.2(Reference Leroy27). Anthropometric indicators were dichotomized into moderately to severely malnourished or not. Children with Z-scores < −2 or MUAC < 125 mm were classified as malnourished. We used moderate to severe malnutrition rather than SAM for categorization because, as both SAM and mortality are rare events, this sample contained too few cases of both for analysis.
Covariates were chosen a priori and included age at the time of the baseline visit in months, sex and randomization arm.
Statistical methods
Characteristics of the study population at baseline were compared by final study visit status (died, alive, moved/unknown) using Fisher’s exact test for categorical variables or ANOVA for continuous variables. We constructed Venn diagrams to display the numbers of children classified by each combination of anthropometric indicators of malnutrition. Receiver-operating characteristic curves were constructed to compare the ability of each anthropometric indicator to predict mortality at different cut-off points. AUC were calculated and compared using a χ 2 test.
To examine the association between each predictor and mortality, we used generalized estimating equations to estimate hazard ratios. Models used a binomial distribution with a complementary log–log link, assumed an exchangeable working correlation, accounted for clustering by community and estimated robust se. Unadjusted models included the predictor in question as the sole covariate. Adjusted models included age, sex and randomization arm as covariates. All models included an indicator for study visit interval to account for censoring between study visits. Analyses were conducted using Stata version 14.2 and figures were developed in R version 3.5.2.
Results
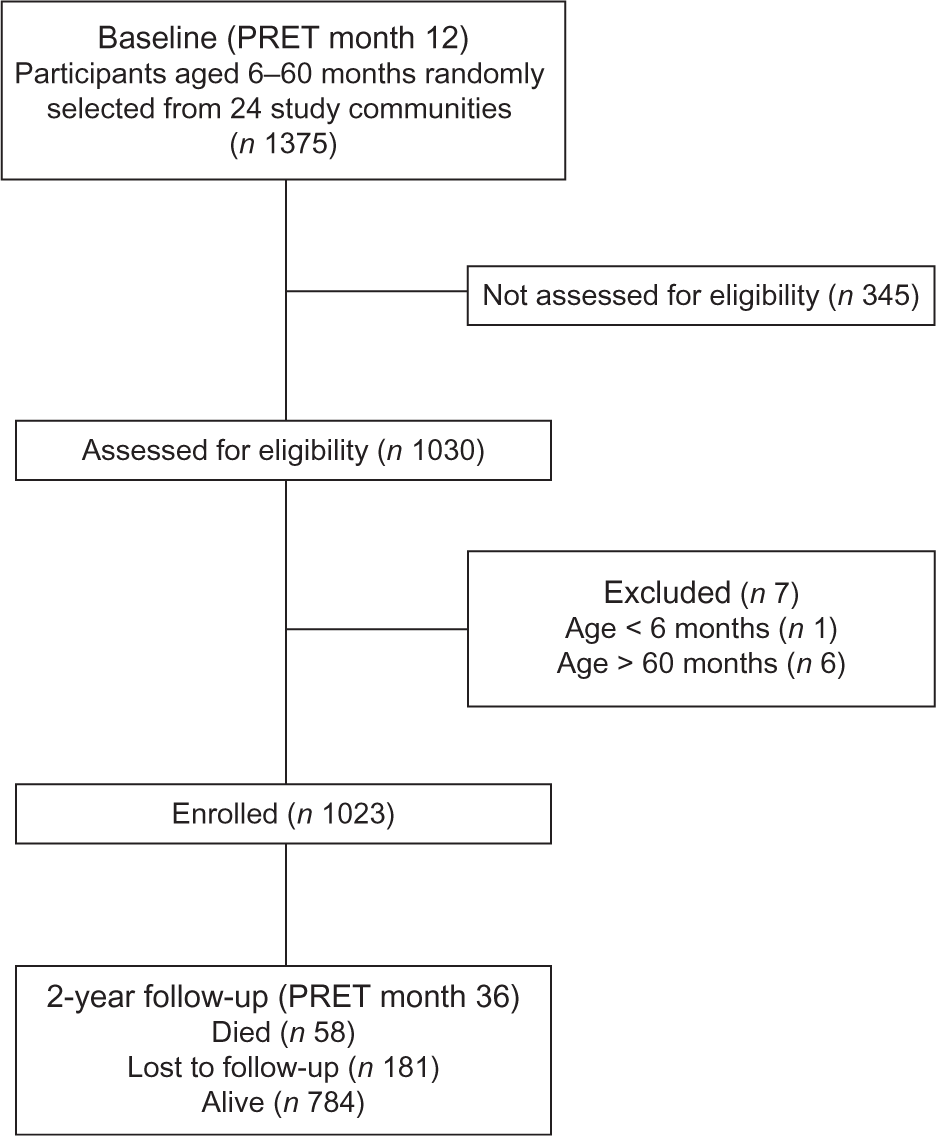
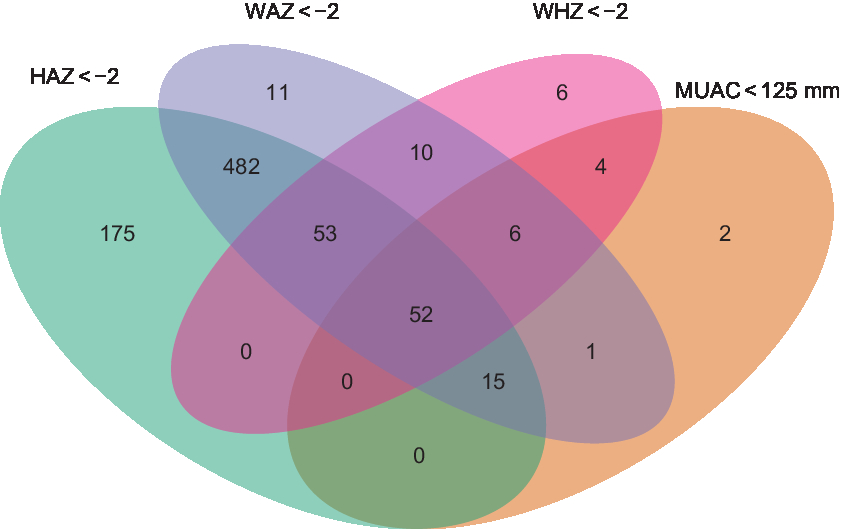
In May 2011, 1375 children aged 6–60 months were randomly selected from twenty-four communities included in the PRET-Niger trial and 1023 (74·4 %) participated in the study visit (Fig. 1). Table 1 displays baseline characteristics. Among children in the final sample, 47·1 % were female and the mean age was 36·9 months. HAZ, WAZ, WHZ and MUAC classified 777 (76·0 %), 630 (61·6 %), 131 (12·9 %) and eighty (7·8 %) children as malnourished, respectively. Fifty-two children (5·1 %) were classified as malnourished by all indicators (Fig. 2). Overall, fifty-eight children (5·7 %) died over the 2-year study period and 181 children (17·7 %) moved out of the study area or had an unknown status by the time of the final study visit. No significant differences were identified when comparing baseline characteristics by status (died, alive, moved/unknown) at the final study visit. By anthropometric indicator, deaths included 5·9 % (46/777) of those classified as malnourished by HAZ, 6·8 % (43/630) by WAZ, 9·9 % (13/131) by WHZ and 16·3 % (13/80) by MUAC.

Fig. 1 Flow diagram of participants in the current secondary analysis of the PRET-Niger trial (PRET, Partnership for the Rapid Elimination of Trachoma)
Table 1 Baseline characteristics of the study population of children aged 6–60 months, PRET-Niger trial*

PRET, Partnership for the Rapid Elimination of Trachoma; HAZ, height-for-age Z-score; WAZ, weight-for-age Z-score; WHZ, weight-for-height Z-score; MUAC, mid-upper arm circumference.
* Percentages may not sum to 100 % due to rounding.
† Missing HAZ: n 1.
‡ Missing WHZ: n 5.

Fig. 2 Venn diagram showing the number of children aged 6–60 months classified as acutely malnourished by different anthropometric indicators in the PRET-Niger trial (HAZ, height-for-age Z-score; WAZ, weight-for-age Z-score; WHZ, weight-for-height Z-score; MUAC, mid-upper arm circumference; PRET, Partnership for the Rapid Elimination of Trachoma)
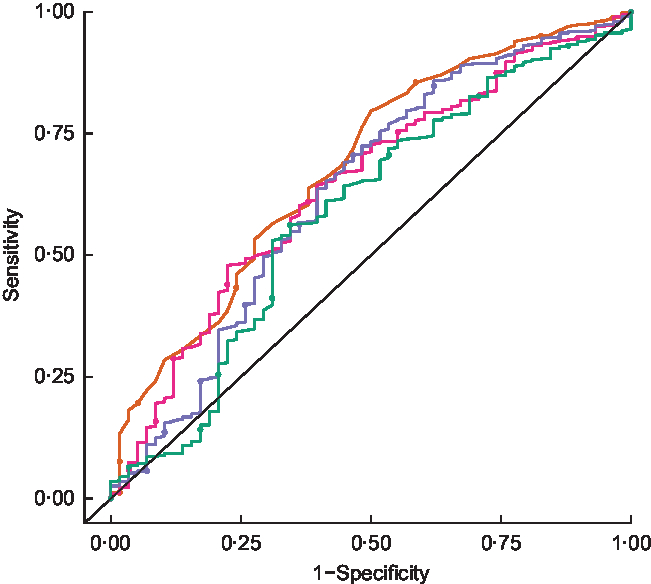
Figure 3 shows receiver-operating characteristic curves for HAZ, WAZ, WHZ and MUAC. Table 2 summarizes the AUC for each anthropometric indicator. MUAC had the largest AUC (0·68, 95 % CI 0·61, 0·75), followed by WHZ and WAZ which had similar AUC (0·64, 95 % CI 0·57, 0·72 and 0·63, 95 % CI 0·55, 0·71, respectively).

Fig. 3 Receiver-operating characteristic curves comparing the accuracy of different anthropometric indicators (![]() , height-for-age Z-score;
, height-for-age Z-score; ![]() , weight-for-age Z-score;
, weight-for-age Z-score; ![]() , weight-for-height Z-score;
, weight-for-height Z-score; ![]() , mid-upper arm circumference) in predicting mortality over 2 years among children aged 6–60 months in the PRET-Niger trial.
, mid-upper arm circumference) in predicting mortality over 2 years among children aged 6–60 months in the PRET-Niger trial. ![]() represents the line of no discrimination (PRET, Partnership for the Rapid Elimination of Trachoma)
represents the line of no discrimination (PRET, Partnership for the Rapid Elimination of Trachoma)
Table 2 Comparison of areas under the receiver-operating characteristic curves of different anthropometric indicators* for predicting mortality over 2 years among children aged 6–60 months in the PRET-Niger trial

PRET, Partnership for the Rapid Elimination of Trachoma; HAZ, height-for-age Z-score; WAZ, weight-for-age Z-score; WHZ, weight-for-height Z-score; MUAC, mid-upper arm circumference.
* P value for the test of the null hypothesis that the four AUC are equal = 0·01.
Table 3 presents the population average relative hazard of mortality in children with and without malnutrition as predicted by HAZ, WAZ, WHZ and MUAC. The adjusted hazard of mortality over 2 years among children with MUAC < 125 mm was 2·21 times the hazard among children with MUAC ≥ 125 mm across communities in the present study (95 % CI 1·26, 3·89, P = 0·006). The comparison of mortality by nutritional status was not statistically significant for the other anthropometric indicators, although the magnitude of the association for the comparison with WAZ was the second largest (adjusted hazard ratio = 1·75, 95 % CI 0·96, 3·19, P = 0·07).
Table 3 Relative hazard of mortality over 2 years in children aged 6–60 months by nutritional status* in the PRET-Niger trial

PRET, Partnership for the Rapid Elimination of Trachoma; HR, hazard ratio; HAZ, height-for-age Z-score; WAZ, weight-for-age Z-score; WHZ, weight-for-height Z-score; MUAC, mid-upper arm circumference.
* Acute malnutrition defined as HAZ < –2, WAZ < –2, WHZ < –2 or MUAC < 125 mm.
† Adjusted for treatment arm, baseline age and sex.
Discussion
In the current population-based prospective study, we found that MUAC was the strongest predictor of mortality. Our results are consistent with previous similar studies in community- and clinic-based settings. Population-based studies in South Asia and West Africa have demonstrated MUAC’s strong association with mortality(Reference Goossens, Bekele and Yun16,Reference Briend, Wojtyniak and Rowland28–Reference Taneja, Rongsen-Chandola and Mohan30) . Several studies have shown that MUAC is a better predictor of mortality than WHZ(Reference Berkley, Mwangi and Griffiths8,Reference Mwangome, Fegan and Fulford10,Reference Aguayo, Aneja and Badgaiyan12,Reference Grellety, Krause and Shams Eldin13,Reference Chiabi, Mbanga and Mah15,Reference Bairagi31,Reference Van den Broeck, Eeckels and Massa32) , including other longitudinal studies conducted in community settings(Reference Briend, Maire and Fontaine9,Reference Ali, Zachariah and Shams11,Reference Amza, Kadri and Nassirou21,Reference Alam, Wojtyniak and Rahaman33,Reference Vella, Tomkins and Ndiku34) . Studies examining multiple indicators suggest that WAZ is the second-most sensitive predictor of mortality(Reference Bairagi31,Reference Alam, Wojtyniak and Rahaman33,Reference Vella, Tomkins and Ndiku34) with one recent study concluding that a combination of WAZ and MUAC identifies the majority of near-term deaths associated with malnutrition(Reference Myatt, Khara and Dolan20).
In the present study, we found that HAZ, WAZ, WHZ and MUAC identified different subgroups of children as malnourished, with some overlap. Discordance in children identified with MUAC alone v. MUAC and/or WHZ as the criterion for admission to nutritional programmes for SAM has also been shown in other studies(Reference Isanaka, Guesdon and Labar17,Reference Tadesse, Tadesse and Berhane18,Reference Bern and Nathanail35) . In our study, a larger proportion of children identified as moderately to severely malnourished by MUAC died compared with those identified by all other indicators. For community-based screening programmes, MUAC is more efficient than WHZ- or even WAZ-based screening, both of which require more complex measurements and calculation of Z-scores. Our results indicate that although use of MUAC alone will miss some children with malnutrition who may be at risk of mortality, at the community level MUAC identifies a large proportion of these children. Given the relative ease of the use of MUAC for mass screening programmes, these results support its continued use.
Strengths of the present study include the use of a population-based sample, which provides evidence representative of the community as a whole. The prospective design also enabled us to examine mortality over a 2-year period, providing longer-term evidence than prior studies. In addition, we minimized the risk of misclassification by using standardized data collection as part of a randomized controlled trial and used triplicate measurements of anthropometric indicators to ensure repeatability. Limitations include the sample size, which was too small to examine moderate acute malnutrition and SAM separately, as there was only a single child identified with SAM. Prior work suggests that 46–80 % of deaths among malnourished children occur among mild to moderate malnutrition(Reference Pelletier36) and some have suggested using higher MUAC cut-offs for screening(Reference Grellety, Krause and Shams Eldin13,Reference Laillou, Prak and de Groot19) . Another potential limitation is generalizability. The study was conducted in a trachoma-endemic, high-mortality setting in Niger, and it may not be possible to generalize results to other settings with different patterns of malnutrition, infectious disease and child mortality. In addition, loss to follow-up was 18 %. Although the population of children who moved or had unknown status at follow-up was similar to those who were alive, differential loss to follow-up could lead to selection bias. Finally, relatively few baseline covariates were measured, and we cannot rule out the possibility of bias due to residual confounding.
In the present study of pre-school children in a trachoma-endemic region of Niger, we found that MUAC was a better predictor of mortality than other anthropometric indicators. These results support the use of MUAC in screening for acute malnutrition, as MUAC alone may identify more children at risk for mortality than other indicators in similar West African settings.
Acknowledgements
Acknowledgements: The authors would like to thank the Data and Safety Monitoring Committee, including Douglas Jabs, MD, MBA (chair); Antoinette Darville, MD; Maureen Maguire, PhD; and Grace Saguti, MD, who were generous with their time and advice before and during the study. The authors thank Kurt Dreger, who designed and maintained the database, and the team in Niger at Programme National de Santé Oculaire who helped implement the study. Financial support: This work was supported by the Bill and Melinda Gates Foundation (grant number 48027); the National Institutes of Health (grant numbers NIH/NEI K23 EYO19881-01 and NIH/NCRR/OD UCSF-CTSI KL2 RR024130); Research to Prevent Blindness; That Man May See; the Harper-Inglis Trust; and the Peierls Foundation. The funders had no role in the design, analysis or writing of this article. Conflict of interest: None. Authorship: K.S.O. formulated the research question, analysed the data and contributed to the writing of this article. A.A., B.K., B.N., S.Y.C., N.E.S., S.K.W., R.L.B., T.C.P., J.D.K. and T.M.L. designed and implemented the original trial and contributed to the writing of this article. C.E.O. formulated the research question and contributed to the writing of this article. Ethics of human subject participation: This study was conducted according to the guidelines laid down in the Declaration of Helsinki and all procedures involving human subjects were approved by the University of California San Francisco Committee for Human Research and the Comité d’Ethique du Niger (the Ethical Committee of Niger). Verbal informed consent was obtained from all subjects. Verbal consent was witnessed and formally recorded.


