Waiting lists are an important indicator of mismatch between supply and demand in the NHS. Therefore, successive governments have made their reduction a priority, with monies earmarked specifically for their reduction, in waiting-list initiatives. However, their efficiency depends on the likelihood of attendance once an appointment is sent. In child and adolescent psychiatry generally, non-attendance rates are typically between 14 and 35%, though higher rates have been reported (Reference Cottrell, Hill and WalkCottrell et al, 1988; Reference Kourany, Garber and TornuscioloKourany et al, 1990; Reference Mathai and MarkantonakisMathai & Markantonakis, 1990). A long delay between referral and contact with the service is an important reason for non-attendance (Reference Gerber, Leixnering and ReineltGerber et al, 1990; Reference Kourany, Garber and TornuscioloKourany et al, 1990; Reference Munjal, Latimer and McCuneMunjal et al, 1994) but the relationship between waiting time and attendance likelihood has not been quantified, so estimating the extent of non-attendance from the composition of the list is difficult. We therefore report a survival analysis of a waiting-list initiative. This quantitative assessment might improve predictions of the resources needed to address treatment queues.
The study
The initiative began in April 1995. All patients then waiting for appointments for any time were sent a Child Behavior Check-List (CBCL; Reference Achenbach and EdelbrockAchenbach & Edelbrock, 1983). Those who did not return their questionnaires were sent a second copy a month later. If they still had not returned their questionnaires after a further month, they were contacted by letter or telephone, asked if they still wanted an appointment, and the reason for non-return recorded. If they could not be contacted, then a further copy of the CBCL was sent to the referrer, with a request that the referrer ensures that it be filled out and returned if the patient still needed to be seen. The returned CBCLs were reviewed by the consultant (D.M.F.) in charge of the initiative, in conjunction with the referral letter. If the CBCL scores were clinically significant, or if the referral letter suggested a diagnosis (such as autism) to which the CBCL was not sensitive, then an appointment was sent in the next four weeks. If not, a letter was sent to the referrer, indicating that the case was unlikely to be appropriate for child and adolescent psychiatry services suggesting an alternative disposal, and inviting the referrer to contact the clinic if he or she disagreed with this assessment. The clinic was a typical secondary care child and adolescent psychiatry clinic, whose case mix has been previously published (Reference Dover, Leahy and ForemanDover et al, 1994).
Data collected included age, gender, source and reason for referral and weeks elapsed between receiving a referral letter and sending the initial questionnaire.
The reason for referral in each letter was diagnostically coded as behavioural, emotional, mixed or other/uncertain. The reason for non-attendance or questionnaire non-return was coded as: no reason given; forgot; had not received questionnaire; no longer needed help; waited too long; found help elsewhere; and did not like the questionnaire. In addition, questionnaire return, subsequent clinic attendance and reason for non-attendance were recorded. To overcome the problem of missing data in referral letters, information from the referral letters was coded using the Pearce Case Complexity Scale (PCCS; further details available from the authors upon request), a scale that records and summates clinical information in six domains: psychopathological comorbidity, disability, legal involvement, previous unsuccessful treatment, agency involvement and social difficulties. Thus, missing information simply reduced the score in a particular domain. A separate sample of 51 referral letters was used to test the scale's reliability, the first and second authors scoring separately. Interrater reliability (Guttman's split-half) of the PCCS was 0.9. Information from the CBCL or clinical interviews was not used for this study, as this would not be available for non-attenders or non-returners.
The data were initially inspected for missing data, no more than 1% were found for any variable used in the analysis. Though the PCCS score was coded as a continuous variable, 80% of cases scored three or less, reflecting the poor quality of data in the referral letters. It was, therefore, recorded as ordered categories, with scores of three or more collapsed together. Seventy-four per cent of referrals were from general practitioners (GPs). Referral source was therefore analysed as two categories; GP and other referrer. Following descriptive summary analysis, Cox regression was used to assess the changing probability of questionnaire non-return with increasing waiting time. A separate Kaplan-Meier analysis, with log-rank test, was used to assess the relationship between time left waiting and the reasons given for non-return. The significant variables on the Cox regression were each evaluated as dependent variables against waiting time, using logistic regression and correlation as appropriate. A single polychotomous nominal logistic regression compared referrals that had returned the questionnaire, but failed to attend the offered appointment, with both clinic attenders and questionnaire non-returners. Analyses were performed on SPSS for Windows 7.5.3 and Minitab for Windows 12.1.
Findings
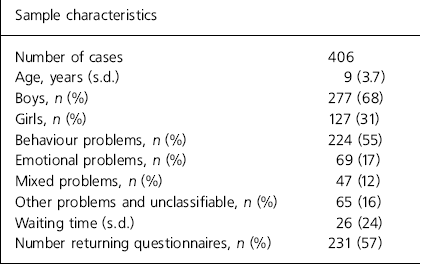
The sample characteristics are given in Table 1. Ten percent of those returning questionnaires did not attend the appointments they were sent, and a further 18% did not require an appointment, as no current psychiatric problem could be identified from the questionnaire or letter. In total, 170 cases (42%) eventually attended.

| Sample characteristics | |
|---|---|
| Number of cases | 406 |
| Age, years (s.d.) | 9 (3.7) |
| Boys, n (%) | 277 (68) |
| Girls, n (%) | 127 (31) |
| Behaviour problems, n (%) | 224 (55) |
| Emotional problems, n (%) | 69 (17) |
| Mixed problems, n (%) | 47 (12) |
| Other problems and unclassifiable, n (%) | 65 (16) |
| Waiting time (s.d.) | 26 (24) |
| Number returning questionnaires, n (%) | 231 (57) |
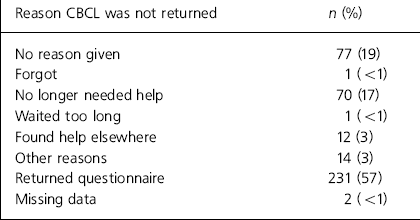
The overall proportion returning the CBCL, and the frequencies of the reasons given for not returning it, are given in Table 2. No case reported that the questionnaire was unacceptable or incomprehensible, and none wanted an appointment despite not having returned the questionnaire.

| Reason CBCL was not returned | n (%) |
|---|---|
| No reason given | 77 (19) |
| Forgot | 1 (<1) |
| No longer needed help | 70 (17) |
| Waited too long | 1 (<1) |
| Found help elsewhere | 12 (3) |
| Other reasons | 14 (3) |
| Returned questionnaire | 231 (57) |
| Missing data | 2 (<1) |
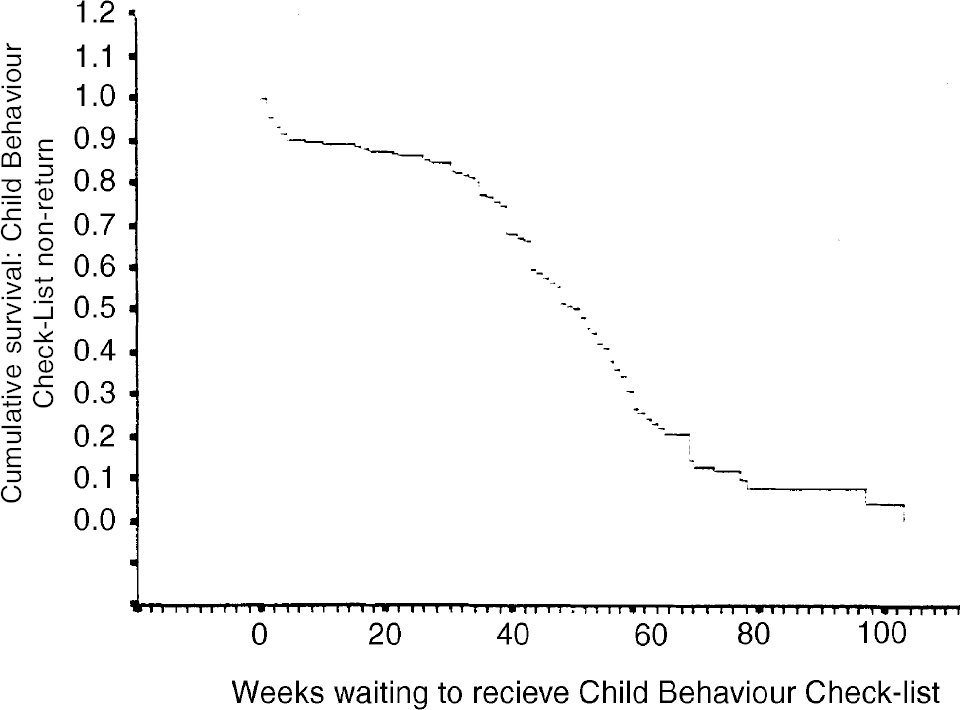
The survival function of the stepwise Cox regression is given in Fig. 1.

Fig. 1. Cox regression: survival function
Ten per cent of referral loss took place in the first four weeks. After that, the attrition rate slowed, with a further 10% being lost by 30 weeks. From then on however, attrition accelerated sharply to just under 2% per week to approximately 60 weeks. The reason given for non-return added no information (log-rank test 1.83, d.f. 3, NS).
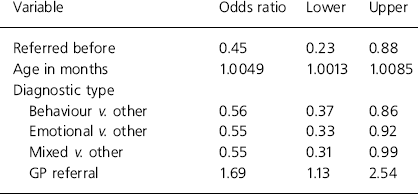
The odds ratios of variables contributing significantly to the survival curve are given in Table 3.
Table 3. 95% CI for odds ratios of significant variables (predicting non-return of CBCL)

| Variable | Odds ratio | Lower | Upper |
|---|---|---|---|
| Referred before | 0.45 | 0.23 | 0.88 |
| Age in months | 1.0049 | 1.0013 | 1.0085 |
| Diagnostic type | |||
| Behaviour v. other | 0.56 | 0.37 | 0.86 |
| Emotional v. other | 0.55 | 0.33 | 0.92 |
| Mixed v. other | 0.55 | 0.31 | 0.99 |
| GP referral | 1.69 | 1.13 | 2.54 |
Non-return of questionnaire is thus associated with no previous contact with the service, older age, a putative diagnosis in the other/uncertain category and GP referral. The individual analyses of these variables failed to demonstrate any significant relationship between any of them and waiting time.
Referrals that had not returned their CBCLs had been waiting longer than those who had returned questionnaires, but not attended appointments (95% Cl odds ratio 0.92-0.97). The logit was reversed when comparing the latter with attenders, so the odds ratio (95% Cl 1.00-1.05) indicated that these cases had also been waiting less time than those who sent in their questionnaires and attended. No other variable was significant in this analysis.
Discussion
The results show that waiting time has a substantial, but complex, impact on intention to attend appointments, which is independent of both referral information and expressed reasons for not wishing to attend. People seem unable to wait longer than 30 weeks, which should therefore be regarded as the point at which the service is effectively closed to routine referrals. The 10% of cases that failed to return questionnaires after less than one month's wait may be transient problems. This is consistent with the waiting time of cases that returned their questionnaires but then did not take up appointments — shorter than both returners and non-returners. The independence of waiting time from other factors is consistent with the clinical impression that no significant changes in referral practice took place, that might have distorted questionnaire return.
Referrals who have previously experienced the service are twice as likely to return questionnaires, while increasing age reduces it. This suggests that fear or suspicion of the service, especially by the patient, remains a problem (Reference Kazdin, Holland and CrowleyKazdin et al, 1997).
Questionnaire return seemed a good measure of intention to attend. Ninety per cent of those returning a questionnaire attended the appointment they were sent; and none of those contacted who had not returned a questionnaire wanted one. The proportion returning questionnaires at up to 20 weeks wait was similar to that proportion attending appointments after a similar wait in a study by Munjal et al (Reference Munjal, Latimer and McCune1994) (25% questionnaire non-return; 22% non-attendance; 0.3 < P < 0.4). Other studies have also found a strong association between families who did not return a questionnaire and those who failed to attend (Reference Joshi, Maisami and CoyleJoshi et al, 1986; Reference Parker and FroeseParker & Froese, 1992). No one complained about the questionnaire being unacceptable, and in the light of the poor quality of information from referral letters it may contribute valuable additional information. The use of an appropriate questionnaire (or other measure of intention) is therefore likely to reduce the number of appointments wasted through non-attendance (Reference Parker and FroeseParker & Froese, 1992; Reference Wenning and KingWenning & King, 1995), without excluding patients inappropriately.
This study identifies information available from the referral letter that can be used to estimate patients' likelihood of attendance. Aside from waiting time, these are increasing patient age, the absence of a common, recognisable diagnosis, no previous experience of the service and GP referral source. Failure to take these factors into account could lead to significant overestimate of the resources needed to clear those patients waiting.
Acknowledgements
We would like to express our thanks to Dr Bode Adesida, now Consultant at the Invicta Health Trust, for this help in coding the data, and Professor John Pearce, of Nottingham University, for his assistance in the use of the Pearce Case Complexity Scale.


eLetters
No eLetters have been published for this article.