In this report, we discuss the journal’s operations from September 1st, 2017 to August 31st, 2018. Near the end we separately review the journal’s operations for the remainder of 2018 from September 1st to December 31st. Being the second year as editors of the American Political Science Review, we continued to work hard to provide both authors and reviewers with a smooth and transparent editorial process. We interpret the continuously rising number of submissions, especially from authors outside the United States, as both a sign of further increasing popularity and international reach as well as a sign that authors appreciate our efforts.
Before we go into detail, we would like to start with expressing our great thanks to Presidents Kathleen Thelen and Rogers Smith, the APSA staff, the APSA Council, and the Publications Committee, as well as to Cambridge University Press for their support and guidance over the past year. We would also like to thank the members of our editorial board, who provided countless reviews and served as guest editors over the last 12 months. Finally, we thank all of the authors who submitted their manuscripts and the reviewers who evaluated them.
EDITORIAL PROCESS AND SUBMISSION OVERVIEW
In the following section, we present an overview on the editorial process and submissions in 2017/18. Similar to previous reports, we discuss the turnaround time, number of submissions, mix of submissions by subfields, approach, internationality and gender of our contributors with respect to the previous year. We retrieved the data from our editorial management system.
Number of Submissions
Between September 1st, 2017 to August 31st, 2018, we received a total of 1,234 submissions, translating to an average of about 3.4 submissions per day. During that same time period in the previous year, the number was about 4% lower or 1,181 submissions. In addition to the new submissions, we also received 233 revisions. Figure 1 shows both the number of new submissions and the total number of received submissions when revisions are included per year. As the graph indicates, following the general trend in previous years, we reached another record in the number of submissions this year.
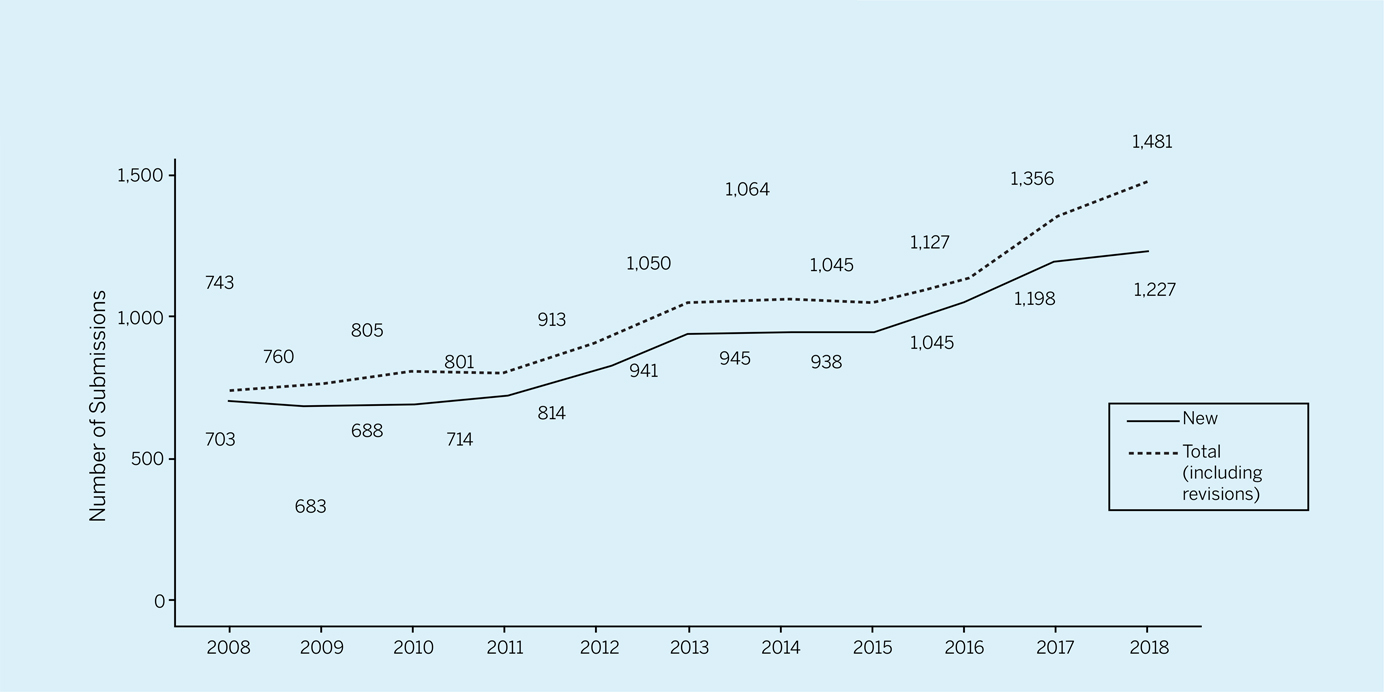
Figure 1 Submissions per Year (by First Receipt Date)
In the previous term, we received 163 submissions of letters, constituting about 13% of the overall submissions (figure 2). In terms of a subfield breakdown, while our letter submissions is not a perfect mirror of normal submissions, they reflect a similar trend. Namely, Comparative Politics makes up 32% of letter submissions (29% of manuscripts), International Relations 10% (15%), Formal 2% (6%), and Other 9% (9%). The main differences are seen in American Politics, which makes up a noticeably larger proportion of letter submission at 28% than manuscript submission at 17%, Methods at 12% compared to 3% of manuscripts, and Normative Political Theory which is 13 percentage points lower than manuscript submissions.
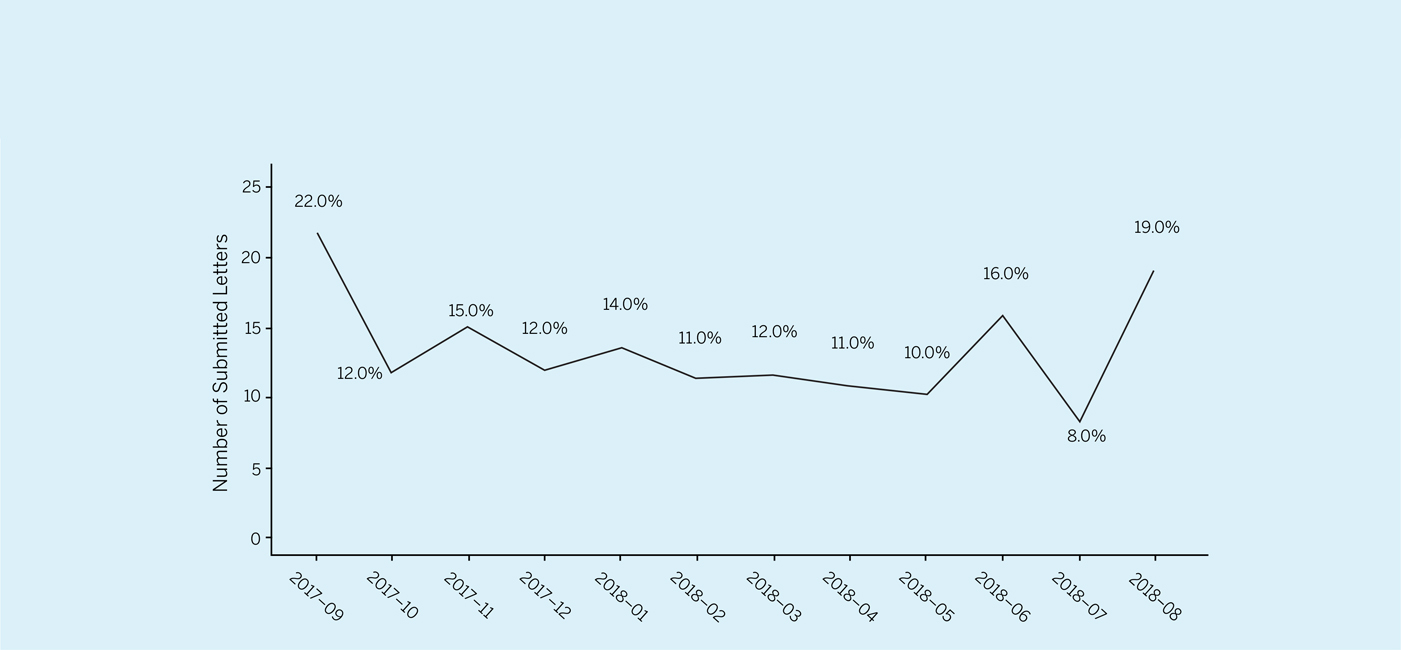
Figure 2 Letter Submissions as % Share of Monthly Manuscripts Received (by First Receipt Date)
Workflow and Turnaround Times
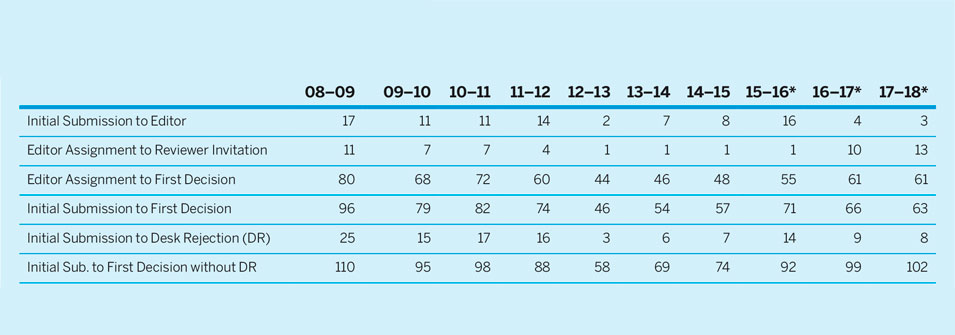
One of our primary goals as an editorial team has been to create an efficient workflow which would reduce the time for a first decision to be rendered even though the number of submissions is increasing. In 2017/18, it took us on average 3 days until a manuscript was first tech-checked after we first received it. The overall duration from first receipt until a manuscript was forwarded to our lead editor, Thomas Konig, was 4 days. In total, we have to send back about 34% of manuscripts for “technical” reasons.
Usually within 1 day, the manuscript was then either summary rejected by our lead editor or passed on to one of the associate editors. From the assignment of an associate editor until the first reviewer was assigned it took on average another 13 days. Alternatively, the associate editors also could summary reject, which took on average seven days after they were assigned.
Table 1 provides details on the development of the turnaround times. It shows the duration between the main stages of the editorial process, from submission to editor assignment, first reviewer invitation, from editor to first decision and submission to first decision (distinguished between whether it was desk rejected or not), starting with the initial submission date. In contrast to the “First Receipt Date,” which is the first time we receive a manuscript, initial submission refers to the date our journal first received a manuscript without it having been sent back to the authors due to formatting issues.
Table 1 Journal Turnaround Times (in days)
* Terms run from July 1 to June 30 of the following year except for the term 15–16 which runs from July 1, 2015 to August 31, 2016 and the terms 16–17 and 17–18 which run from September 1 to August 31.
Despite the increasing number of manuscripts our editorial team has to manage, the time until a first decision decreased from 66 days in 2016/2017 to 63 days in 2017/2018. However, if we exclude desk rejections which are processed rather quickly, the time to first decision increases to about 102 days.Footnote 1
Invited Reviewers
In total, we invited 4,005 reviewers in the term 2017/18. While 839 of the invited reviewers declined, 2,720 reviewers accepted their invitation to review. The remaining reviewers were either terminated after agreeing or a response to our invitation is pending. Based on the reviews completed during the period from September 1st, 2017 to August 31st, 2018, it took the reviewers on average 36 days after invitation to complete their reviews.
Even though we invited an increased number of reviewers during the last editorial term, the share of reviewers who completed their review not only remained constant but even increased slightly (see table 2). We also consulted our editorial board members with respect to 113 distinct manuscripts, sending out a total of 121 invitations.
Table 2 Number of Invited Reviewers and Completed Reviews (By Invitation and Completion Date, respectively)

* Terms run from July 1 to June 30 of the following year except for the term 15–16 which runs from July 1, 2015 to August 31, 2016 and the terms 16–17 and 17–18 which run from September 1 to August 31.
Mix of Submissions
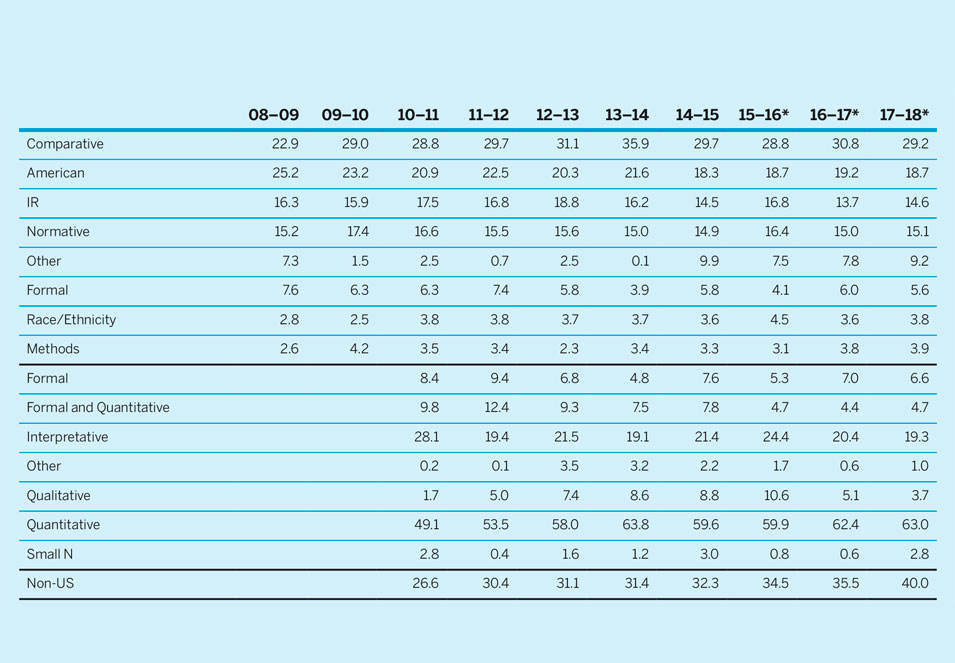
Like in previous terms, the share of submissions is highest from Comparative Politics, followed by American Politics, Normative Political Theory, and International Relations. The first section of table 3 shows the pattern of submissions by subfield over time. Overall, the distribution of submissions across subfields remained stable. The (relatively) biggest changes we see are in the Comparative and American Politics submissions, both slightly decreased to 29% and 19% respectively, while International Relations increased to 14.6%. Submissions in Normative Political Theory and Methods submissions remained stable, but slightly increased to about 15.1% and 3.9% respectively.
Table 3 Mix of Submissions by Subfield, Approach, Location of First Author, and Gender (in percent of total)
* Terms run from July 1 to June 30 of the following year except for the term 15–16 which runs from July 1, 2015 to August 31, 2016 and the terms 16–17 and 17–18 which run from September 1 to August 31.
In terms of the approach of the submitted manuscripts, which are coded by the editorial teamsFootnote 2, the second section of table 3 illustrates that the share of quantitative approaches continues to constitute the largest proportion of submissions at about 63%, while the share of submissions classified as interpretative/conceptual is the second largest with about 19%. The share of formal papers has remained constant around 7%; while the share of qualitative/empirical and Small-N studies submissions has decreased (4% and 3% respectively). Taken together, however, the share of qualitative and Small-N approaches remained constant. Note that codings of submissions in previous terms were non-exclusive (multiple mentions are possible) which make a thorough comparison over time difficult.
Similar to previous reports, we have also gathered data on the internationality of authors. To indicate the diversity and global reach of the Review, we use the share of submissions from institutions of the corresponding author outside the United States (see last row of table 3). During this term, the steady trend of increased non-US submissions rose to 40%, which is the highest since we have data available.Footnote 3 After the US, the countries with the most submissionsFootnote 4 are the United Kingdom (9.2%) and Germany (4.4%).
OUTCOMES
Table 4 displays the outcomes of the first round. The number of desk rejections continued to rise in comparison to the rejections after review as it remains a specific goal of ours to reduce the overall turnaround times for authors and avoid “reviewer fatigue.” Accordingly, the share of desk rejections increased to about 40% during 2017/2018, whereas the share of rejects after review decreased to 51%. In total, we end up with comparable numbers of rejections over time, more than about 90% since 2007. At the same time, we have increased the share of R&Rs from 7% to about 9%.
Table 4 Outcome of First Round (in percent of total)

* Terms run from July 1 to June 30 of the following year except for the term 15–16 which runs from July 1, 2015 to August 31, 2016 and the terms 16–17 and 17–18 which run from September 1 to August 31.
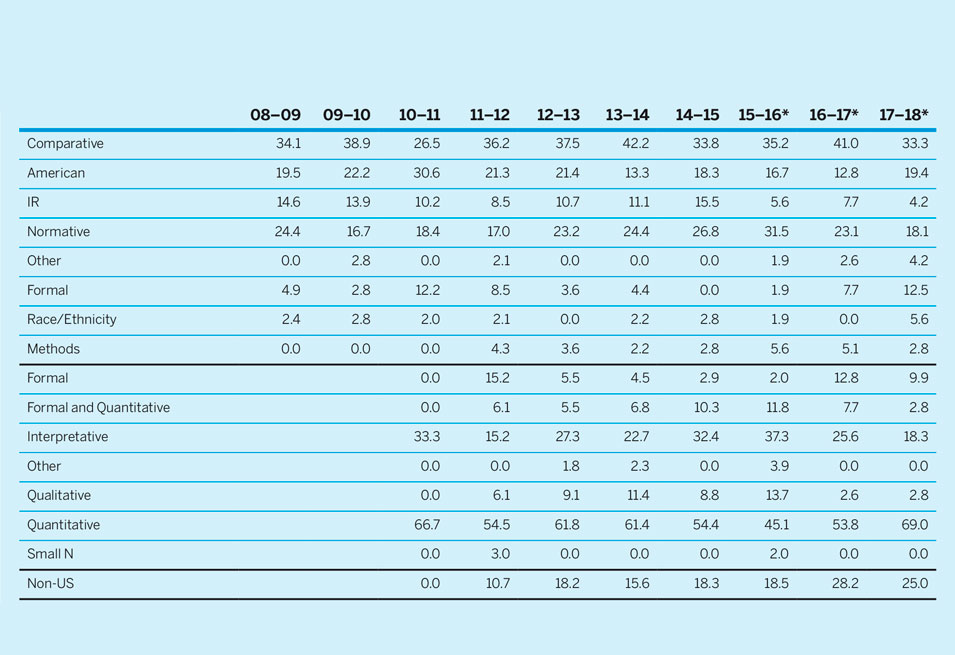
Between September 1st, 2017 to August 31st, 2018 our editorial team accepted 72 manuscripts. Of these 72 articles which we accepted, the highest share with 24 publications were from Comparative Politics, followed by 14 manuscripts from American Politics, and 13 manuscripts from Normative Political Theory. We published nine Formal Theory articles, two methodological contributions, four manuscripts on Race and Ethnicity, three papers from International Relations, and three Other. With respect to our two publication formats, articles and letters, we accepted 11 letters, a share 15% of acceptances which is comparable to the submission share. This data can be seen in table 5.
Table 5 Mix of Accepted Papers by Subfield, Approach, Location of First Author, and Gender (in percent of total)
* Terms run from July 1 to June 30 of the following year except for the term 15–16 which runs from July 1, 2015 to August 31, 2016 and the terms 16–17 and 17–18 which run from September 1 to August 31.
Gender in the APSR
The role of gender in the editorial process of political science journals has received a lot of attention in the past years and stimulated important discussions on publication rates of female and male authors.
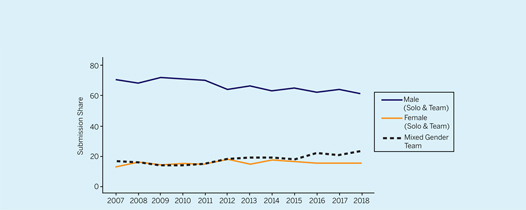
We also examined gender patterns in the recent editorial term. We differentiate between female only, male only, and mixed gender submissions, whereby we aggregate solo and coauthorships by gender.Footnote 5 We were able to classify gender for 1,233 submissions which the APSR received in the last editorial term. 63% of submissions were authored by males (solo or team), while 23% were submitted by mixed gender teams, and 14% by female (solo or team) authors. Put differently, 86% of submissions had at least one male (co)author. Figure 3 shows the general trend over time. Accordingly, the share of male contributions has slightly decreased and is currently compensated by mixed gender team submissions. The share of female authors remains at a low level.
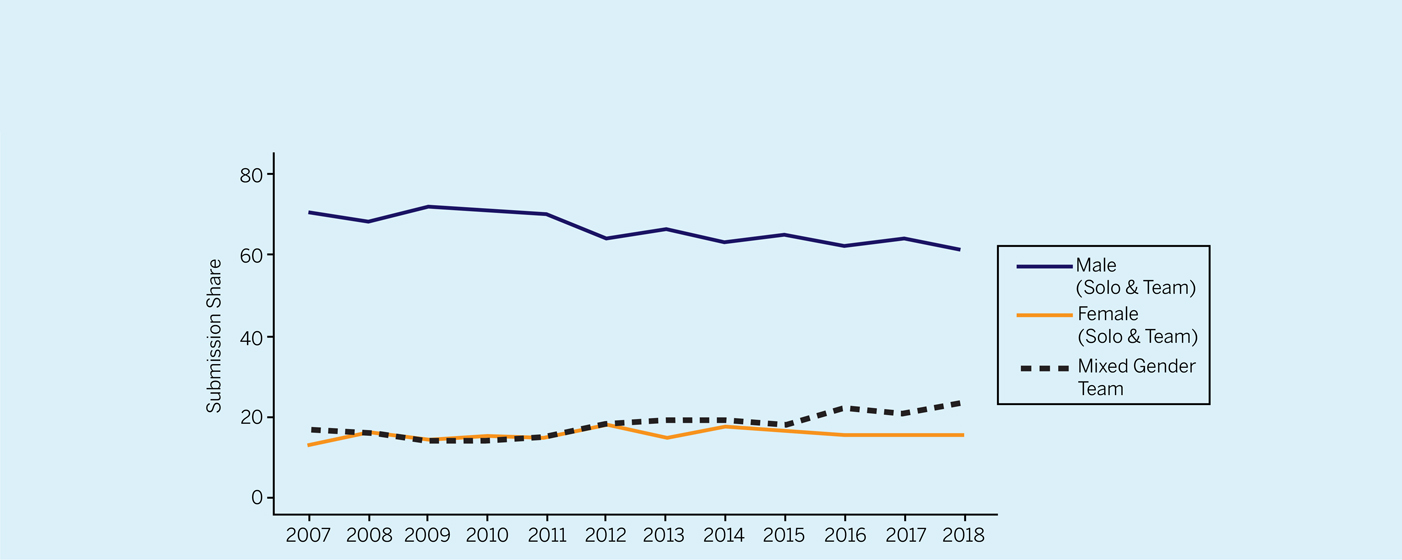
Figure 3 Submissions by Gender for Manuscripts Submitted Between June 2007 and June 2018
Next, we consider our overall decision making process with respect to gender by presenting a breakdown of submissions that received their final decision in the previous term (figure 4). Instead of gender, the main predictor of whether a manuscript gets desk rejected is whether the manuscript is solo- or team-authored. 49% of male and 47% of female solo-authored submissions are desk rejected. In contrast, team submissions experience a lower desk rejection rate (33% female, 35% mixed, and 31% male teams). Regarding final acceptance rates, team-authored manuscripts also seem more successful, with higher success rates for single-sex teams (9% male, 8% female) than mixed gender teams (5%). Yet, solo authored submissions by females had a lower acceptance rate than solo authored work by men (4% solo female vs. 5% solo male). Despite the different proportions of accepted papers among single male and female authors, the number of decisions is not large enough to conclude that this category may fail to predict differences in acceptance rates (p = 0.77).

Figure 4 Percentage Share of Final Decision Outcome by Type of Authorship Between July 2017 and June 2018
* The percentages in the brackets underneath the subplot titles denote the relative manuscript share.
On this regard, out of the 72 submissions that were accepted in the last term, 22 publications were single authored by males and 27 publications were co-authored by full male teams; 14 publications were work by mixed gender teams; 6 publications were single-authored by female scholars and 3 publications were co-authored work by full female teams. For comparison over time, table 6 shows the mix of gender among accepted manuscripts for the past ten years. We are aware of the currently low share of publications authored by females only (both solo and team authored), in particular in comparison to the previous term. We are going to follow this development closely to detect whether this trajectory is systematic.
Table 6 Gender Mix of Accepted Papers (in percent of total)

SUBMISSIONS BETWEEN 9/31/18 and 12/31/18
Between September 1st and December 31st, the APSR received 383 manuscripts, 329 of which were articles (86%) and 54 were letters (14%). 29% of these submissions were Comparative, 18% American Politics, 15% Normative Political Theory, 16% International Relations, 5% Formal Theory, 2% Race/Ethnicity and 11% Other. 38% of submissions received were from corresponding authors whose institutions lie outside the US. Our editors invited 1,338 reviewers, 69% of whom accepted the invitation. In addition, we received 800 completed reviews.
In the first round of decisions, the APSR editors desk rejected 36% of submissions, 58% were rejected after review and 6% were invited for a “Revise and Resubmit.” Overall after multiple revisions, 34 manuscripts were “Conditionally Accepted” and 28 manuscripts were accepted for publication. A breakdown of the accepted manuscripts includes 44% of these accepted manuscripts came from the subfield of Comparative Politics, 0% from Normative Political Theory, and 22% from American Politics. In addition, we accepted one manuscript each from Formal Theory, Methods, Race/Ethnicity, and Other. With 23 manuscripts most of the acceptances took a quantitative approach, zero manuscripts were interpretative/conceptual, three formal approaches and one qualitative approach.
VISIBILITY & TRANSPARENCY
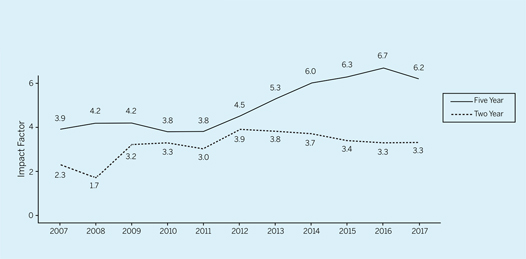
The American Political Science Review remains a leading journal in political science, indicated by the rising numbers of submissions we receive. Nevertheless, we observe a decline in the impact factor over the past years. In figure 5, it becomes visible that the decrease of the two-year impact factor has stopped but did not reverse in 2017. Moreover, the low two-year impact factor in recent years now also affects the five year impact factor for which we observe first drop since 2010. Next year is going to be the first year in which articles accepted by our editorial team will contribute to the calculation of the impact factor. It makes us hopeful and excited to see whether we were be able to not only stop, but also reverse this negative trend and increase the scholarly impact of this great journal.
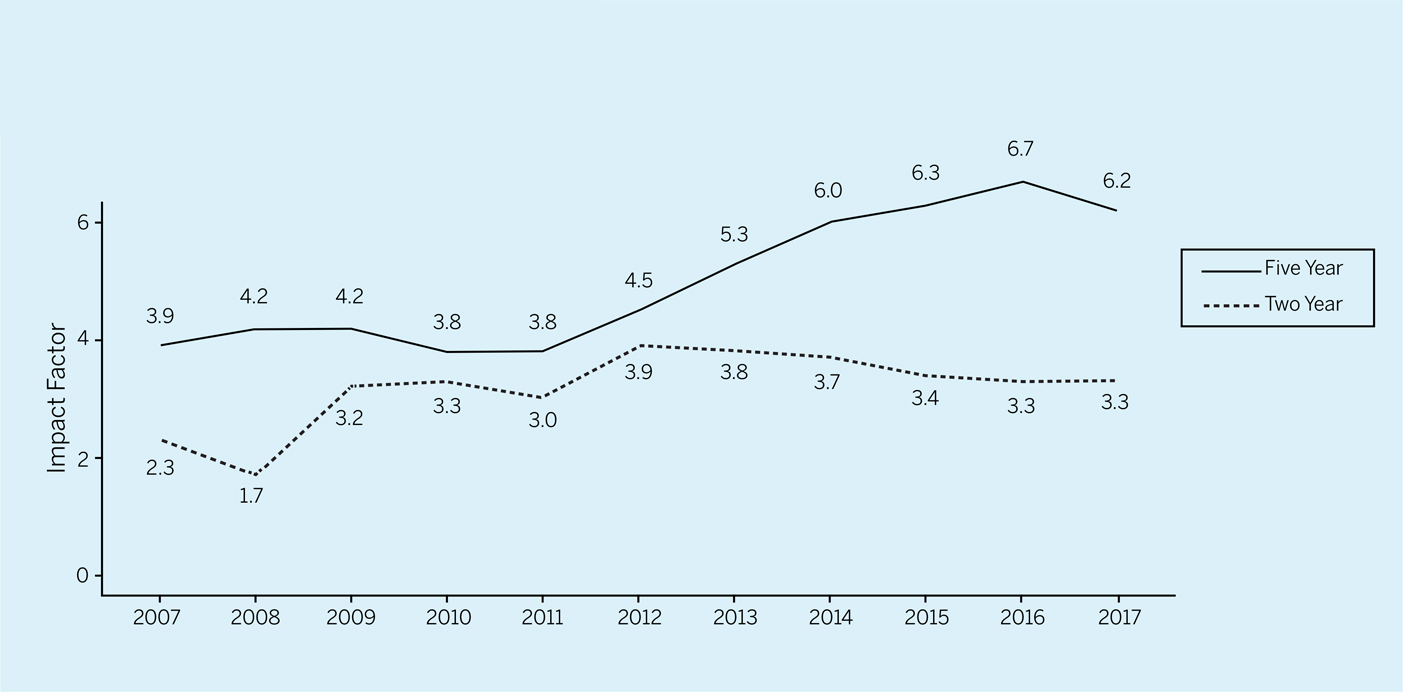
Figure 5 Impact Factor since 2007
On this regard, the availability of the data and materials used in these articles may increase the visibility and attractiveness of APSR publications. In 2015, the UNT team updated the APSR submission guidelines to incorporate DA-RT principles. Ever since, au thors of 158 articles have uploaded and published data and materials to Dataverse,Footnote 6 which include authors who’ve added additional data to their Dataverses to supplement their original work. A further 21 datasets and codes are awaiting publication of their articles before being released. With Dataverse’s inception in 2007, some APSR authors uploaded ex post their data and code, such that the data and materials of 26 articles published before 2007 are available online, the oldest article from 1987. However as several contributors have their own Dataverses, we also maintain a list of APSR articles with their Digital Object Identifier (DOI).
CONCLUSION AND OUTLOOK
Running one of the most prestigious political science journals is both a continuous challenge and an exciting honor and opportunity. While the number of submissions continues to reach a new record each year, we work hard to keep turnaround times low and provide authors with fast and transparent decisions if possible. Our focus as editors is the management of the triangular relationship between authors, reviewers, and the journal. With a 95% rejection rate, it does not come as a surprise that we also receive a lot criticism in our daily work because authors and reviewers may not always follow or agree with our final assessment. Nevertheless, we hope that our service to the discipline helps to push, improve, and promote the excellent work we receive at the American Political Science Review—even if we ultimately cannot publish every manuscript.
To improve and facilitate processes for both editors, authors, and reviewers we already implemented a number of changes in our first editorial term in 2016/17. Among other things, we introduced FirstView and the Letter format. Also the most recent term, 2017/18, was characterized by further improvements such as the roll out of an Overleaf template that makes the uploading of (collaborative) LATEX-created PDFs to Editorial Manager easier.
Moreover, after working through the backlog of manuscripts that were submitted and edited under the previous team in our first year as editors, we were proud to have published manuscripts that were solely handled by our European editorial team in the second year. In sight of the worrying continuous decline of the journal’s impact factor, we are excited and hopeful to receive first feedback how the political science community perceives our work, as it will, for example, be indicated by the upcoming impact factor 2018.
Last but not least, managing the editorial process requires close and constructive partnerships with APSA and Cambridge University Press. We are grateful for the support of all our partners and colleagues throughout the last year. We are looking forward to going into our final year and a half and starting the path for a new editorial team for July 2020.


