Elevated postprandial triacylglycerol concentrations are an important independent risk factor for cardiovascular disease (CVD) in women(Reference Bansal, Buring and Rifai1), but little is known about the effects of meal fat composition on postprandial lipaemia and vascular function in postmenopausal women(Reference Vafeiadou, Weech and Sharma2). The Dietary Intervention and Vascular Function (DIVAS-2) study aimed to investigate the acute consumption of test meals of varying fat composition on postprandial vascular reactivity and associated CVD risk biomarkers in postmenopausal women.
In a double-blind, randomised, cross-over, postprandial study, 32 postmenopausal women consumed sequential test meals rich in saturated fat (butter), cis-monounsaturated fat (olive oil and MUFA-rich spreads) or n-6 polyunsaturated fat (safflower oil and n-6 PUFA-rich spreads) on three separate occasions, each 4–6 weeks apart. Test meals were coded 1–3 for blinding and the sequential meals consisted of breakfast (0 min; 50 g total fat) and lunch (330 min; 30 g total fat). Blood pressure (BP) was determined at 0, 240 and 450 min. Blood samples were collected at 0 min and regularly until 480 min to measure lipids, and markers of insulin resistance.
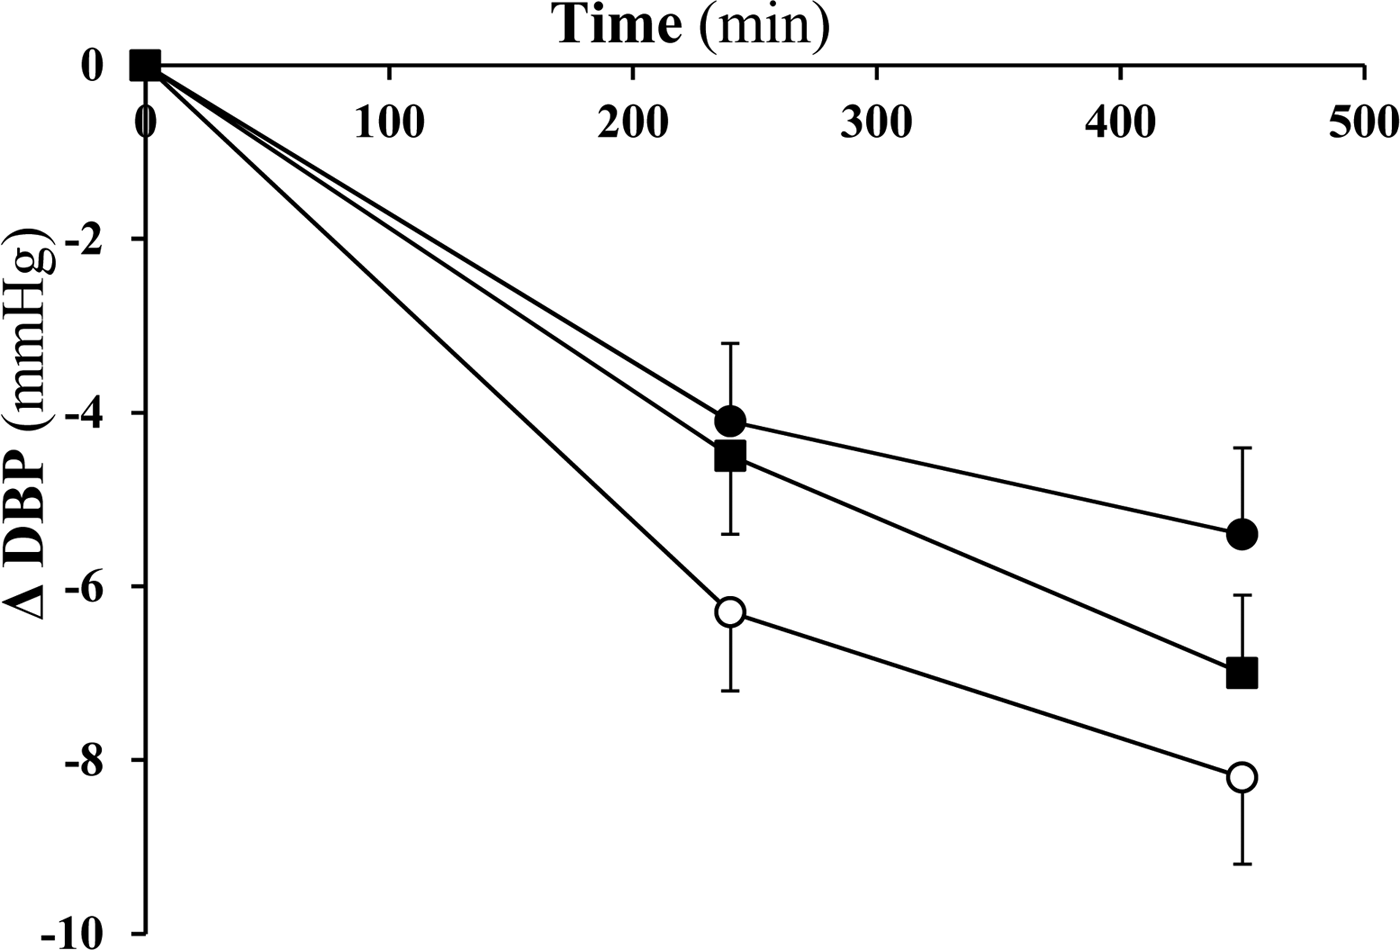
Participants had a mean (SD) age 58 (5) years, BMI 25·7 (4·0) kg/m2, with fasted lipids and glucose within the normal range. Preliminary results showed no significant differences between study visits at baseline. A significant meal*time interaction for the incremental postprandial diastolic BP (DBP) response (incremental area under the curve) (p = 0·007) was observed, with a significantly greater reduction after test fat meal 1 compared with 2 (p = 0·012) (Figure 1). No significant effects of meal fatty acid composition were observed for postprandial triacylglycerol, apolipoprotein B, non-esterified fatty acids, glucose, insulin, systolic BP or pulse pressure.

Fig. 1. Mean ± SEM for the change in postprandial diastolic blood pressure (ΔDBP) following sequential meals enriched in test fat meal 1 (open circles), test fat meal 2 (closed circles) and test fat meal 3 (closed squares).
In conclusion, meal fat composition was shown to have differential effects on the postprandial change in DBP following sequential high-fat meals. These data from part of the DIVAS-2 postprandial study and this trial was registered at www.clinicaltrials.gov as NCT02144454.
This study was funded by United Kingdom Food Standards Agency and Department of Health Policy Research Programme (024/0036). KMR was supported by the Commonwealth Scholarship Commission, UK.


