Closely associated with obesity, non-alcoholic fatty liver disease (NAFLD) is now the most common form of liver disease in the developed world(Reference Loomba and Sanyal1). Hyper-energetic diets containing high levels of saturated fat, refined carbohydrates and sugar sweetened beverages are strongly implicated in NAFLD pathogenesis, and dietary changes aimed at weight loss are the current mainstay of clinical management guidelines(2). However, many primary care and tertiary referral settings lack resources for comprehensive dietary assessment, which patients may also perceive as burdensome. Therefore, the aims of this work were to develop and validate a short food frequency questionnaire (SFFQ) specifically to assess habitual intakes of food items related to NAFLD.
A novel 48-item SFFQ was created using questions from previously validated instruments(Reference Bingham, Welch and McTaggart3, Reference Cleghorn, Harrison and Ransley4), emphasizing foods and nutrients implicated in NAFLD pathogenesis. Fibroscan-diagnosed NAFLD patients were recruited from St James’ Hospital in Dublin, Ireland. Consenting patients underwent a 20-minute interview to complete the SFFQ and were asked to fill in a 4-Day Diet Diary (4DDD) at home for return by mail. Nutrient intakes were analysed using myFood24™ dietary analysis software. Estimated energy requirements (EER) for all participants were calculated using sex-, age- and weight-specific equations coupled with physical activity levels. Spearman correlations and Bland-Altman plots were used to assess the agreement between both instruments.
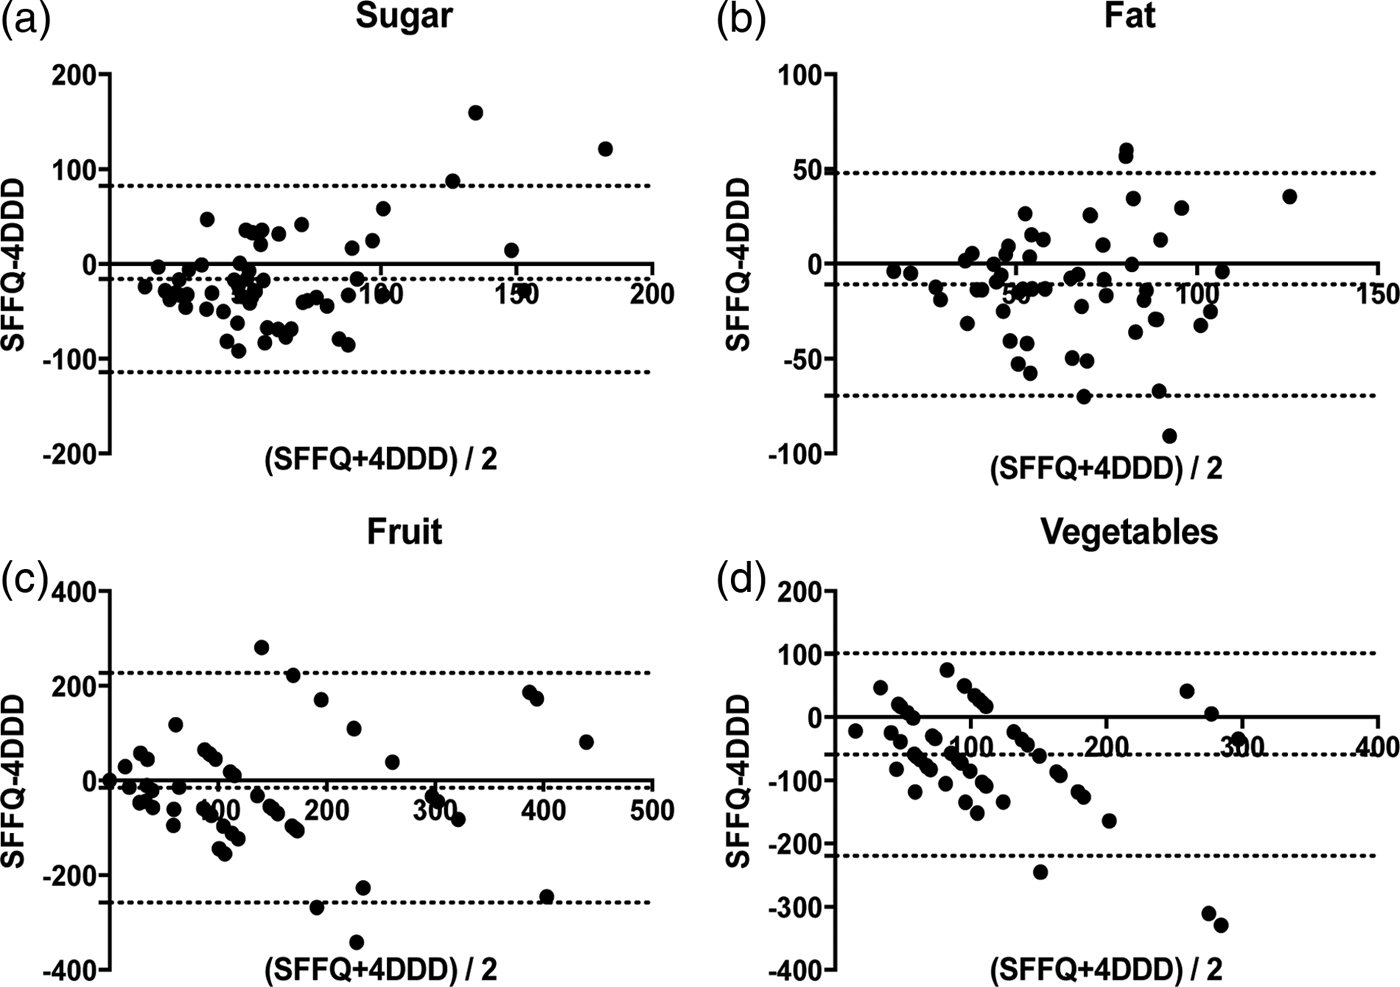
Fifty-five patients completed the SFFQ and the 4DDD; 96 % of participants were overweight or obese, with a median (25th; 75th percentile) BMI of 33·2 kg/m2 (29·3; 36·0). Forty-two patients were diagnosed with simple steatosis, whereas 13 patients had biopsy-proven steatohepatitis. Dietary analyses showed intakes of saturated fat, total sugars, and sodium exceeded recommendations. Energy intakes were noted to be well below EER, with a median intake of 73 % of requirements, suggesting under-reporting. Significant, fair to moderate, correlations were observed for sugar (r = 0·32, P = 0·0182), fat (r = 0·46, P = 0·0005), fruits (0·48, P = 0·0002) and vegetables (r = 0·40, P = 0·0024). While both median difference and Bland-Altman analyses (Fig 1) showed an underestimation of sugar, fat, fruit, and vegetables by the SFFQ compared to the 4DDD, importantly, the Bland-Altman graphs demonstrate that the two methods are comparable, as no more than 3 readings sat external to the 95 % agreement range.

Fig. 1. Bland-Altman plots showing difference vs average for (a) Sugar (b) Fat (c) Fruit (d) Vegetables
In conclusion, we have developed and performed an initial validation of a novel SFFQ for assessing dietary intakes in NAFLD patients. Ongoing work aims to iterate this instrument with further validation against urinary dietary biomarkers.


