Introduction
The ecology of many threatened species of South-east Asia remains poorly described (Xiao et al., Reference Xiao, Hu, Lang, Fang, Guo and Zhang2017). The giant nuthatch Sitta magna is a globally Endangered species restricted to lower montane habitats of south-western China, eastern Myanmar and northern Thailand (BirdLife International, 2020). As with many such species in this region, it has received little conservation attention and the extent of its remaining habitat, a basic requirement for estimating population size, is inadequately defined (Boyce & McDonald, Reference Boyce and McDonald1999). The global population of the giant nuthatch has been estimated to be 1,500–3,800 individuals, and it was recategorized from Vulnerable to Endangered in 2012 (BirdLife International, 2020) because of concerns about the loss and degradation of presumed habitat. Many such Red List assessments may not, however, be reliable (Charra & Sarasa, Reference Charra and Sarasa2018).
Techachoochert et al. (Reference Techachoochert, Gale, Khudamrongsawat and Round2018) estimated the Thai population of the giant nuthatch to be 964 individuals, based on an average density of 1.96 individuals/km2 in 491.8 km2 of mixed coniferous and broad-leaved hill evergreen forest habitat, in which pine Pinus kesiya and trees of the family Fagaceae (e.g. Castanopsis tribuloides, Lithocarpus sootepensis) predominate at 1,192–1,951 m altitude. However, the estimate of available habitat contained a high degree of uncertainty because of a lack of reliable habitat maps. In Myanmar, the giant nuthatch has been confirmed at only one locality in the past 28 years, at Mount Ashae Myin Anauk Myin, southern Shan state, with c. 56 individuals in an 18 km2 forest patch at altitudes of 1,523–2,098 m. Habitat there is dominated by P. kesiya and oak trees, but the area is not within a protected area and is probably threatened by the expansion of tea plantations (Htike et al., Reference Htike, Round, Savini, Tantipisanuh and Gale2021). In China, the giant nuthatch appears to be associated with mature pine forests at altitudes of 1,250–3,400 m (BirdLife International, 2001), with an estimated population of 800–2,000 mature individuals, although the amount of available habitat remains largely unquantified (BirdLife International, 2020).
Thailand comprises 5–10% of the giant nuthatch's global range but potentially one-third of the global population, has habitats with better levels of protection than in adjacent countries and is the only portion of the range for which there is a robust quantitative estimate of the population (Techachoochert et al., Reference Techachoochert, Gale, Khudamrongsawat and Round2018). Despite protection, the Thai population is threatened by forest fragmentation and habitat degradation (Techachoochert et al., Reference Techachoochert, Gale, Khudamrongsawat and Round2018). Implementation of effective conservation and management requires baseline data for population size, distribution and remaining suitable habitat (de Lima et al., Reference de Lima, Sampio, Dunn, Cabinda, Fonseca and Oquiongo2017), but these are currently lacking. Our objectives here are to provide an improved estimate of the size of the Thai population of the giant nuthatch, the location and number of subpopulations, and to clarify the characteristics of suitable habitat and the extent of habitat remaining for this species in Thailand.
Study area
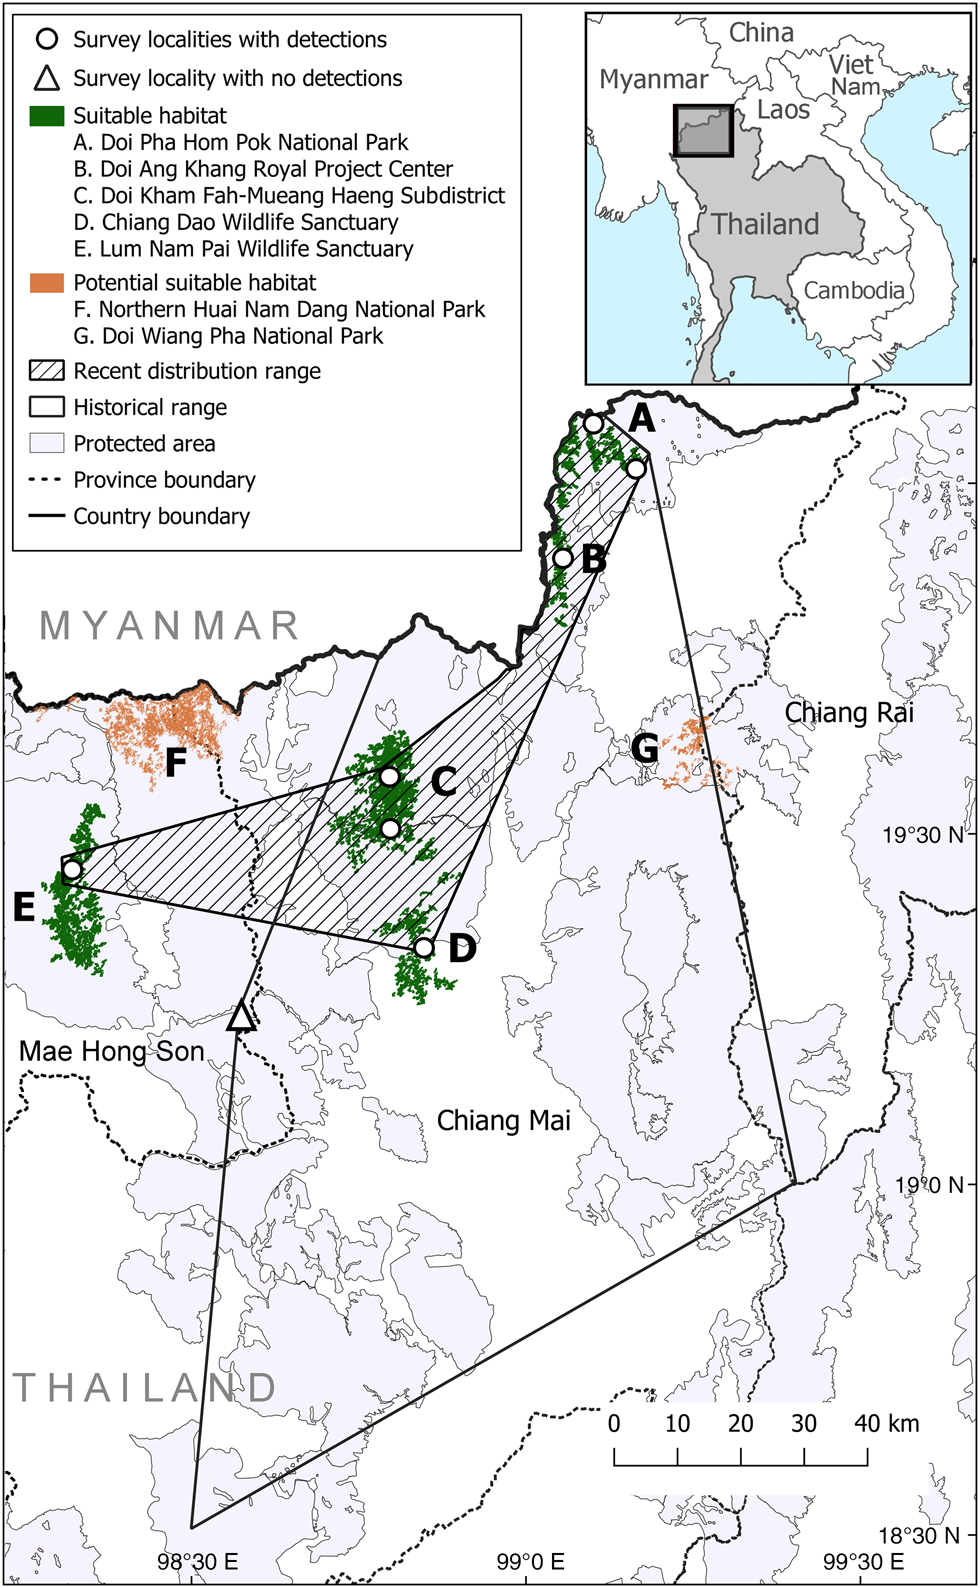
Our study areas were selected based on confirmed records of the giant nuthatch for 1982–2019 (Techachoochert et al., Reference Techachoochert, Gale, Khudamrongsawat and Round2018; eBird, 2019) in potential areas within its known range in the northern provinces of Chiang Mai and Mae Hong Son (Fig. 1). We conducted surveys during the cold-dry season at eight localities within six protected areas (Fig. 1), focusing on lower montane forest habitats where pine P. kesiya commonly occurs and in mature P. kesiya plantations (> 30 years old), as suggested by recent studies (Techachoochert et al., Reference Techachoochert, Gale, Khudamrongsawat and Round2018; Htike et al., Reference Htike, Round, Savini, Tantipisanuh and Gale2021). We established survey points along pre-existing trails, with a total of 67 points at altitudes of 1,166–1,829 m, with 4–12 survey points per locality. Neighbouring points were c. 1 km apart (measured from GPS coordinates), to reduce the likelihood of double-counting.

Fig. 1 Locations surveyed for the giant nuthatch Sitta magna in Thailand during November 2019–February 2020 and the extent of suitable habitat in five areas (A–E) where we detected the species (Table 3), with minimum convex polygons created from the known recent (January 2016–February 2020) and historical range (all records up to 2015; Techachoochert et al., Reference Techachoochert, Gale, Khudamrongsawat and Round2018) of the species.
Methods
Bird surveys
We surveyed during November 2019–February 2020 using point-counts with playback of vocalizations of the giant nuthatch, to estimate local abundance and probability of detection. We sampled each of 67 survey points five times over 5–7 days, with 335 surveys in total. Surveys began at sunrise and finished before 10.30. At each point we played a mix of contact calls and territorial song for 30 seconds followed by 5 minutes of observation, repeated for up to a total of four periods or until there was a detection (following Techachoochert et al., Reference Techachoochert, Gale, Khudamrongsawat and Round2018). We recorded the presence, distance and direction of all individuals heard or seen within a 300-m radius. This is the maximum distance at which we could reliably detect the nuthatch, and is approximately similar to the breeding season home range size of a male giant nuthatch (c. 32 ha), based on telemetry data (Techachoochert et al., Reference Techachoochert, Gale, Khudamrongsawat, Safoowong and Round2021).
Habitat surveys
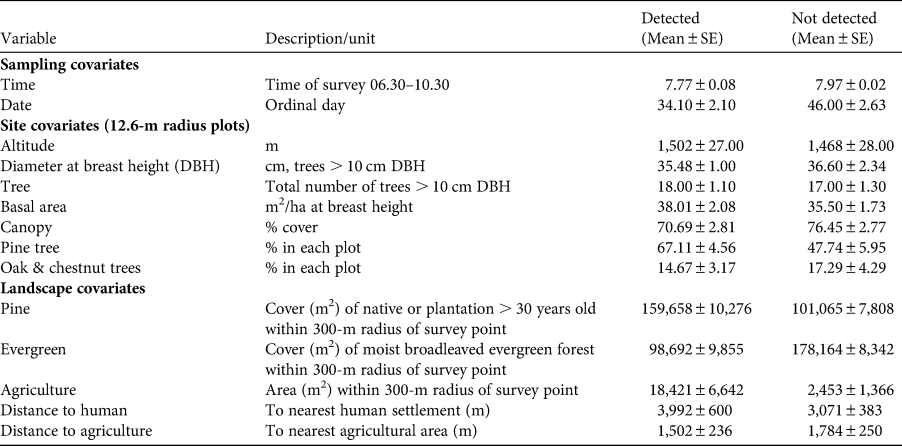
To determine the microhabitat requirements of the giant nuthatch, we measured site and vegetation characteristics using a 12.6-m radius circular plot at each survey point (Htike et al., Reference Htike, Round, Savini, Tantipisanuh and Gale2021; see Table 1 for parameters measured).
Table 1 Descriptions and mean ± SE of covariates at 67 sample points where the giant nuthatch Sitta magna was surveyed in northern Thailand during November 2019–February 2020, to model abundance and probability of detection using N-mixture models.

Using eCognition 8.7 (Trimble Germany, 2011), we created a land-cover map from 6-m resolution SPOT satellite imagery (captured in 2019) of altitudes > 1,100 m to determine broader-scale components of giant nuthatch site selection. We assessed the accuracy of our land-cover map by comparing the classification categories with the true state on the ground and Google Earth images (Google, Mountain View, USA), to create a confusion matrix based on per cent correct classification using 275 reference points; the final map had an overall accuracy of 95%. We then calculated the area of seven forest cover types within a 300-m radius of each survey point: (1) broadleaved evergreen, (2) mixed deciduous, (3) dry dipterocarp, (4) open woodland, (5) mature native pine P. kesiya, which typically occurs in association with broadleaved trees in open lower montane forest (hereafter mature pine forest), (6) mature P. kesiya plantation interspersed with a few large native broadleaved trees, and (7) mixed P. kesiya plantation–deciduous forest. Distances to the nearest human settlements and agricultural areas were estimated from the survey points using ArcGIS 10.6.1 (Esri, Redlands, USA).
Abundance models and detection probability
We used N-mixture models to estimate abundance and detection probability of the giant nuthatch (Kery & Royle, Reference Kery and Royle2015). We assumed the population was geographically and demographically closed within the replicates in our short survey periods at a given site.
The covariates used in the models were those that previous data suggested could influence the abundance and detection probability of the giant nuthatch (Table 1). We combined mature P. kesiya forest and mature P. kesiya plantation older than 30 years (Table 1) because only 8% of the surveyed area contained mature native pine habitat and in a preliminary analysis we found no support for mature pine forest alone affecting giant nuthatch habitat selection. We included time and date of survey as sampling covariates (Table 1). All covariates were standardized using the scale function in R 4.0.2 (Crawley, Reference Crawley2005; R Core Team, 2020). To avoid multicollinearity among covariates, we tested site and landscape covariates using a pairwise-correlation matrix (Spearman rho, ρ) and one variable of any pair with a correlation coefficient ≥ 0.6 was removed (Zuur et al., Reference Zuur, Ieno and Elphick2010) and not included in the same model. Thus, we excluded the area of broadleaved evergreen forest because it was highly negatively correlated with the area of pine forest (ρ = −0.87).
The upper bound K, used to approximate an infinite summation in the N-mixture likelihood models, was set at 100 (100, 150, 200 and 300 were tested); this had acceptable bias that did not affect model results (Couturier et al., Reference Couturier, Cheylan, Bertolero, Astruc and Besnard2013). The global model was tested for goodness of fit using Pearson's χ 2 test (MacKenzie & Bailey, Reference MacKenzie and Bailey2004), and we used a parametric bootstrap approach to simulate 1,000 bootstrap samples for the assessment of fit. The bootstrap probability for the global model was 0.93, suggesting that it provided an adequate fit to the data. The value of ĉ, the measure of overdispersion, was 0.85; we then modelled abundance using a Poisson distribution.
For modelling point count data, we first compared the constant model and three candidate models with sampling covariates. We then included sampling covariates from the best-supported model for detection into the abundance models. We generated 30 models for preliminary analysis and then, with selected variables that were expected to influence habitat preference of the giant nuthatch, we generated a final set of 17 models (Table 2). We assessed this model set to examine variables associated with giant nuthatch abundance (λ) and detection probability (p). For model selection, we used the differences in the Akaike information criteria (ΔAIC) and AIC weight (w i; Burnham & Anderson, Reference Burnham and Anderson2002). We used model averaging to estimate beta coefficients across models that represented a cumulative weight of 95% of the total AIC weight (Burnham & Anderson, Reference Burnham and Anderson2002). We considered the evidence of variables influencing the abundance estimate using 85% confidence intervals (Arnold, Reference Arnold2010). Finally, density of the giant nuthatch was estimated by dividing the abundance estimated from the best supported model by the sampled area, 67 300-m fixed radius survey points (18.94 km2). We performed the N-mixture analysis using the unmarked package (Fiske & Chandler, Reference Fiske and Chandler2011) and model averaging using the AICcmodavg package (Mazerolle, Reference Mazerolle2013), both in R.
Table 2 Results for modelling of giant nuthatch abundance at 67 sample points in northern Thailand (Table 1) surveyed during November 2019–February 2020.

1 Number of parameters.
2 Akaike's information criterion.
3 Difference of AIC from the best-fit models.
4 Model weights.
Population estimates and the extent of habitat remaining
From our habitat map, classified using satellite imagery, we considered habitats at altitudes of 1,166–1,753 m as suitable, based on the lowest and the highest elevations at which we detected the giant nuthatch during our surveys. However, in an additional analysis we also included elevations up to 1,951 m, based on reliable recent records (P. Round, pers. comm., 2016), although we did not survey these areas because of logistical constraints.
To estimate the current population of the giant nuthatch in Thailand, we used 32 ha as a minimum habitat patch size, based on the approximate home range size of a single male giant nuthatch (Techachoochert et al., Reference Techachoochert, Gale, Khudamrongsawat, Safoowong and Round2021). However, if these patches (with characteristics derived from the above models) were < 32 ha but located in a forest matrix close to each other to create a patch > 32 ha (< 640 m, the approximate diameter of 32 ha circle), this was also considered suitable habitat. Forest areas with no detections of the giant nuthatch for > 20 years based on historical records and our surveys were not considered available habitat. We estimated the population size of the giant nuthatch in Thailand by calculating the available suitable habitat remaining and multiplying this by the average nuthatch density derived from our surveys.
Results
Abundance and detection probability
We recorded a total of 118 detections of the giant nuthatch in seven localities at 36 of the 67 survey points across 1,166–1,753 m altitude, mostly single individuals (82%) or pairs (15%), with only occasionally three birds (3%). We did not find the giant nuthatch at one locality, Khun Mae Ya Watershed Management Unit (Fig. 1).
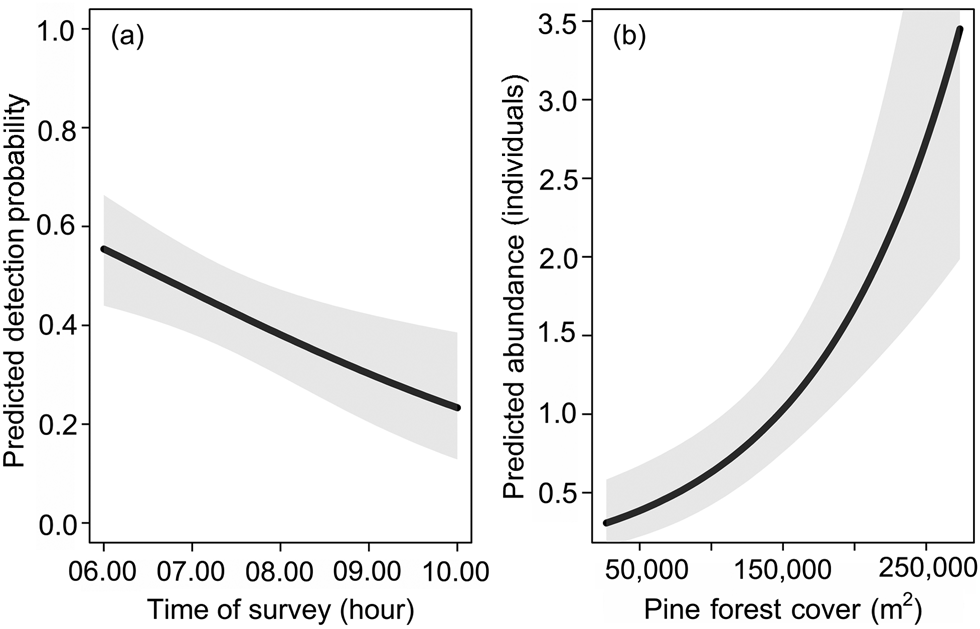
From four models generated to assess the effect of sampling covariates on detection probability, we found that time of survey was the only variable with strong support. The model suggested detection probability was greater earlier in the morning (β = −0.36, 95% CI −0.60–−0.12; Fig. 2). Thus, to evaluate the influence of potentially important habitat variables on giant nuthatch abundance, we modelled time of survey together with site and landscape covariates.

Fig. 2 (a) Predicted detection probability relative to survey time, and (b) predicted abundance relative to pine forest cover within 300 m of survey points for the giant nuthatch. Data based on a total of 67 survey points in eight localities in northern Thailand (Fig. 1). Mean predicted estimates are in black and their 95% confidence intervals in light grey.
From a final set of 17 models, we found that the model containing only the area of pine forest cover was the top-ranked model, although three other models had strong support (ΔAIC < 2) including amount of pine forest in combination with basal area and canopy cover (Table 2). These top four models accounted for 100% of the cumulative AIC weight (Table 2). Following model averaging to estimate the coefficients of variables included in these top four models, the only variable with a significant positive influence on giant nuthatch abundance was area of pine forest (β = 0.59, 85% CI 0.40–0.78; Fig. 2). The amount of broadleaved evergreen forest cover was significantly negatively associated with giant nuthatch abundance (β = −0.79, 85% CI −1.01–−0.58). We found limited evidence to support the influence of basal area (more nuthatches in sites with greater basal area) (β = 0.21, 85% CI −0.01–0.43) and per cent canopy cover (more nuthatches in sites with a lower per cent canopy cover; β = −0.19, 85% CI −0.41–0.03). Hence, estimated abundance and detection probability of the giant nuthatch were derived from the top-ranked model (Table 2). The total abundance of the giant nuthatch within the sampled area of 18.94 km2 was estimated to be 70 individuals (95% CI 48–104), a density of c. 3.7 individuals/km2 (95% CI 2.5–5.5) with a detection probability of 0.41 (95% CI 0.36–0.47).
Population estimates and extent of habitat remaining
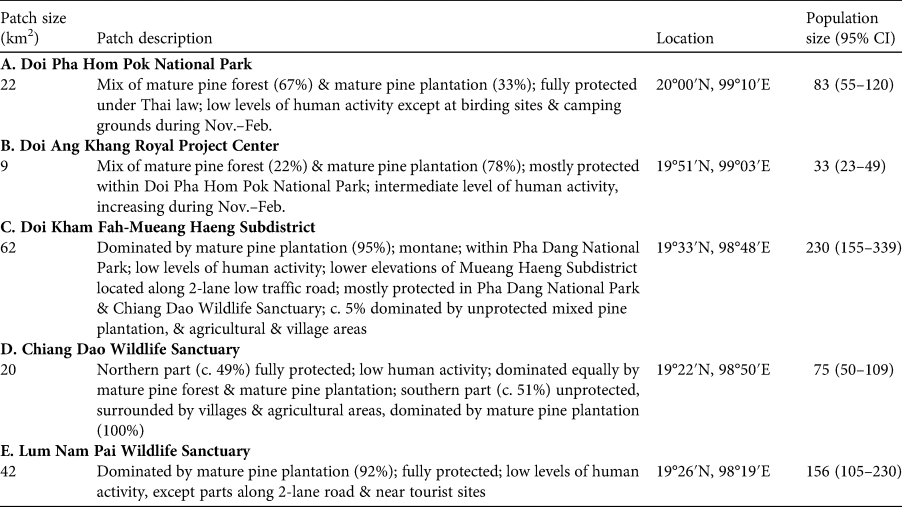
We created a map of suitable habitat (Fig. 1) comprising mature pine forest and mature pine plantation at altitudes of 1,166–1,951 m based on the pine forest model. We excluded Khun Mae Ya Watershed Management Unit from the estimate because we did not detect the giant nuthatch there and the species had not been detected in multiple other surveys (Techachoochert et al., Reference Techachoochert, Gale, Khudamrongsawat and Round2018). Suitable habitat for the giant nuthatch at 1,166–1,753 m was 155 km2. Assuming suitability is uniform over this area, this gives an estimated population size of 574 (95% CI 388–848). However, if the upper elevation limit of the giant nuthatch in Thailand is 1,951 m, the estimated habitat remaining is 156 km2 and the estimated population 578 (95% CI 391–854). Based on the extent of this suitable habitat, we classified the Thai population of the giant nuthatch into five subpopulations (Fig. 1, Table 3).
Table 3 The five major localities of the current range of the giant nuthatch in northern Thailand (A–E correspond to lettering in Fig. 1), surveyed during November 2019–February 2020, with the estimated population in each.

Discussion
Distribution and population estimate
Our findings indicate that the giant nuthatch is more restricted than it was historically, having disappeared from most of the southern and eastern parts of its Thai range (Fig. 1). However, we discovered two previously unknown locations, one within its known historical range at Doi Kham Fah and another beyond its historical western range in Lum Nam Pai Wildlife Sanctuary (Fig. 1). As in other recent surveys we did not detect the species at Khun Mae Ya Watershed Management Unit. Although pine and native habitat have regenerated since the 1970s in this area, P. kesiya and a mixture of other native and pioneer broadleaved trees (e.g. Prunus cerasoides, Betula alnoides; Kiianmaa, Reference Kiianmaa2005) have been planted densely in the past 2 decades. This could have created a dense, wet and closed canopy evergreen forest less suitable for the giant nuthatch and may account for the disappearance of the species from some parts of its historical range.
Our estimate of population density (3.7 individuals/km2) was approximately twice that estimated by Techachoochert et al. (Reference Techachoochert, Gale, Khudamrongsawat and Round2018; 1.96 individuals/km2) who sampled a wider range of habitats. Our estimate was, however, similar to a single-site study in Thailand of 3.94 (95% CI 2.15–7.22) individuals/km2 (Techachoochert et al., Reference Techachoochert, Gale, Khudamrongsawat, Safoowong and Round2021). Our estimate was well below the lower value (7.69 individuals/km2) estimated for a single 18 km2 forest patch (Mount Ashae Myin Anauk Myin) in Myanmar (Htike et al., Reference Htike, Round, Savini, Tantipisanuh and Gale2021). Although our estimated density of the species was higher than that determined by Techachoochert et al. (Reference Techachoochert, Gale, Khudamrongsawat and Round2018), our total population estimate and estimated area of suitable habitat for Thailand were lower, with 578 individuals in 156 km2 of suitable habitat versus 964 individuals in 492 km2 of suitable habitat. Techachoochert et al. (Reference Techachoochert, Gale, Khudamrongsawat and Round2018) noted their estimate was potentially high as they did not have access to reliable habitat cover maps.
Suitable habitat characteristics and the extent of habitat remaining
Our findings support quantitative and descriptive studies suggesting that habitats associated with mature pine have a strong influence on the abundance of the giant nuthatch (BirdLife International, 2020; Htike et al., Reference Htike, Round, Savini, Tantipisanuh and Gale2021). We found that mature pine forest and mature pine plantation habitat had a positive influence on estimated abundance, and broadleaved evergreen forest a negative association. Our findings of a limited negative association with canopy cover and a limited positive association with basal area are also consistent with other studies (Techachoochert et al., Reference Techachoochert, Gale, Khudamrongsawat and Round2018; Htike et al., Reference Htike, Round, Savini, Tantipisanuh and Gale2021) that recognized the importance of mature, well-spaced trees. Taken together, the available data suggest that the giant nuthatch prefers dry forests with an open canopy and a large amount of mature pine trees (either native or planted), and other large diameter broadleaved trees. We did not detect the giant nuthatch in dense, wet, closed canopy evergreen forest habitats. Overall, these preferences of the giant nuthatch are probably related to the availability of the species’ preferred foods and of foraging and nesting substrates (Thibault et al., Reference Thibault, Prodon, Villard and Seguin2006).
Habitat suitable for the giant nuthatch in Thailand lies mostly (> 90%) within protected areas (Table 3). Additionally, our habitat map indicates that two potentially suitable areas not included in our estimate of available habitat merit further assessment (Fig. 1). These include c. 98 km2 in the northern section of Huai Nam Dang National Park, mostly (> 90%) mature pine plantation but located outside the known recent and historical range of the species, and c. 23 km2 within Doi Wiang Pha National Park, for which there are no recent records but which lies within the historical range of the species and comprises > 95% cover of mature pine forest (Fig. 1).
Conservation implications
In Thailand most habitat suitable for the giant nuthatch is within protected areas. Moreover, P. kesiya is the main species used in the Thai Royal Forest Department's reforestation programme (Kiianmaa, Reference Kiianmaa2005), suggesting it may be possible to restore and maintain giant nuthatch habitat. This could indicate that Thailand's population, despite being small, may be more secure than the population in Myanmar where the only recently confirmed site lies outside the protected area system, although large areas of potential habitat have not been surveyed (Htike et al., Reference Htike, Round, Savini, Tantipisanuh and Gale2021). The extent of available habitat in China, although potentially greater than in Thailand, remains mostly unquantified. Our findings suggest that the giant nuthatch should retain its Red List categorization as Endangered until its population and the remaining habitat in Myanmar (in particular in Shan state) and China are quantified. We recommend further investigation of the habitat remaining for the giant nuthatch in these regions. Additional studies on the reproduction and survival of the giant nuthatch in mature pine plantation and pine forest are required to improve our understanding of the capacity of these habitats to support viable populations.
Severe, uncontrolled forest fires linked to human influence and climate change are potential major threats to the pine forest habitat of the giant nuthatch (Oberhauser, Reference Oberhauser1997). Long-term research on the threat of forest fires, which have been more frequent and more severe since 2010 (Forest Fire Control Division, 2020), is also necessary for the long-term conservation and management of these habitats.
Acknowledgements
We thank the chiefs and staff of the protected areas for accommodation and support, M. Pringprao, V. Sophonrat and N. Sukumal for their help in the field, P. Round for comments on the text, D. Ngoprasert for statistical advice, and King Mongkut's University of Technology Thonburi for a Postdoctoral Fellowship for DK. This research was supported by the National Science and Technology Development Agency (P-19-50291) and The Rufford Foundation (29986-1).
Author contributions
Project design, fieldwork: all authors; data analysis and interpretation: DK; habitat classification: RA; writing: DK, assisted by all other authors.
Conflicts of interest
None.
Ethical standards
This research abided by the Oryx guidelines on ethical standards and did not involve human subjects, experimentation with animals or collection of specimens.


