Introduction
There is increasing recognition of the important roles played by apex predators in maintaining ecosystems and sustaining biodiversity. Predators regulate the abundance of herbivore populations (Sih et al., Reference Sih, Crowley, McPeek, Petranka and Strohmeier1985; Schoener, Reference Schoener, Kawanabe, Cohen and Iwasaki1993; Menge, Reference Menge1995, Reference Menge1997), their diversity in an ecosystem potentially affects prey density (Lima, Reference Lima1998; Sih et al., Reference Sih, Englund and Wooster1998), they control meso-predator populations (Ritchie & Johnson, Reference Ritchie and Johnson2009), and they play a distinct functional role in the cascading effect at each trophic level (Polis & Hurd, Reference Polis, Hurd, Polis and Winemiller1996; Polis & Strong, Reference Polis and Strong1996; Polis, Reference Polis1999).
Himalayan and subtropical ecosystems are unique in being dominated by only a few species of predators. The snow leopard Panthera uncia, clouded leopard Neofelis nebulosa, Himalayan brown bear Ursus arctos isabellinus, Asiatic black bear Ursus thibetanus and Himalayan wolf Canis lupus himalayensis occur in the Himalayan and trans-Himalayan rangeland (Dinerstein & Mehta, Reference Dinerstein and Mehta1989; Fox et al., Reference Fox, Sinha, Chundawat and Das1991; Mishra, Reference Mishra1997; Sathyakumar, Reference Sathyakumar2001; Mishra et al., Reference Mishra, Madhusudan and Datta2006, Sathyakumar et al., Reference Sathyakumar, Bashir, Bhattacharya and Poudyal2011), whereas the tiger Panthera tigris and leopard Panthera pardus occur in the subtropical Terai landscape (Smith et al., Reference Smith, McDougal, Ahearn, Joshi, Conforti, Seidensticker, Christie and Jackson1999). The snow leopard and tiger are categorized as Endangered on the IUCN Red List (Jackson et al., Reference Jackson, Mallon, McCarthy, Chundaway and Habib2008; Goodrich et al., Reference Goodrich, Lynam, Miquelle, Wibisono, Kawanishi and Pattanavibool2015), the leopard, clouded leopard and Asiatic black bear are categorized as Vulnerable (Garshelis & Steinmetz, Reference Garshelis and Steinmetz2016; Grassman et al., Reference Grassman, Lynam, Mohamad, Duckworth, Bora and Wilcox2016; Stein et al., Reference Stein, Athreya, Gerngross, Balme, Henschel and Karanth2016), and the statuses of the Himalayan wolf and the Himalayan brown bear have not yet been assessed (IUCN, 2016). The remoteness, harsh environment, hilly terrain and inaccessibility of most of the landscape have resulted in inadequate knowledge about the biology of these carnivores in this landscape, especially compared to those in peninsular India (Karanth & Sunquist, Reference Karanth and Sunquist1995; Karanth & Nichols, Reference Karanth and Nichols1998; Karanth et al., Reference Karanth, Chundawat, Nichols and Kumar2004). Several camera-trap studies have attempted to estimate carnivore numbers in various parts of the Himalaya, based on unique pelage patterns (Jackson et al., Reference Jackson, Roe, Wangchuk and Hunter2006; Datta et al., Reference Datta, Anand and Naniwadekar2008; Wang & MacDonald, Reference Wang and Macdonald2009; Sathyakumar et al., Reference Sathyakumar, Bashir, Bhattacharya and Poudyal2011), but with limited success because of harsh environmental conditions and low-density dispersal over large home ranges (Jackson et al., Reference Jackson, Roe, Wangchuk and Hunter2006).
Non-invasively collected samples, such as faeces, facilitate ecological, genetic and physiological studies on elusive species without the need to see or disturb the animals. Biomolecules such as DNA or hormone metabolites obtained from faecal samples are informative and can be used to investigate movement (Reddy et al., Reference Reddy, Gour, Bhavanishankar, Jaggi, Hussain, Harika and Shivaji2012), mating behaviour (Gour et al., Reference Gour, Bhagavatula, Bhavanishankar, Reddy, Gupta and Sarkar2013; Reddy et al., Reference Reddy, Ramesh, Sarkar, Srivastava, Bhavanishankar and Shivaji2016), and physiological stress (Bhattacharjee et al., Reference Bhattacharjee, Kumar, Chandrasekhar, Malviya, Ganswindt and Ramesh2015). Genetic tools along with surveys and remote sensing or geographical information systems are promising methods for accurate identification of samples and investigating trends of cryptic carnivores at high altitudes and in harsh conditions. Buxa Tiger Reserve in the north of West Bengal includes both the Himalayan and subtropical zones. The terrain in the Reserve is mostly rugged, and some paths are not accessible by motorized vehicles. We used faecal samples to examine the tiger's feeding habits and habitat selection strategies within the protected area, using molecular and geographical information system tools.
Study area
Buxa Tiger Reserve (henceforth Buxa), in West Bengal, India, comprises 390.6 km2 of core protected area and a 367.3 km2 buffer zone. It borders Bhutan in the north and Assam in the east (Fig. 1), with tea gardens, agricultural fields and village settlements along its western and southern boundaries. The Reserve lies broadly within the Indo-Malayan biogeographical region, which includes three major eco-geographical zones: Central Himalayas, Terai and Bramhaputra flood plains. It spans 60–1,904 m altitude, with an annual temperature range of 12–32°C and estimated mean annual rainfall of 4,100 mm. The habitat is primarily tropical moist-deciduous forest, and sal Shorea robusta is the dominant tree species. There are 37 villages inside the Reserve and 33 tea gardens around its periphery.

Fig. 1 Buxa Tiger Reserve, West Bengal, India, showing the locations of open forest, moderately dense forest and very dense forest.
Methods
Sample collection and prey identification
Trained Buxa forest personnel and volunteers collected faecal samples of large carnivores along forest roads and paths in 2–3 sessions during January–April each year during 2010–2013. A gap of c. 1 month was maintained between consecutive collections in each year. All samples were collected in clean, self-adhesive plastic bags containing silica beads, and geographical locations were recorded with a global positioning system. Samples were transported to the laboratory within 1 month, where they were stored at –20°C until analysis. We extracted DNA from visibly fresh faecal samples by the guanidinium thiocyanate–silica method (Reed et al., Reference Reed, Tollit, Thompson and Amos1997) in sets of 10 samples, with an extraction control to monitor for contamination, in a dedicated room free of polymerase chain reaction (PCR) products, to minimize cross-contamination. DNA was not isolated from very dry samples or from samples with fungal growth. Subsequently, all extracts were screened with a tiger-specific PCR assay (Bhagavatula & Singh, Reference Bhagavatula and Singh2006), and prey analysis was conducted on tiger-positive samples.
Tiger faecal samples were washed in a sieve to separate hair and other tissue remains from faecal debris. Prey hair remains undamaged in carnivore faecal samples and can therefore be used to identify the prey species consumed (Mukherjee et al., Reference Mukherjee, Goyal and Chellam1994; Ramakrishnan et al., Reference Ramakrishnan, Coss and Pelkey1999; Biswas & Sankar, Reference Biswas and Sankar2002; Sankar & Johnsingh, Reference Sankar and Johnsingh2002; Bagchi et al., Reference Bagchi, Goyal and Sankar2003). At least 20 individual hairs were picked at random from each tiger-positive faecal sample, to prepare permanent slides (Bahuguna et al., Reference Bahuguna, Sahajpal, Goyal, Mukherjee and Thakur2010). Hair characteristics such as width, cuticular and medullary structures, and medulla to hair width ratio were recorded by microscopic observation. Results were compared with Bahuguna et al. (Reference Bahuguna, Sahajpal, Goyal, Mukherjee and Thakur2010) and with our reference samples.
Analysis of prey occurrence in the tiger's diet
We tested the stability of the percentage frequency of occurrence of prey in the tiger's diet by randomizing and boot-strapping all samples 999 times in Estimate S v. 8.0.0 (Colwell, Reference Colwell2006). We plotted the percentage frequency of each prey species in the diet cumulatively, at an interval of five faecal samples, and continued the process until all faecal samples were included (Bagchi et al., Reference Bagchi, Goyal and Sankar2003). We calculated biomass and number of prey individuals consumed by tigers, using Ackerman's equation, Y = 1.980 + 0.035X, where Y = mass of prey (kg) per tiger-positive faecal sample, and X = mean mass of each prey species (Ackerman et al., Reference Ackerman, Lindzey and Hemker1984).
Prey preference analysis
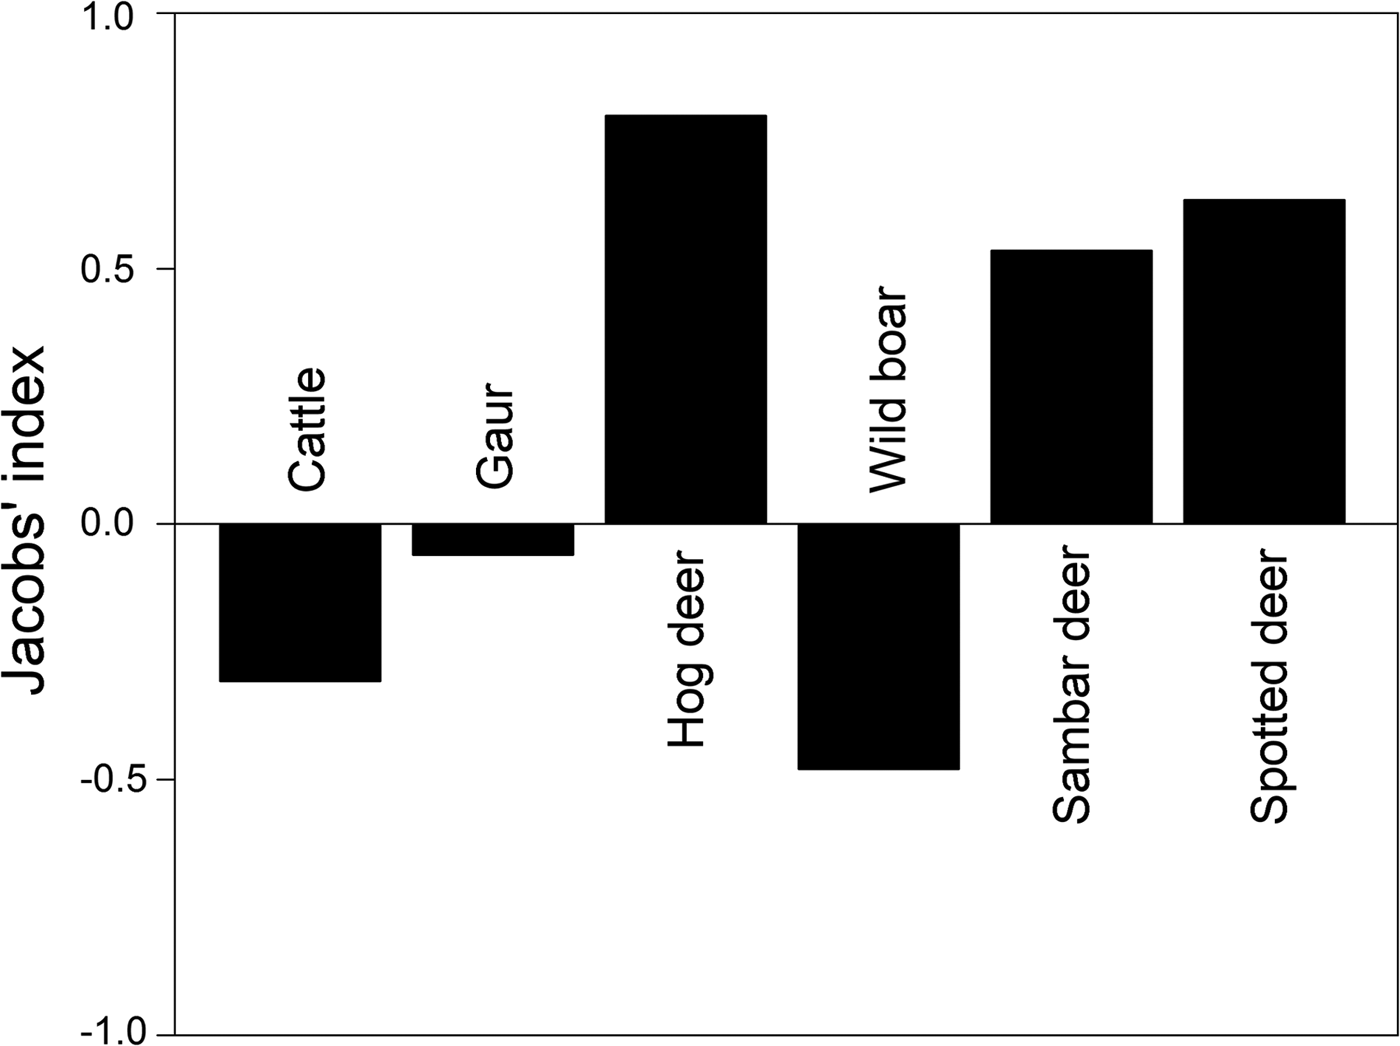
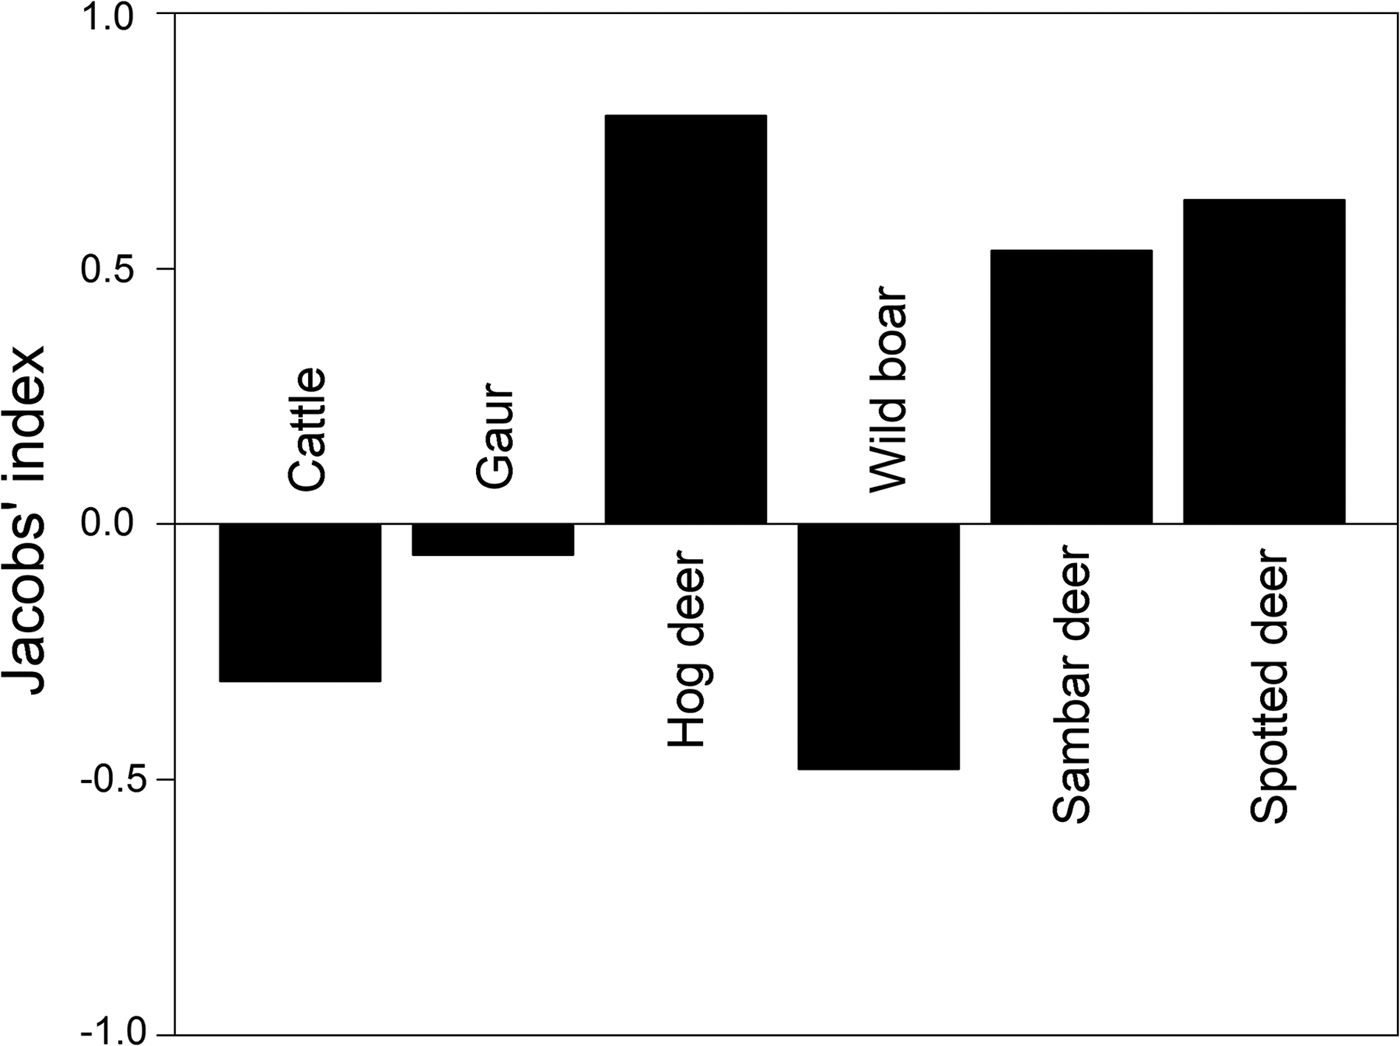
Prey preference can be calculated as a function of availability for utilization/consumption of prey. We obtained information on large ungulate prey densities (availability) estimated by the Forest Department in 2010 as part of the All India Tiger Monitoring Programme, using line transect surveys and distance sampling methods (data provided by the Forest Department). Prey preference calculations based on frequency of occurrence of prey in faecal samples (utilization) and prey densities were restricted to include only those prey species for which abundance data were available. We used Jacobs’ index to determine prey preferences (Hayward et al., Reference Hayward, Henschel, O'Brien, Hofmeyr, Balme and Kerley2006a,Reference Hayward, O'Brien, Hofmeyr and Kerleyb, Reference Hayward, Jędrzejewski and Jedrzejewska2012), with the formula D = (r i − p i )/(r i + p − 2r i pi ), where r i is the proportion of faecal samples at a study site at which species i is found, and p i is the proportional abundance/density of the given prey species among all prey species found at the site (Jacobs, Reference Jacobs1974). The value of Jacobs’ index ranges from +1 to −1, indicating maximum preference and avoidance of prey species, respectively.
Multivariate spatial data analysis
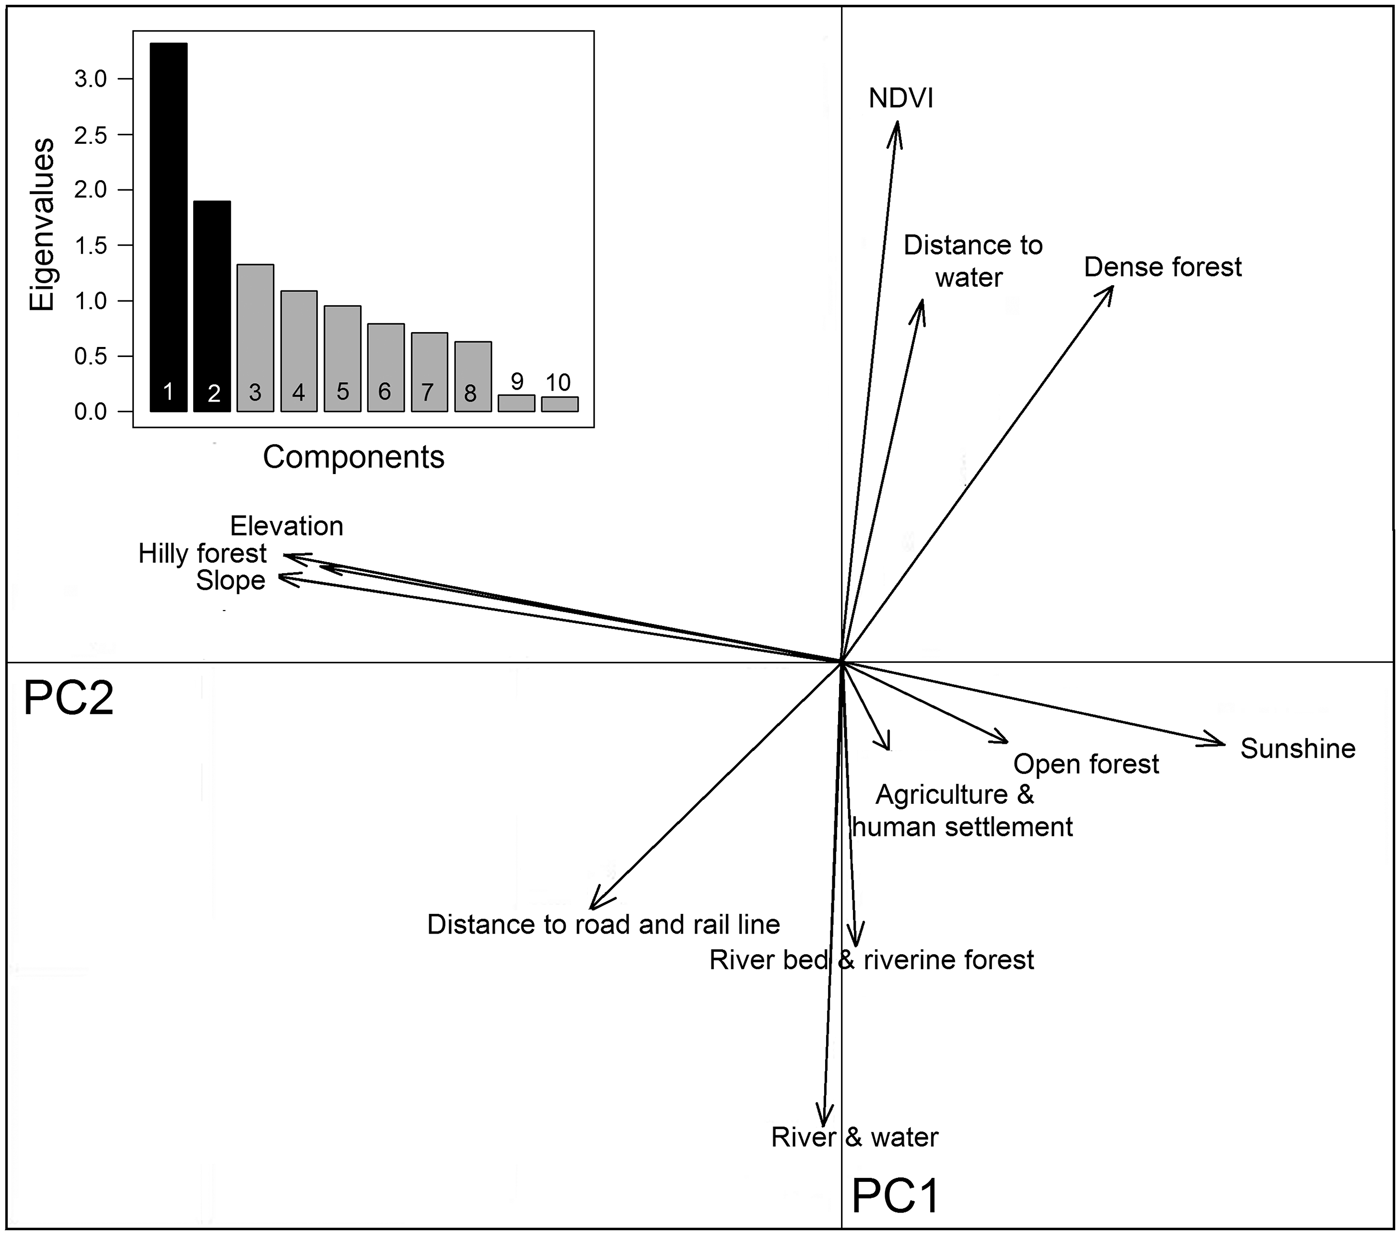
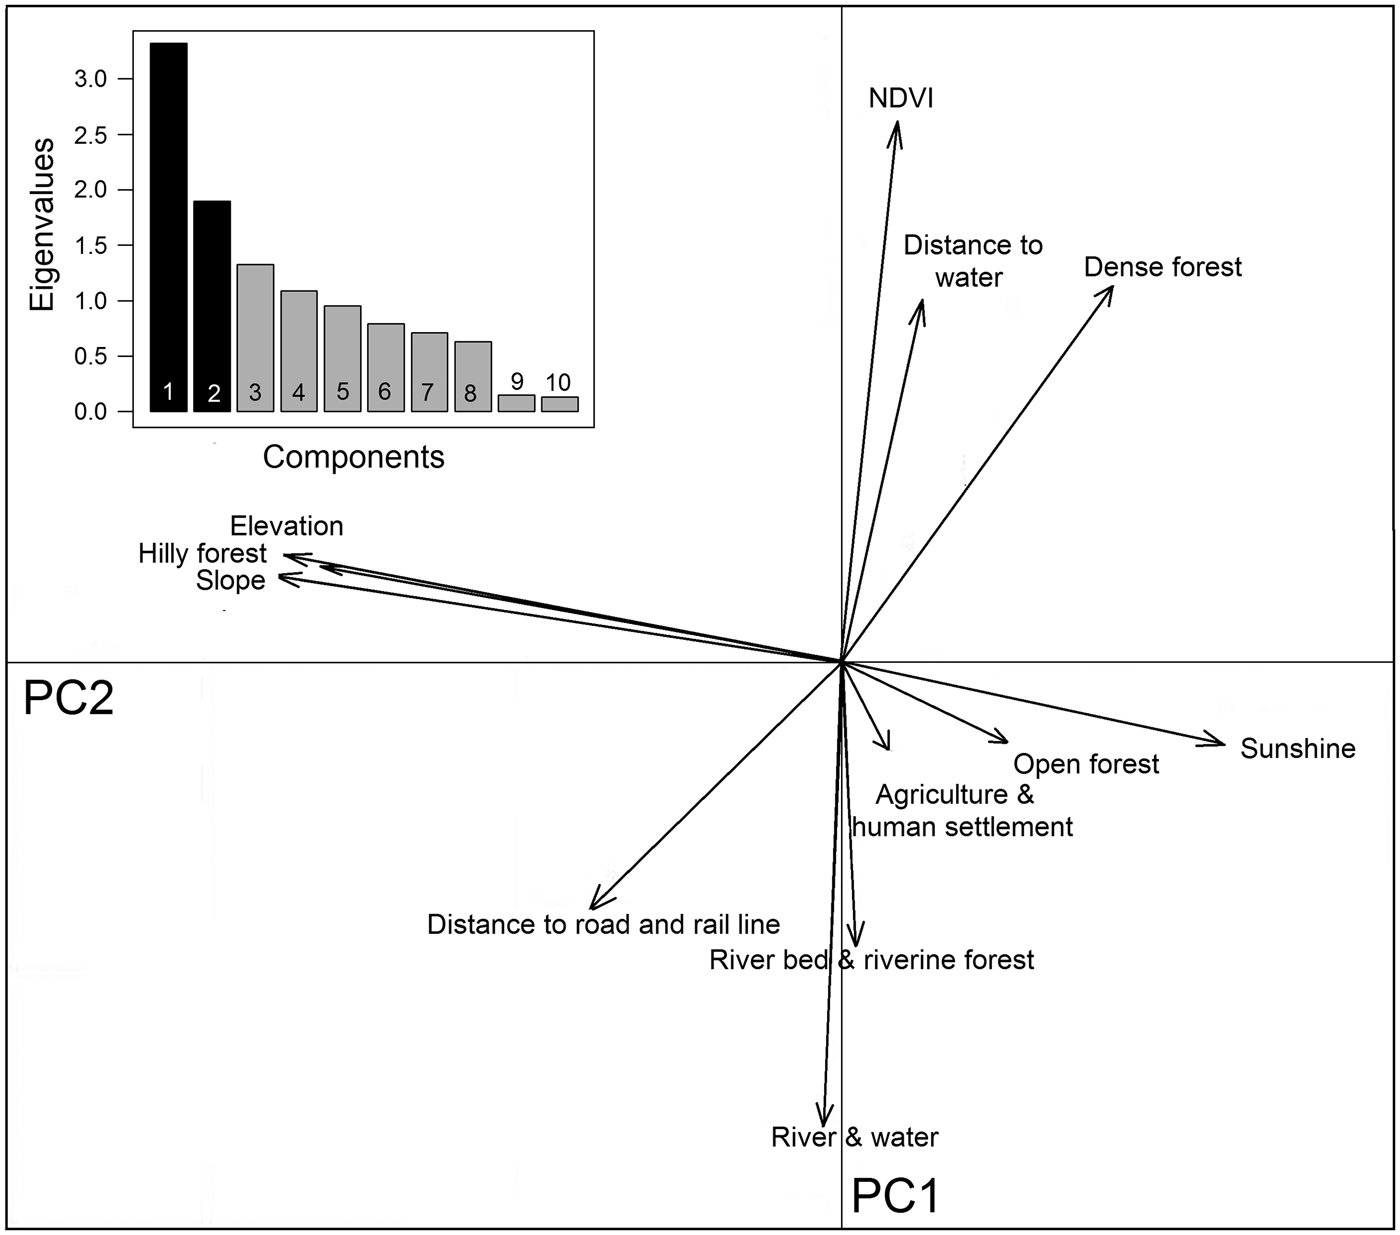
We assessed 12 eco-geographical variables (Supplementary Fig. S1), pairwise, for degree of correlation, and used the locations of tiger-positive samples as indicators of tiger presence. To examine the spatial structure and relationships of these variables we used principal component analysis in the package adehabitat (Calenge, Reference Calenge2006) in R v.3.3.2 (R Development Core Team, 2009). We used a multivariate method, ecological niche factor analysis, to understand habitat selection of tigers in Buxa (see Supplementary Material for details of the methods). We used a biplot to visualize the ecological niche available for tigers in Buxa. The biplot projected available and used resource units in the ecological space on the plane defined by marginality and specialization axes (Calenge, Reference Calenge2006; Nawaz et al., Reference Nawaz, Martin and Swenson2014).
We computed a habitat suitability map for tigers in Buxa using the Mahalanobis distance statistic (D 2; Clark et al., Reference Clark, Dunn and Smith1993). This is a measure of dissimilarity between mean habitat characteristics at each resource unit and the mean of habitat characteristics estimated from tiger faecal sample locations. Assuming multivariate normality, D 2 has a χ2 distribution with n degrees of freedom (n = number of eco-geographical variables). The adehabitatHS package implemented in R (Calenge, Reference Calenge2006) facilitates the computation of a map with a continuous gradient of suitability, where each pixel is represented by P values of 0–1. We used all eco-geographical variables (Table 1) to construct the gradient of this habitat suitability map. We used Boyce's index to categorize the gradient habitat suitability map into 15 classes (with 0.06 intervals), and calculated predicted-to-expected ratios (F i ) for each class using the formula F i = p i /E i , where p i is the predicted frequency of evaluation points in class i, and E i is expected frequency expressed as relative area covered by each class (Hirzel et al., Reference Hirzel, Lay, Helfer, Randin and Guisan2006). E i was plotted against class intervals and the suitability map was reclassified into three classes (poor, suitable and high quality) by choosing threshold points from the F i curve. F i = 1 indicates a random model where presence is equal to that expected by chance. This point was taken as the boundary between poor (F i < 1) and suitable (F i > 1) habitats (Hirzel et al., Reference Hirzel, Lay, Helfer, Randin and Guisan2006).
Table 1 Description of ecological and geographical variables used in ecological niche factor analysis and in habitat suitability analysis using the Mahalanobis distance probability function (D 2) for the tiger Panthera tigris in Buxa Tiger Reserve, India (Fig. 1).
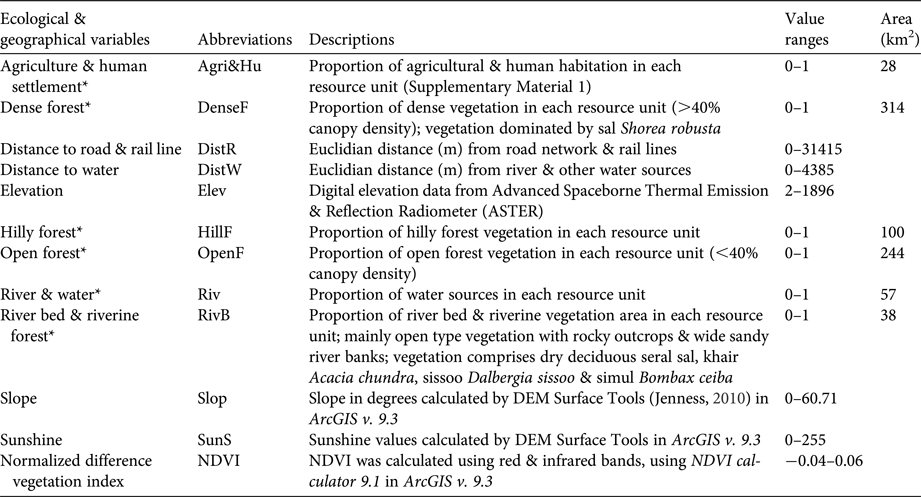
* Variables were derived from Land Use Land Cover (LULC) classified map (LANDSAT 8, USGS, image LC81380422013349LGN00).
Results
Analysis of prey occurrence in the tiger's diet
In total 909 faecal samples were collected in Buxa during 2010–2013, of which 372 were found to be of tiger origin. Fourteen prey species/groups were identified in 240 genetically identified tiger faecal samples. We did not attempt to distinguish between wild and domestic goat species, and most samples were identified only to the generic level. Proportions of various prey species in faecal samples stabilized on analysing 220 samples (Fig. 2a). The species diversity index indicated that no new prey species were identified after analysing 200 samples (Fig. 2b). The percentage frequency of occurrence of prey species in tiger faecal samples is presented in Fig. 3, and the biomass contribution of each prey species is in Table 2. Goats Capra spp. were the most prevalent prey in the samples (26.59%), followed by macaques Macaca mulatta (22.22%) and cattle Bos spp. (20.63%). Porcupines Hystrix indica contributed the least (0.79%) to the tiger's diet.
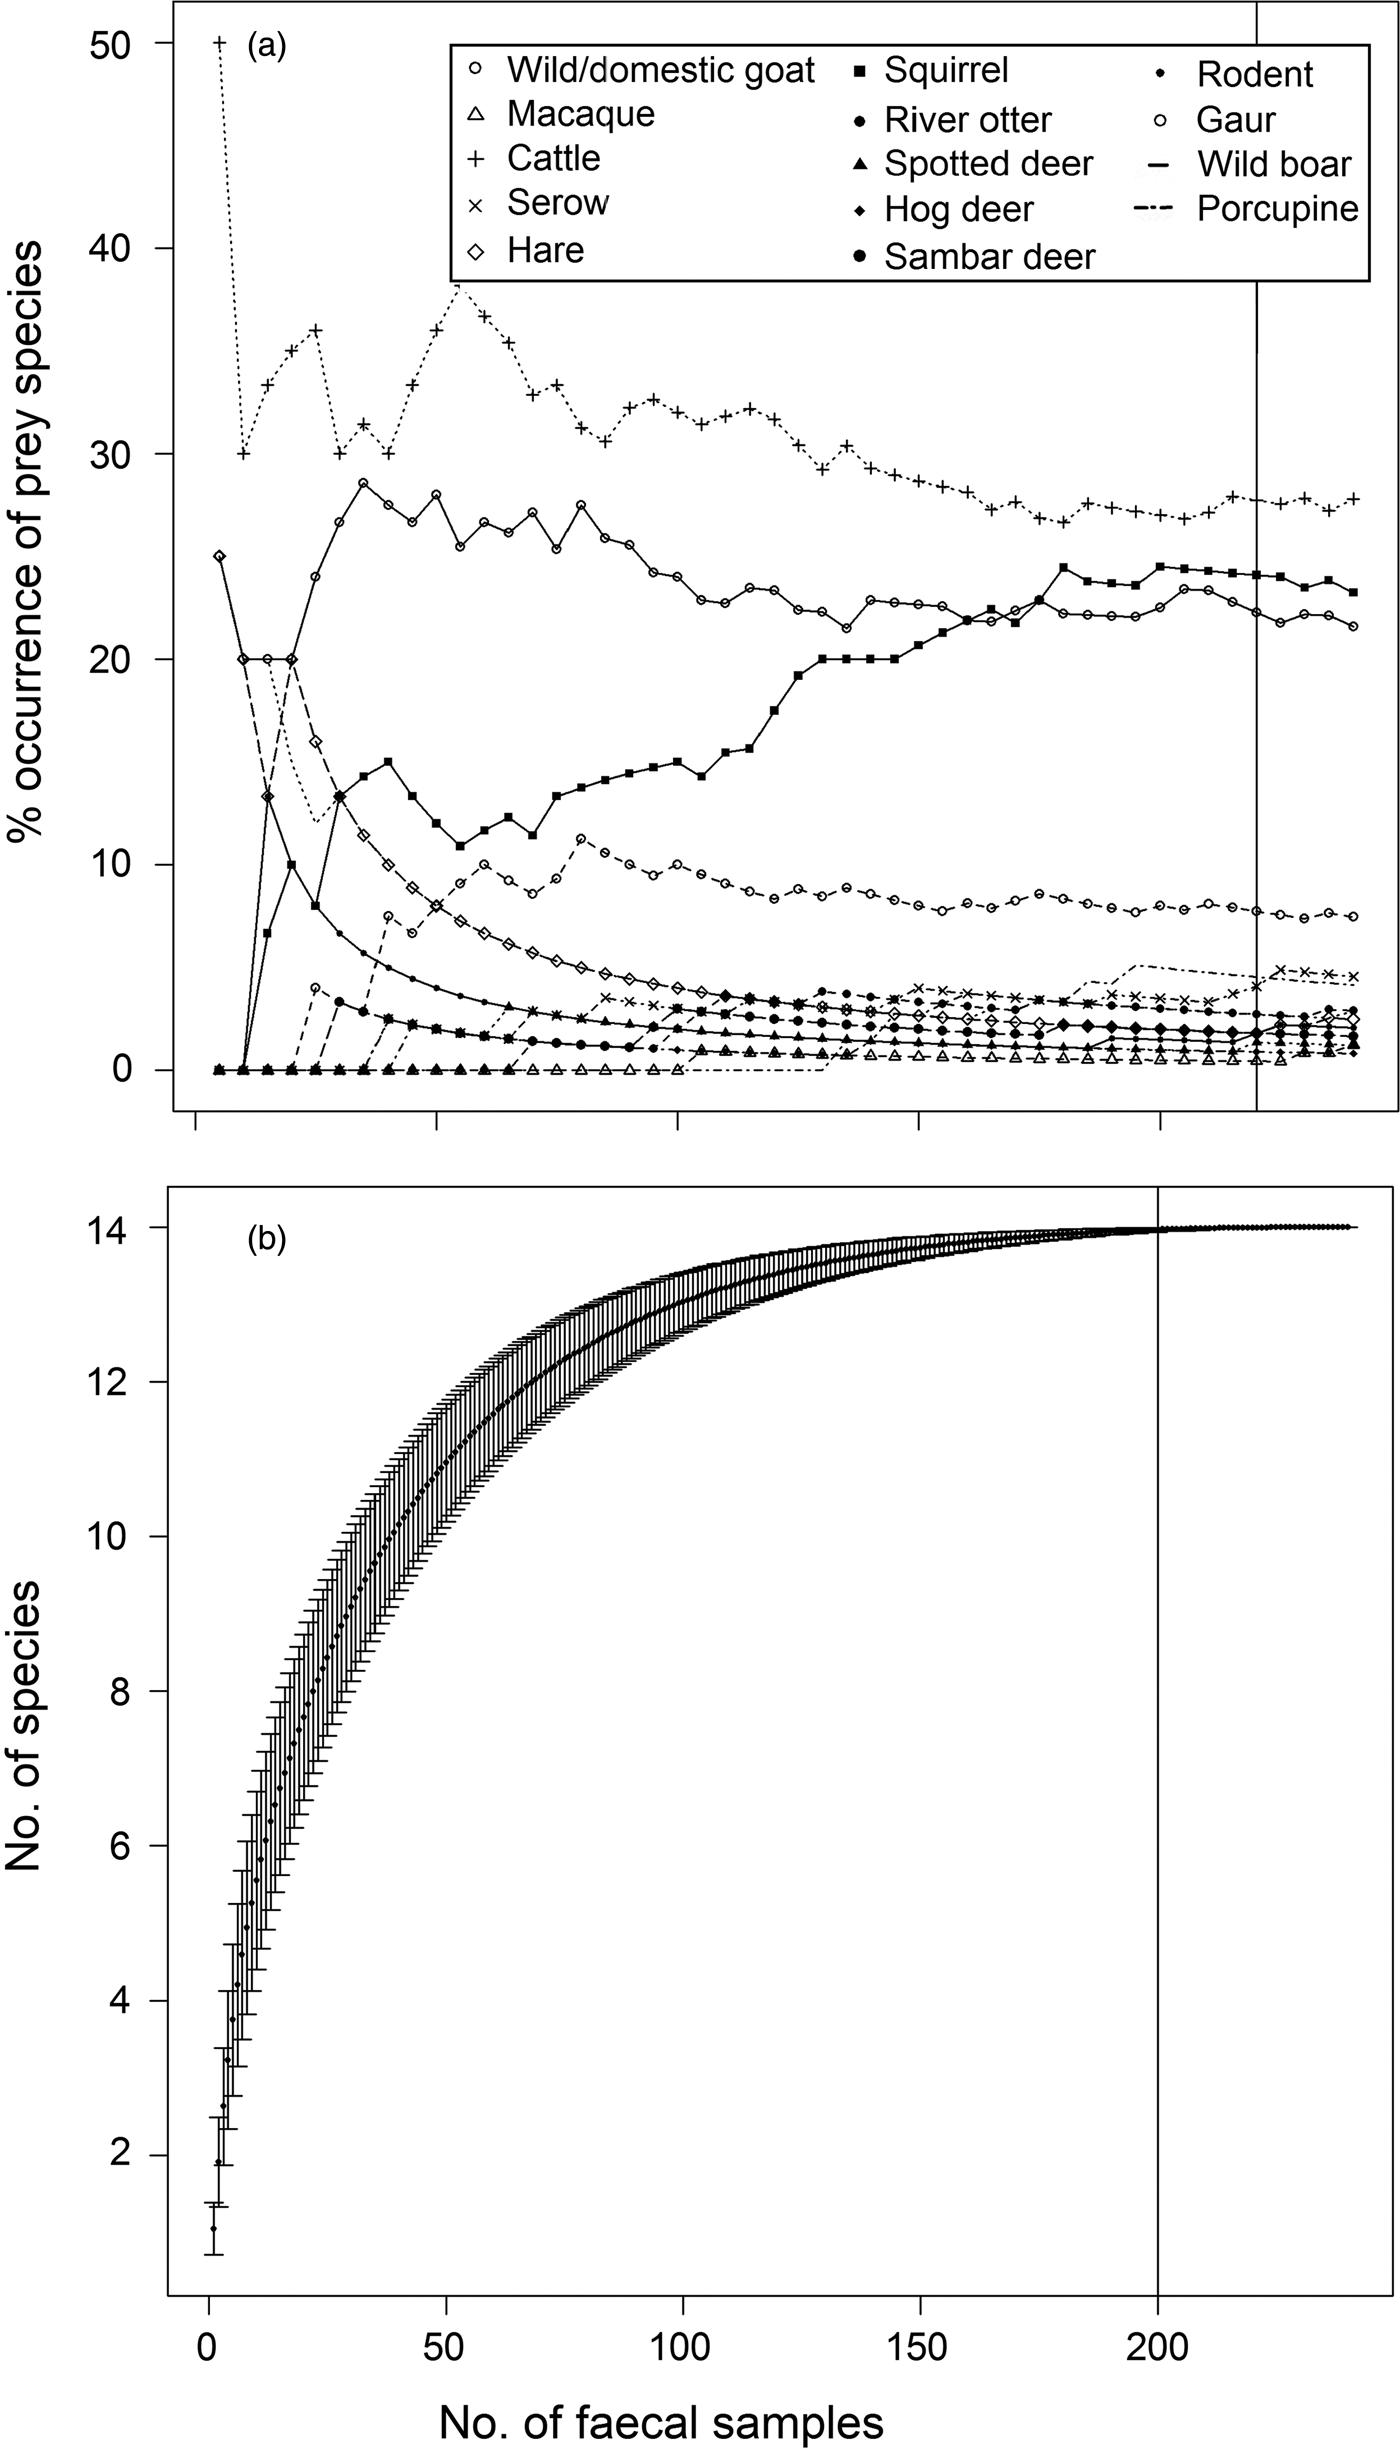
Fig. 2 (a) Percentage frequency of occurrence of prey remains with increasing number of tiger Panthera tigris faecal samples, and (b) diet stabilization curve for tigers in Buxa Tiger Reserve (Fig. 1).

Fig. 3 Percentage frequency of occurrence of prey species in the tiger's diet in Buxa Tiger Reserve (Fig. 1).
Table 2 Frequency of occurrence, percentage frequency of occurrence and mean body weight of each prey species were used to calculate weight of prey consumed per faecal sample, total biomass consumed, percent biomass consumed, and the relative biomass of prey species consumed, by Ackerman's equation, to understand the trend of feeding habits of tigers Panthera tigris in Buxa Tiger Reserve (Fig. 1)

Prey preference analysis
Out of the fourteen prey species identified in tiger faecal samples, prey preference analysis was restricted to six tiger prey species (hog deer Axis porcinus, sambar deer Rusa unicolor, spotted deer Axis axis, wild boar Sus scrofa, Indian gaur Bos gaurus and cattle Bos spp.) for which abundance data were available. Amongst these, the most preferred prey species according to Jacobs’ index were hog deer Axis porcinus, sambar deer Rusa unicolor and spotted deer Axis axis (Fig. 4). Cattle Bos spp., wild boar Sus scrofa and Indian gaur Bos gaurus were found to be the less preferred prey species (Fig. 4).
Landscape
Buxa comprises 40% densely vegetated forests, 31% open forests and 13% hill forests, with large areas also encompassing riverine forests (5%), and water channels and rivers (7%). The southern part of the Reserve is relatively flat, with 0–45° slopes, whereas the northern peripheral areas have steep slopes of up to 66°. Principal component analysis yielded a high normalized difference vegetation index value, and dense forests are mostly found around water channels. Hilly forests correlate with steep slopes to the north (Fig. 5). Although roads and railways cut across the Reserve, they occur away from dense vegetation. Agricultural areas, human settlements and tea gardens surround the Reserve except in the northern hilly parts, which are usually adjoined by open forest areas (Fig. 5).
Ecological niche factor analysis
Hilly forests, higher elevations and steep slopes show the highest coefficients of marginality, indicating that tigers avoid highland vegetation at high elevations and on steep slopes (Table 3). The marginality factor also indicates a selection for dense vegetation, dense forests, open forests, riverine vegetation and areas close to water sources such as rivers, streams and ponds, and avoidance of man-made land-use infrastructures. The specialization factor (niche width) implies that the ecological niche of tigers in Buxa is much narrower than the available variation in habitat components. Elevation, slope, sunshine and hilly forests were the most prominent variables affecting the niche width for tigers, which have a preference for low elevations, and gentle slopes with minimal human footprint (Fig. 6).

Fig. 6 Biplot of the ecological niche factor analysis of tiger habitat in Buxa Tiger Reserve (Fig. 1). The pale shaded area represents available habitat and the darker area corresponds to the tiger's ecological niche, with the barycentre of the niche indicated by an unfilled circle on the x-axis. The distance between the barycentre of the niche and the barycentre of available conditions (intersection of the two axes) represents the marginality of the niche within the available habitat. Eigenvalues of the first 10 specialization axes are indicated in the bar chart.
Table 3 Ecological niche factor analysis of tiger habitat in Buxa Tiger Reserve (Fig. 1), using locations of tiger faecal samples as the response variable. Marginality indicates the direction in which the species' niche varies from mean available conditions in the area. Specialization is a measure of niche width within the available habitat.
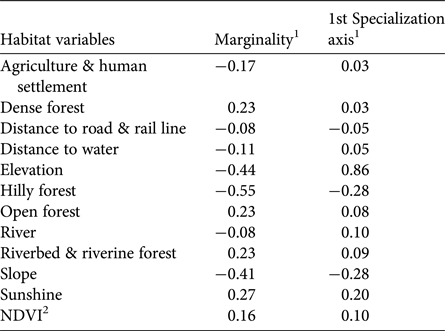
1Positive values indicate selection; negative values indicate avoidance.
2Normalized Difference Vegetation Index.
Habitat suitability
A Pearson correlation test with all eco-geographical variables indicated that elevation, slope and hilly forests are highly correlated with each other (Table 4). Hilly forests and slope were therefore excluded to minimize bias in the habitat suitability map based on Mahalanobis distance statistics. This map (Fig. 7) indicates that tiger habitat is not distributed uniformly throughout Buxa. The F i values of 0.50–3.86 derived from Boyce's index (Supplementary Fig. S2) indicate the habitat suitability map has good predictive power for the occurrence of tigers in Buxa. Approximately 62% of the protected area is classified as suitable, with 21, 23 and 17% classified as moderately suitable, suitable and highly suitable, respectively.

Fig. 7 Habitat suitability map for tigers in Buxa Tiger Reserve (Fig. 1), with locations where tiger faecal samples were collected.
Table 4 Pearson correlation coefficients among ecological and geographical variables (Table 1) used in ecological niche factor analysis and in habitat suitability analysis using the Mahalanobis distance probability function (D 2).

1 Multi-collinearity among eco-geographical variables can result in over-fitting in habitat suitability modelling (Graham Reference Graham2003; Pearson et al., Reference Pearson, Raxworthy, Nakamura and Townsend Peterson2007). We therefore excluded highly correlated environmental predictors (hilly forests, slope) from the Mahalanobis distance probability analysis used to predict suitable habitat for tigers.
2Normalized Difference Vegetation Index
Discussion
The survival and persistence of large carnivores in an area depend mainly on the availability of prey and undisturbed, protected habitat. Environmental harshness and rugged terrain make it difficult to carry out systematic field surveys in Himalayan habitats and to gather information about quality of habitat and availability of food (Jackson et al., Reference Jackson, Roe, Wangchuk and Hunter2006; Sathyakumar et al., Reference Sathyakumar, Bashir, Bhattacharya and Poudyal2011). Location and analysis of faecal samples yield invaluable information on ecological, genetic and physiological parameters, which can be utilized for managing mega-predators in such terrains. Repeated surveys in Buxa were made possible by recruiting Forest Department staff and training them to conduct simple foot patrol-based field surveys.
We used molecular tools to identify tiger faecal samples, accurately differentiating them from those of sympatric carnivores such as leopards and clouded leopards. Prey remains in carnivore faecal samples can be identified by several methods, including microscopic hair analysis and DNA-based species identification. Although more accurate, DNA analysis of prey remains in a large number of samples by next-generation sequencing (Shehzad et al., Reference Shehzad, Riaz, Nawaz, Miquel, Poillot and Shah2012) or denaturing gradient gel electrophoresis (Lee et al., Reference Lee, Lee, Nam and Lee2013) is more costly and technique-intensive. Microscopy of hair samples provides reliable identification at least to genus, and in many cases to the species level. Population density and biomass of large herbivore species have often been used to assess the carnivore carrying capacity of various habitats. Biological modelling by Karanth et al. (Reference Karanth, Chundawat, Nichols and Kumar2004) demonstrated that prey depletion can lead to significant declines in tiger populations, and thus population sizes of prey and predators are interdependent.
We identified 14 prey species by microscopic analysis of hair remains in tiger faecal samples (Fig. 3). These were the tiger's utilized prey in Buxa. However, only a few of the tiger's larger prey species are surveyed regularly (by the Forest Department), and we could use only these data in computing Jacobs’ index for prey selectivity (goats and macaques, which are abundant in Buxa, are not counted in the Forest Department line transect surveys). Contrary to previous studies on tiger feeding habits, in which tigers were found to prey heavily on medium- to large-sized wild cervids (Biswas & Sankar, Reference Biswas and Sankar2002; Kapfer et al., Reference Kapfer, Streby, Gurung, Simcharoen, McDougal and Smith2011), our results show that tigers in Buxa consume mostly small prey, such as goats and macaques (Fig. 3). Because of the very low abundance of primary wild prey such as large cervids, tigers in Buxa also appear to depend heavily on domestic cattle. However, their preferred prey (hog deer, sambar deer and spotted deer) as suggested by Jacobs’ index (Fig. 4) is the same as reported elsewhere (Biswas & Sankar, Reference Biswas and Sankar2002; Kapfer et al., Reference Kapfer, Streby, Gurung, Simcharoen, McDougal and Smith2011; Hayward et al., Reference Hayward, Jędrzejewski and Jedrzejewska2012). High frequency of occurrence of cattle hair in the faecal samples reflects the abundance of this species in the landscape, and similarly the low frequencies of occurrence of wild ungulate species such as hog deer, sambar deer and spotted deer in the faecal samples reflects their rarity in the landscape. Frequency of prey species occurrence in tiger faecal samples and Jacobs’ index together indicate that the tiger's preferred wild prey species occurred the least in tiger faecal samples. Low tiger numbers in Buxa could be attributed to the low numbers of the tiger's major prey species, and this matter needs to be addressed urgently by park managers. We believe that tiger augmentation/reintroduction programmes in Buxa and elsewhere will only succeed if park managers ensure reduction in cattle numbers in core protected areas and work towards increasing wild ungulate abundance by improving grasslands, protection and law enforcement.
Repeated surveys over a large area and spanning long timescales ensure greater accuracy of data (Kapfer et al., Reference Kapfer, Streby, Gurung, Simcharoen, McDougal and Smith2011). The percentage occurrence of prey species stabilized after we analysed 220 scats (Fig. 2b), thus ensuring that we identified even rare prey species (Table 2). Pseudo-replication (Hurlbert, Reference Hurlbert1984) and biased estimates of the relative importance of certain prey (Marucco et al., Reference Marucco, Pletscher and Boitani2008; Kapfer et al., Reference Kapfer, Streby, Gurung, Simcharoen, McDougal and Smith2011) were overcome by collecting samples in multiple sessions.
We assessed how a species selects a particular habitat by incorporating several continuous eco-geographical variables in robust multivariate analyses and using the locations of tiger-positive faecal samples as indicators of tiger presence. These methods do not require independence of the explanatory variables (contrary to generalized linear models) and prior assumptions about which variables may be important for the target species (Hirzel et al., Reference Hirzel, Hausser, Chessel and Perrin2002), or absence data of target species, making them more precise tools for studies based in difficult terrain. The suitability map of Buxa Tiger Reserve generally follows the productivity pattern of the Reserve, with the central and eastern areas mapped as highly suitable (17%) and moderately suitable (23%) for tigers, respectively (Fig. 7). These regions are also part of the administrative core area of the Reserve. The eastern part has suitable habitat (e.g. dense forests), availability of water and low human disturbance (Fig. 1). The mountainous northern area, although undisturbed, is not preferred by tigers. However, this result should be viewed with caution as the northern part has fewer paths and steep slopes, constraining foot-patrol surveys and detection of tiger faecal samples.
Low carnivore detectability, high anthropogenic pressure and rapid degradation of habitat disturb ecological balances throughout the Himalayas. In Buxa the ecosystem is threatened by dolomite mining, cane and bamboo harvesting, timber felling and cattle grazing. Cattle grazing and fuelwood collection are known to lead to fragmentation of wildlife habitat (Liu et al., Reference Liu, Linderman, Ouyang, An, Yang and Zhang2001), decline of wildlife populations (Aigner et al., Reference Aigner, Block and Morrison1998; Hall & Farrell, Reference Hall and Farrell2001), and loss of biodiversity (Rosenstock, Reference Rosenstock1998; Sagar & Singh, Reference Sagar and Singh2004). The low detectability of tigers in Buxa may be a result of the low density of preferred wild ungulate prey species and high levels of human disturbance (Sinha & Das, Reference Sinha and Das2003; Das, Reference Das2008; Sarkar & Das, Reference Sarkar and Das2012). The tiger's preference for dense canopy cover, especially near water bodies, with a low human footprint, means that only a small proportion of the Reserve is highly suitable habitat for the tiger.
Empirical data generated with simple laboratory-based technologies in combination with field surveys can be used effectively to guide park management. This study is the first intensive effort to examine the status and feeding habits of tigers in Buxa, and provides a baseline for future studies in this and similar protected areas.
Acknowledgements
We gratefully acknowledge the logistic support provided by Dr R. P. Saini, Field Director of Buxa Tiger Reserve. We thank Dr Martin Fisher and two anonymous referees for their constructive comments which have greatly improved the manuscript. The study was funded by the Department of Biotechnology and the Council of Scientific and Industrial Research of the Government of India.
Author contributions
MSS and PAR designed the study, carried out analyses, interpreted the results and wrote the article. HS, SM and KS carried out DNA and hair analyses. JVB and RJ coordinated and supervised field work and sample collection. SS contributed to the analyses and writing. All authors read and agreed to the final draft.
Biographical sketches
Mriganka Shekhar Sarkar studies the ecology and conservation biology of large mammals. Harika Segu works on population genetics and DNA forensics of tigers. J.V. Bhaskar and Rajendra Jakher are officers in the West Bengal Forest Department. Swati Mohapatra and K. Shalini contributed to this study as part of their MSc research. S. Shivaji has conducted research in conservation biology and animal reproduction, and is currently focused on microbial biodiversity. P. Anuradha Reddy studies the conservation biology and population genetics of threatened mammals in India.


