


1. Introduction
The AlGaN alloy is a solid solution over the whole range of composition and has a direct band gap from 3.4 to 6.2 eV. Therefore, it is a promising material for devices application in the visible range when associated to InGaN Reference Shuji and Gerhard[1] Reference Nakamura, Senoh, Nagahama, Iwasa, Yamada, Matsushita, Sugimoto and Kiyotu[2], and in the UV range for photodetectors Reference Walker, Zhang, Saxler, Kung, Xu and Razeghi[3]. To obtain high quality AlGaN for electronic application, it is necessary to study at first the growth mechanisms involved in the AlGaN growth. Therefore, we study the aluminum gallium nitride solid solution in the whole range of composition, varying the gas phase composition for 10% from one sample to another. This leads us to establish a model for the aluminum incorporation into the solid phase. We were very careful to keep all the growth parameters constant, even the total group III molar flow rate. We observed a decrease in the epilayer crystalline quality with increasing Al content as demonstrated by TEM, and X-Ray diffraction. Indeed, at high Al contents (above 50% aluminum), a second crystalline orientation appears resulting in a “ two directional ” growth induced by the buffer layer.
2. Experimental
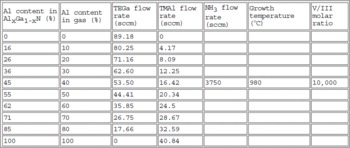
The AlGaN epilayers were grown using triethylgallium, trimethylaluminum and ammonia by low pressure (76 Torr) MOVPE. The layers were deposited onto a 500 Å AlN buffer layer grown at low temperature on a c-face sapphire substrate. We grew layers covering the whole range of AlGaN composition from GaN up to AlN. The data concerning the growth are tabulated (Table1). The organometallic bubbler temperatures were 19°C for the TMAl and 15.5°C for the TEGa. Before the growth, the substrates were cleaned in a hot 1 H3PO4: 3 H2SO4 mixture for 10 minutes and was nitrided for 10 minutes under 300 sccm ammonia at 76 Torr.
Table 1 Growth conditions. H2 was used as carrier gas.
The Al composition was determined by energy dispersive analysis of X-ray (EDAX), making the proper corrections for atomic number, absorption and fluorescence. These results were in good agreement with the X-ray diffraction data, assuming that the c lattice parameter of the alloy satisfies Vegard's law. Cross sections for TEM were prepared using the standard procedures: mechanical polishing and Argon ion milling. TEM observations were realized on a JEOL 4000 EX electron microscope.
3. Results and Discussion
First, we studied the aluminum incorporation in the solid phase during low pressure MOCVD growth. In the literature, observations are reported concerning high reactivity between TMAl and ammonia Reference Chen, Liu, Steigerwald, Imler, Kuo, Craford, Ludowise, Lester and Amano[4] leading to adducts formation Reference Koide, Itoh, Sawaki, Akasaki and Hashimoto[5]. We must point out that due to our reactor inlet design and to the reactor low pressure, adducts formation is negligible in our growth process. Therefore, making the assumptions that the growth mechanism is limited by mass-transport of group III elements through the gas phase Reference Khan, Skogman, Schulze and Gershenzon[6] and that the solid composition will be determined by the relative Al and Ga fluxes reaching the interface by diffusion, we can write Reference Stringfellow[7]:

sratio between the gallium precursor diffusion coefficient DGa through the mixture of ammonia and hydrogen (used as carrier gas) and the aluminum one, Dal. To calculate the diffusion coefficients for the organometallic precursors in an ammonia/hydrogen gas mixture we first use the Wilke and Lee model Reference Reid, Prausnitz and Polling[8], taking into account the diffusion process involved by the concentrations gradient corrected by a contribution due to the thermal gradient Reference Holstein[9]. We found for k the value 0.834, which fits well the experimental data (Figure 1). The details of this model will be reported elsewhere.

Figure 1. AlGaN solid phase composition versus gas phase composition. The squares represent the experimental data fitted by our model (dashed line).
To analyze the quality of our epilayers, we have performed X-ray diffraction measurements. These experiments evidence a decrease of the epilayers quality with increasing Al content (Figure 2). Moreover, it appears that above 50% Al content, the growth becomes “ two directional ». SEM indicate clearly a change in the surface morphologies which start smooth at low Al contents and sharply after 50% Al, become acicular with a clear six-fold symmetry Reference Clur, Briot, Rouvière, Andenet, Le Vaillant, Gil, Aulombard, Demangeot, Frandon and Renucci[10] Reference Morita, Uesugi, Isogai, Tsubouchi and Mikoshiba[11]. The reasons for these modifications will be given below, from the TEM results. Four AlxGa1−xN samples with different Al compositions (x = 0.16, x = 0.45, x = 0.55, x = 0.85) have been observed using Transmission Electron Microscopy. The two last samples greatly differ from the two first ones. The samples with a low Al concentration looks like traditional GaN layers. They are monocrystalline with a Ga polarity (ref. Reference Rouviere, Arlery, Niebuhr, Bachem and Briot[12] Reference Daudin, Rouviere and Arlery[13] Reference Ponce, Bour, Young, Saunders and Steeds[14]) and contain a high density of dislocations (about 1010/cm2) and many nanopipes (ref. Reference Qian, Skowronski, Doverspike, Rowland and Gaskill[15]). The samples with an Al content higher than 0.55 contain two kinds of textures: the planes parallel to the initial (0001) sapphire surface plane can be the (0001) plane or the pyramidal

Figure 2. Full width at half maximum in the whole range of AlGaN composition

Figure 3. Transmission Electron Microscopy of an Al0.85Ga0.15N sample: a) High-resolution image, b) Electron diffraction and c) low resolution image showing the grains shapes.
Two of these variants can be clearly seen on a HREM picture (Figure 3a) taken along the
4. Conclusion
We have grown AlGaN in the whole range of composition using the same growth temperature for all layers. Considering that the growth mechanism is mass-transport limited and that the solid composition will be determined by the relative Al and Ga fluxes reaching the interface by diffusion, we have successfully modeled the aluminum incorporation from the gas phase to the solid AlGaN. Structural characterizations display an evolution in the surface morphologies which are sharply modified for more than 50% aluminum. At high Al content, due to the Al low surface mobility, growth originates both on (0001) plans and on the buffer
Acknowledgments
This work has been supported by the DRET/DGA and by THOMSON-CSF-LCR.


