1 Introduction
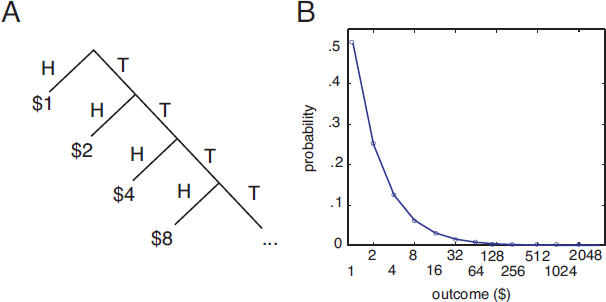
In the St. Petersburg paradox, originally proposed in 1738, the house offers to flip a coin until it comes up heads. The house pays $1 if heads appears on the first trial; otherwise the payoff doubles each time tails appears, with this compounding stopping and payment being given at the first heads (Bernoulli, 1738; shown in Figure 1). By conventional definitions, the St. Petersburg gamble has an infinite expected value; nonetheless, most people share the intuition that they should not offer more than a few dollars to play. Explaining why people offer such small sums to play a gamble with infinite expected value is an important question in economics and philosophy (Reference DatsonDatson, 1988; Reference SamuelsonSamuelson, 1977; Reference MartinMartin, 2008; Reference Gigerenzer and SeltenGigerenzer & Selten, 2002).
Figure 1: The St. Petersburg paradox.
A. Outcome tree for St. Petersburg gamble. The St. Petersburg gamble consists of a series of coin flips offering a 50% chance of $1, a 25% chance of $2, a 12.5% chance of $4, and so on. The gamble may continue indefinitely.
B. The probability of each possible outcome decreases as a function of outcome size. The probability of large outcomes is very low, but not zero.
The St. Petersburg paradox has attracted explanations from many well-known thinkers, including Daniel and Niklaus Bernoulli, Cramer, de Morgan, Condorcet, Euler, Poisson, and Gibbon, and economists including Marschack, Cournot, Arrow, Keynes, Stigler, Samuelson, von Mises, Ramsey and Aumann (Reference ArrowArrow, 1951; Reference AumannAumann, 1977; Reference DutkaDutka, 1988; Reference KeynesKeynes, 1921; Reference SamuelsonSamuelson, 1960). The earliest discussions of the St. Petersburg paradox led to the idea of utility curves, now a central concept in economics (Reference DutkaDutka, 1988). Moreover, Menger’s discussion of the paradox sparked von Neumann’s interest in utility, which in turn influenced Von Neumann and Morgenstern’s foundational book Theory of Games and Economic Behavior (Reference MorgensternMorgenstern, 1976; Reference Von Neumann and MorgensternVon Neumann & Morgenstern, 1944). Despite the importance of the St. Petersburg paradox, there is no widely accepted explanation for the low values most people place on this theoretically priceless gamble (Reference MartinMartin, 2008; Reference SamuelsonSamuelson, 1977). Moreover, there is precious little empirical data on the St. Petersburg Paradox (but see Reference Bottom, Bontempo and HoltgraveBottom, Bontempo, and Holtgrave, 1989; Rivero, Holtgrave, Bontempo, and Bottom, 1990; Reference Kroll and VogtKroll and Vogt, 2009; Cox, Sadiraj, and Vogt). In the present study, we review several major classes of explanations, and then provide empirical data designed to test these explanations.
1.1 Diminishing marginal utility
Daniel Bernoulli was the first to argue, in his explanations of the St. Petersburg paradox, that the marginal value of money to an individual diminishes as his wealth rises (Reference BernoulliBernoulli, 1738). This hypothetical concept is now known as utility (Reference Friedman and SavageFriedman & Savage, 1948; Reference Von Neumann and MorgensternVon Neumann & Morgenstern, 1944). The concavity of the utility function guarantees that, while the expected value of the gamble is infinite, its expected utility is finite. Thus, “any fairly reasonable man would sell his chance, with great pleasure, for twenty ducats” (Daniel Bernoulli, quoted in Baron, 1998). In some more recent discussions, a requirement that the utility curve have finite bounds has been added (Reference AumannAumann, 1977; Reference MartinMartin, 2008; Reference MengerMenger, 1934; Reference SamuelsonSamuelson, 1977; Reference VickreyVickrey, 1960). This requirement deals with super-St. Petersburg paradoxes (see below) and is psychologically plausible (Reference SamuelsonSamuelson, 1977).
The utility curve explanation is widely held up as the explanation for risk aversion in the St. Petersburg paradox (e.g. Aumann, 1977; Reference Friedman and SavageFriedman & Savage, 1948; Reference RealReal, 1996; Reference SchoemakerSchoemaker, 1982; Reference Von Neumann and MorgensternVon Neumann & Morgenstern, 1944). Indeed, the St. Petersburg paradox is often used in introductory courses to motivate the idea of utility functions (e.g. Baron, 1998; Reference Mas-Colell, Whinston and GreenMas-Colell, Whinston, & Green, 1995; Reference CamererCamerer, 2005). Despite its wide acceptance, the utility curve explanation has been discredited several times, mainly because it over-predicts bids (Reference LopesLopes, 1981; Reference MartinMartin, 2008; Reference MengerMenger, 1934; Reference MoritzMoritz, 1923; Samuelson, 1960, 1977). (This is not to say that marginal utility does not diminish, just that this factor is not sufficient to explain the paradox.) Replacing expected utility with more modern variants, such as cumulative prospect theory (CPT) does not help either, as empirically fit values strongly over-predict bids in the St. Petersburg paradox (Reference BlavatskyyBlavatskyy, 2005; Rieger & Wang, 2006; Reference CamererCamerer, 2005).
An early strong critique of the utility explanation came from Karl Menger, who introduced the idea of the Super St. Petersburg paradoxes (Reference MengerMenger, 1934). In these variants, the value of the gamble increases much faster than doubling on each round. The change function can be chosen so as to rise fast enough to overtake any reasonable utility function. Despite these richer payoffs, people intuitively feel that they would not pay more than a modest sum for any of these super-St. Petersburg gambles (Reference MengerMenger, 1934; Reference SamuelsonSamuelson, 1977).
An elegant demonstration of the weakness of this explanation comes from a recent experiment involving manipulations of delays instead of monetary rewards. People, like animals, are risk-seeking for delays, and so presumably have convex utility curves for time (Bateson & Kacelnik, 1996). Nonetheless, human subjects choose low values in a variant of the St. Petersburg paradox in which it is potential delays, not money, that doubles (Reference Kroll and VogtKroll & Vogt, 2009). This pattern reveals that something other than a concave utility function explains how people value the gamble.
1.2 Finitude of resources
Another well-known explanation is that since the amount of money in the world is finite, the gambler must doubt the ability of the house to pay the large outcomes of the gamble. A related argument is that time is finite, and the gambler, knowing he or she cannot play the gamble forever, bids less than the expected value of the gamble. This argument has been expressed, in various forms, by Poisson, Catalan, Pringsheim, von Mises, Czuber, Buffon (Reference DutkaDutka, 1988) and others (Reference SavageSavage, 1954; Reference Tversky and Bar-HillelTversky & Bar-Hillel, 1983; Reference VickreyVickrey, 1960). Camerer proposes that belief in finite resources, when combined with loss aversion, provides a parsimonious explanation for risk-averse behavior in the St. Petersburg paradox (Reference CamererCamerer, 2005). In this particularly well developed treatment, Camerer argues that if the maximal payoff is $1 billion, and the loss aversion coefficient is 2, the maximal buying price will be $17.55 (assuming a seed value of $2). Even if the maximal payout is raised to $1 trillion, the bid will rise only to $22.71. These values are close to the 20 ducats that Bernoulli thought was reasonable.
Several critics have noted the weaknesses in these arguments. Bertrand argues that even if the house cannot pay the money, units of currency can be replaced with something that is much more plentiful, such as grains of sand, inches, or molecules of hydrogen, and the risk aversion remains (Reference DutkaDutka, 1988). By similar logic, the payment may even be purely hypothetical or it may be psychological (Reference AumannAumann, 1977; Reference MartinMartin, 2008). Furthermore, the house’s payment can remain fixed while the gambler’s is cut in half at each round (Reference KeynesKeynes, 1921; Samuelson, 1960, 1977). Finally, common sense shows that the bids are much lower than they would be if the maximal payout of the gamble was limited only by the supply of money in the world. Indeed, even though Bernoulli felt comfortable offering 20 ducats, our intuition is that a lower value would be more reasonable. Nonetheless, this hypothesis remains to be tested empirically.
1.3 Ignoring low probabilities and risk aversion
D’Alembert argued that probabilities less than 1/10,000 are essentially equal to zero. Buffon and Condorcet appear to have agreed (Reference SamuelsonSamuelson, 1977). Niklaus Bernoulli set the cutoff at a more conservative 1/100,000 (Reference DutkaDutka, 1988). The arbitrariness of these cutoffs was criticized by contemporaries, including Condorcet (Reference DutkaDutka, 1988), and by more recent thinkers (Reference ArrowArrow, 1951). Regarding D’Alembert’s view, Gibbon said, “if a public lottery were drawn for the choice of an immediate victim, if our name were inscribed on one of the 10,000 tickets, should we be perfectly easy?” (quoted in Samuelson, 1977). Contemporary thinkers recognize that small probabilities may be discounted psychologically (Reference MengerMenger, 1934; Reference SennettiSennetti, 1976; Reference WeirichWeirich, 1984).
This de minimis argument is subject to a counterargument that is similar to Menger’s super-St. Petersburg approach. If low probabilities are systematically discounted, then payoff can be increased to counterbalance this effect. Nonetheless, people will still presumably offer finite sums for the St. Petersburg gamble (Reference MartinMartin, 2008). Moreover, small probabilities are often exaggerated (Reference BlavatskyyBlavatskyy, 2005; Reference Kahneman and TverskyKahneman & Tversky, 1979), rather than being discounted, making this explanation unlikely.
1.4 Is the expected payoff of the St. Petersburg gamble infinite?
In a rare application of empirical methods, Buffon in 1777 hired a child to flip a coin until it came up heads, and to do so 2048 times. In 1838, Augustus De Morgan added another 2048 data points (Reference MoritzMoritz, 1923). De Morgan and Buffon both argued that actual experience demonstrates that the true expected value of the gamble is quite low, justifying the low value placed on the gamble. In more recent times, computers have made it possible to simulate coin flips more rapidly, and although estimated values are higher, the fundamental result does not change (Reference CeasarCeasar, 1984; Reference Hinners-TobraegelHinners-Tobraegel, 2003; Reference Liebovitch and ScheurleLiebovitch & Scheurle, 2000; Reference LopesLopes, 1981). Importantly, the results of these empirical studies are generally greater than bids people intuitively offer.
A few writers have suggested that the root of the paradox lies in the definition of expected value (Reference Gigerenzer and SeltenGigerenzer & Selten, 2002; Reference Liebovitch and ScheurleLiebovitch & Scheurle, 2000; Reference LopesLopes, 1981). Statistically, expected value is the central tendency of the distribution embodied in a risky gamble. For highly non-gaussian distributions the mean is not considered a valid estimator (Reference Hinners-TobraegelHinners-Tobraegel, 2003; Reference Liebovitch and ScheurleLiebovitch & Scheurle, 2000; Reference VivianVivian, 2003). The set of outcomes for the St. Petersburg gamble is infinitely positively-skewed, and thus highly deviant from this assumption or normality. Because the statistical mean is considered invalid for distributions highly non-normal distributions, the true expected value of the St. Petersburg gamble is undefined, not infinite (Reference Liebovitch and ScheurleLiebovitch & Scheurle, 2000; Reference LopesLopes, 1981).
The median, an alternative estimator of central tendency, is robust to noise and is often favored for highly skewed distributions (like the St. Petersburg). The median of the distribution associated with the St. Petersburg gamble is between $1 and $2, and is set by convention at $1.50 (Reference WeisssteinWeissstein, 2008). Theoretical considerations therefore support the idea that gambles in the St. Petersburg paradox reflect the application of the median. The median is mathematically similar to the expectation heuristic, by which people estimate the trial on which heads is most likely to appear, and bid accordingly (Reference TreismanTreisman, 1983). Importantly, the expectation heuristic is supported by empirical data, although these data may also support a median heuristic (Reference Bottom, Bontempo and HoltgraveBottom, Bontempo, & Holtgrave, 1989; Rivero, Holtgrave, Bontempo, & Bottom, 1990).
To distinguish between these two models, as well as to contribute more empirical data on this phenomenon, we collected responses of 200 individuals to several hypothetical variants of the St. Petersburg gamble and responses of 20 individuals to a real-stakes version of the St. Petersburg gamble. Our results support the idea that people estimate the value of the gamble using the median, thus endorsing this simple explanation of the St. Petersburg Paradox.
2 Methods
We performed one study using real stakes with twenty subjects. These subjects were recruited from the undergraduate and graduate student population at Duke University. Subjects were provided with either $10 or $5 (randomly chosen) one week before the survey took place. We introduced this delay in order to increase the feeling of ownership and thus to prevent subjects from feeling like they were gambling with “house money.” We used a variant of the Becker-DeGroot-Marschak auction (Becker & Brownson, 1964) to obtain valuations. In our variant, an outcome value from the St. Petersburg distribution was chosen at random, and then was augmented or decreased by one cent (randomly chosen, to reduce the likelihood of a tie). The subject’s bid was compared to this random number. If the bid was greater, the subject paid the value of the number and the gamble commenced; if the bid was lower, the gamble did not occur. We explained the details of the gamble and the auction carefully (see Supplement for details).
We performed a second study investigating hypothetical responses of 200 subjects to several variants of the St. Petersburg Paradox. An article by John Tierney about Dan Ariely in the New York Times offered readers the option to submit their email addresses and receive future surveys. We sent invitations to take web-based surveys to 700 of these email addresses. Of these recipients, 200 responded within two weeks, at which point we closed the survey. The population of subjects thus consists of people who were sufficiently motivated to provide their email addresses for future studies, and to then respond to a subsequent request for an additional survey. The first 100 respondents took survey 1 while subsequent respondents took survey 2, both available in the Supplement.Footnote 1 The survey consisted of a simple series of html documents using PHP for dynamic content and access to a database to store the results.
A preamble to the survey stated that “The probability of heads on the first toss is 50%; the probability of heads on the second toss is 25%; the probability of heads on the third toss is 12.5%, and so on.” The purpose of the preamble was to orient the subject to the general format of the questions. The first question was as follows: “Consider the following gamble: You may flip a coin. If it comes up heads, you receive $1. If it comes up tails, you will flip it again. If it comes up heads, you receive $2. If it comes up tails, you will flip it again. If it comes up heads, you receive $4. This process repeats until the coin comes up heads, with the payoff for heads doubling each time it comes up tails. If the opportunity to play this gamble was on sale, what is the maximum amount of money that you would pay for it?” By combining the preamble with the questions, we believe that we presented the puzzle as clearly as possible and removed, as much as possible, the potential for confusion. Twenty additional respondents answered the first question only. These subjects were undergraduate students in an introductory psychology class offered at Duke University. Survey recipients received a URL that linked to a webpage containing instructions for the survey.
In one analysis, we showed that the median payoff of the St. Petersburg gamble depends systematically on the number of times the gamble is repeated. We did this by use of a bootstrap simulation (Figure 3D). Each point on the graph represents the mean outcome per repetition that a gambler can expect (ordinate) in a string of St. Petersburg gambles repeated r times (abscissa). To determine the ordinate for each value of r, we repeated the St. Petersburg r times, and took the mean payoff. We then repeated this process 10,000 times, and took the median of these 10,000 generated numbers. Thus each point on the line represents the outcome of (10,000 · r) individual St. Petersburg gambles. The mean of these numbers does not depend on the number of times the gamble is repeated (see Reference SamuelsonSamuelson, 1963).
3 Results
3.1 The standard St. Petersburg gamble
The median bid of subjects (n=20) faced with the real-world version of the St. Petersburg gamble was $1.75. The median bid of subjects faced with a hypothetical St. Petersburg gamble was $1.50 (n=220). These bids did not differ significantly (Wilcoxon rank-sum test, p>0.4). This match between these two groups confirms that differences in the method of elicitation do not strongly influence choices. This first group of 20 subjects then answered the first survey (see Appendix). These subjects’ choices did not differ significantly from those made by our internet subjects, confirming that these two groups had overlapping preferences (Wilcoxon rank-sum test, p>0.15 in all cases).
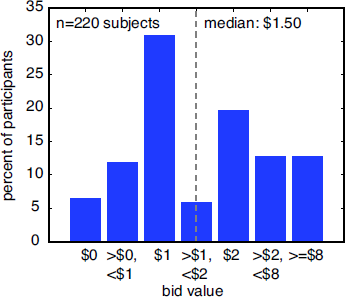
Bids for the hypothetical St. Petersburg gamble ranged from zero to $50,000 (Figure 2). The median bid was $1.50, and the distribution of bids had strong modes at $1 and $2. Of the 220 responses, 14 (6.4%) refused to gamble, 26 (11.8%) offered positive values less than $1, and 68 (30.9%) offered $1, the modal bid. 13 (5.9%) offered between $1 and $2 and 7 (3.18%) offered the median bid ($1.50). 43 (19.6%) people offered $2, and 56 (25.5%) offered more than $2.
Figure 2: Histogram of bids offered for the standard St. Petersburg paradox. Although the expected value of the gamble is infinite, all bids were finite. The median bid was $1.50. The distribution was bimodal, with large modes at $1 and $2.
We made every effort to ensure that our subjects understood the task. To verify this, we asked a probe question of the 20 human subjects who performed the real Petersburg gamble. We asked them to indicate what they believed the probabilities were of obtaining $1, $2, $4, $8, $16, $32, and $64. These subjects all performed correctly, indicating that they understood the probabilities, and suggesting that the majority of the other subjects also understood the probabilities.
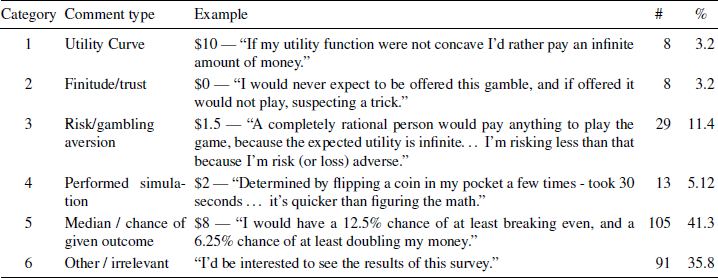
On all questions, subjects were offered the option to explain their rationale. We received 254 comments (median bid for these subjects, $1.50). We coded all responses based on which explanation best matched. A strong plurality related to the median argument (Table 1). Explanations in this category referred to the probabilities of obtaining specific outcomes as being the critical factor influencing options (as also found by Lopes, 1996). Collectively, these comments support the notion that subjects make use of the median in estimating the value of the St. Petersburg gamble.
Table 1 Explanations for gamble offers. We coded responses into 6 categories, corresponding to the major theories explaining St. Petersburg offers. The most common class of explanations focused on the chance of a given outcome occurring. Actual examples are given for each category.
3.2 Changing the seed value
To probe the robustness of the median heuristic, we examined responses in several variants of the standard St. Petersburg gamble. In one set of questions, we manipulated the gamble’s “seed value,” but kept the structure of the gamble the same (Figure 3A). We tested four seeds: $0.01 (1 cent), $0.50, $1 (the standard gamble), and $4 (Figure 3A). If the median outcome is a driving factor in valuations, then bids should follow the average of the first two outcomes (i.e. the median). If instead concave utility curves are a major factor, gambles with smaller stakes would elicit larger bids relative to the seed value (since possible outcomes are lower and must be less discounted; see Reference SamuelsonSamuelson, 1960). Similarly, if the gambler believes the house’s wealth has a particular limit, then gambles with lower stakes must elicit greater relative bids. However, relative bids did not vary with seed, and were nearly identical to the median in all cases (Wilcoxon rank sum test, p>0.2).
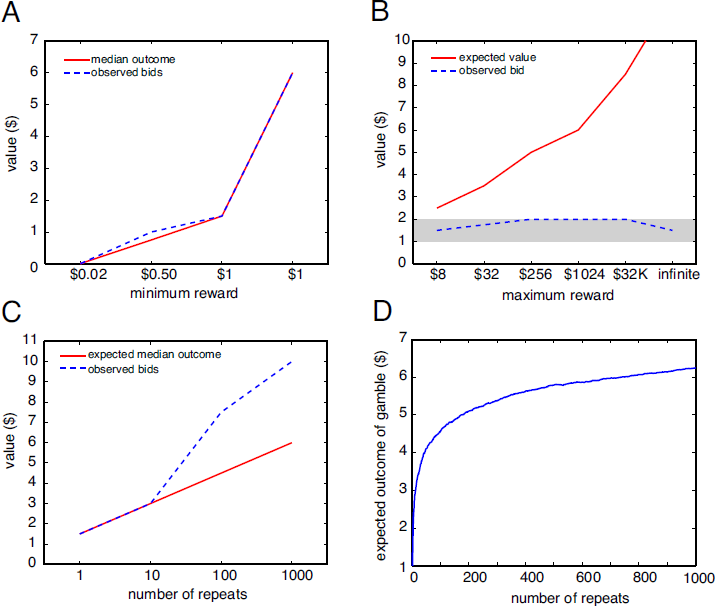
Figure 3: Bids in variants of the St. Petersburg paradox.
A. When the stakes are varied, bids (blue dashed line) closely track the median (red solid line). Expected value (mean) is infinite for all variants.
B. When the St. Petersburg gamble is truncated, the median remains $1.50 (gray shadow), but the mean grows with the truncated value. Bids remain low, close to the median. The standard St. Petersburg gamble has an infinite expected value, and is the rightmost point on the graph.
C. As the St. Petersburg gamble is repeated, offered bids per gamble grow. The offer bids closely tracks, but over-estimates, the expected median value of the series of gambles. Means do not change as the gamble is repeated.
D. Median outcome per gamble of repeated St. Petersburg gamble increases as a function of number of repeats. The more repeats the gambler faces, the greater the value of each gamble. Although the function is concave, it is unbounded.
3.3 The truncated St. Petersburg gamble
In the truncated variant of the St. Petersburg gamble, coin-flipping stops if some predetermined maximum payout is achieved (Figure 3B). This finite variant circumvents any question about the ability of the house ability to pay, as well as any arguments concerning the strangeness of infinity (Reference MartinMartin, 2008). We examined bids for the St. Petersburg gamble truncated at 3 flips (maximum $8, EV: $2.50), 5 flips (maximum $32, EV: $3.50), 8 flips (maximum $256, EV: $5), 10 flips (maximum $1024, EV: $6) and 15 times ($32,768, EV: $8.50). In all cases, the median value of the gamble was identical (between $1 and $2). Bids for these gambles were either $1.50 or $2, and did not covary with expected value (Wilcoxon rank-sum test, p>0.05 for all pairs).
3.4 The repeated St. Petersburg gamble
According to the Law of Large Numbers, the average value of a stochastic variable repeatedly drawn from almost any distribution will eventually converge on a single value. This property applies to almost all gambles we encounter, a fact that allows us to assign an expected value to any gamble. A simple consequence of this fact is that casinos and insurance agencies cannot predict whether a single gamble or car trip will produce a profit or a loss, but can reliably predict the profitability of a group of gambles or drives. However, a few distributions deviate so strongly from the assumptions of the Law of Large Numbers that repeated samples do not converge on any value. The St. Petersburg Paradox is one such distribution. The expected value of such distributions is not defined. It is fallacious therefore to argue that the St. Petersburg paradox has an infinite expected value.
One consequence of this degenerate behavior of the St. Petersburg distribution is that the median payoff of the gamble depends on the number of times the gamble is repeated. This strange property of the median is a consequence of the fact that the repeated gamble may occasionally lead to long strings of tails that give extremely large rewards (Reference Liebovitch and ScheurleLiebovitch & Scheurle, 2000). To confirm this counterintuitive result, we ran a simple Monte Carlo simulation (Figure 3D). Each point on the abscissa corresponds to a number of repeats of the gamble, while each point on the ordinate shows the expected payoff per gamble obtained from 10,000 independent simulations.
We hypothesized that subjects would intuitively recognize these facts, and bid more as more gambles are offered. In contrast, the utility curve explanation, and most of its variants, necessarily predict decreasing valuations as the gamble is repeated (since marginal utility declines, the multiplying of payouts associated with repeated gambles would dampen enthusiasm for multiple gamble). Similarly, the finitude argument predicts decreasing valuations as more gambles are offered (since the house’s limit is more likely to be reached with more gambles). We offered subjects 1, 10, 100, and 1000 repeats of the St. Petersburg gamble (Figure 3C). We found systematically greater offers with greater number of repeats, with bids closely tracking the expected median (these bids differed significantly, Wilcoxon rank-sum test, p<0.01 in all cases). Overbidding for the 100 and 1000 repeat condition may reflect failures to perform the complex calculations needed to estimate the expected median, or they may reflect the contribution of other factors.
4 Discussion
The St. Petersburg paradox has generated abundant speculation but very few empirical data. (Martin, 2008, provides the best summary of the theories.) This paucity of data has obscured the fact that most proffered explanations are poor predictors of bids for this gamble. Our data set, consisting of 20 real bids and 220 hypothetical bids for each of several variants, addresses this lack of data. We present three main findings.
-
1. Observed bids for the original form of the St. Petersburg gamble are much lower than is commonly supposed. Specifically they are lower than twice the smallest payoff. This finding is inconsistent with the majority of proffered explanations, but is consistent with a median heuristic.
-
2. Bids are only weakly affected by truncating the gamble, are strongly affected by repeating the gamble, and depended linearly on the initial ‘seed’ value of the gamble. These findings are inconsistent with the majority of proffered explanations, but are consistent with a median heuristic.
-
3. Contrary to popular belief, the expected value of the St. Petersburg gamble is not infinite, but is instead undefined. The St. Petersburg gamble’s infinite variance, a consequence of its fractal nature, means that it violates a critical assumption of the law of large numbers.
Because the St. Petersburg gamble has no expected value, we conjecture subjects instead use the median, which provides a well-defined, robust, estimator of central tendency, instead. The median is an appealing tool for decision-makers. It is simple, cognitively plausible, and is less susceptible to noise, error, and outliers than the mean. These data are not explained by any of the major alternative approaches outlined above, although other psychologically plausible mechanisms may also explain the data.
We thus argue that true root of the St. Petersburg Paradox lies in the definition of expected value (Reference Gigerenzer and SeltenGigerenzer & Selten, 2002; Reference Liebovitch and ScheurleLiebovitch & Scheurle, 2000; Reference LopesLopes, 1981). Expected value is the central tendency of the distribution embodied in a given gamble. For a Gaussian distribution, the central tendency is given by its mean. For highly non-gaussian distributions, such as the St. Petersburg gamble, the mean provides a poor estimate (Reference Hinners-TobraegelHinners-Tobraegel, 2003; Reference Liebovitch and ScheurleLiebovitch & Scheurle, 2000). Consequently, the true expected value of the St. Petersburg gamble is not infinite, but is undefined, so no bid is inconsistent with theory, and there is no paradox (Reference Liebovitch and ScheurleLiebovitch & Scheurle, 2000; Reference LopesLopes, 1981). Indeed, misapplication of the mean to non-Gaussian disrtibutions may cause several other fascinating paradoxes (Reference BlythBlyth, 1972; Reference HackingHacking, 1980; Reference Schwitzgebel and DeverSchwitzgebel & Dever, 2008).
A few previous studies have used empirical methods to investigate the St. Petersburg paradox (Reference Bottom, Bontempo and HoltgraveBottom, Bontempo, and Holtgrave, 1989; Rivero, Holtgrave, Bontempo, and Bottom, 1990; Cox, Sadiraj, and Vogt, 2008; Reference Kroll and VogtKroll and Vogt, 2009). In two closely-related studies, subjects chose hypothetical bids and sale prices in accordance with the “expectation heuristic” (Reference Bottom, Bontempo and HoltgraveBottom, Bontempo, & Holtgrave, 1989; Rivero, Holtgrave, Bontempo, & Bottom, 1990). The expectation heuristic argues that subjects simplify the problem by assuming that the coin will come up heads on the second flip (i.e., the expected flip), which is mathematically similar to the median heuristic (Reference TreismanTreisman, 1983). Various results in their data sets both supported and contradicted this theory, although most supported it (Reference Bottom, Bontempo and HoltgraveBottom, Bontempo, & Holtgrave, 1989). Although similar to the median heuristic, the expectation heuristic predicts bids of $2 in our statement of the St. Petersburg paradox, while the median heuristic predicts bids in the range of $1-$2. Thus our observation that bids are $1.50 (for hypothetical gambles) and $1.75 (for real gambles) are slightly lower than the expectation heuristic, and the diversity of responses with strong modes at $1 and $2 is more consistent with the median heuristic. Moreover, the expectation heuristic predicts that the prospect of repeating the gamble should not affect bids, which is inconsistent with our observed results. Nonetheless, due to the similarities between the expectation heuristic and the median heuristic, we believe that these earlier data provide complementary evidence to that provided here. Thus, the present results build on and extend these earlier results, showing that preference for median bids is preserved with additional variants of the paradox, and is preserved when bids are made with real stakes.
We do not believe that risky decision-making consists solely of identifying the median outcome, but we think that the present data argue that estimating the median, or some other ordering statistic, is a critical step in the decision-making process in this task. Instead, we suspect that people choose from several available strategies, and perhaps combine multiple strategies (Reference Gigerenzer and SeltenGigerenzer & Selten, 2002; Reference Payne, Bettman and JohnsonPayne, Bettman, & Johnson, 1993) based on specific task demands (Reference Payne, Bettman and JohnsonPayne, Bettman, & Johnson, 1993). Moreover, we acknowledge that many other models of risky decision-making may explain these results as well, although we wish to emphasize that observed bids are much lower than those predicted by most standard models in behavioral economics. Thus, we are not certain that any of the major models can explain all the results shown here without substantial modifications. In any case, the median provides a parsimonious and compelling model for risky decision-making.
The present results do not implicate the median heuristic in gambles outside the context of the St. Petersburg paradox; subsequent studies will be needed to determine whether this strategy is applicable in a wider array of decisions. We note that use of the median in non-St. Petersburg gambles has some empirical support (Reference LopesLopes, 1996; Reference Wedell and BoeckenholtWedell & Boeckenholt, 1994). We would predict that the median would be especially likely to be used for highly non-gaussian distributions, including exponential distributions like the St. Petersburg gamble, where the mean is a poor estimator of central tendency. Interestingly, another familiar non-Gaussian distribution is the standard two-outcome gamble. Several writers have argued that expected values are irrelevant for such gambles (Reference KnightKnight, 1921; Reference LopesLopes, 1981; Reference WeaverWeaver, 1963). As Moritz says, “the mathematical expectation of one chance out of a thousand to secure a billion dollars is a million dollars, but this does not mean that anyone in his senses would pay a million dollars for a single chance of winning a billion dollars” (Reference MoritzMoritz, 1923).


