No CrossRef data available.
Published online by Cambridge University Press: 18 August 2016

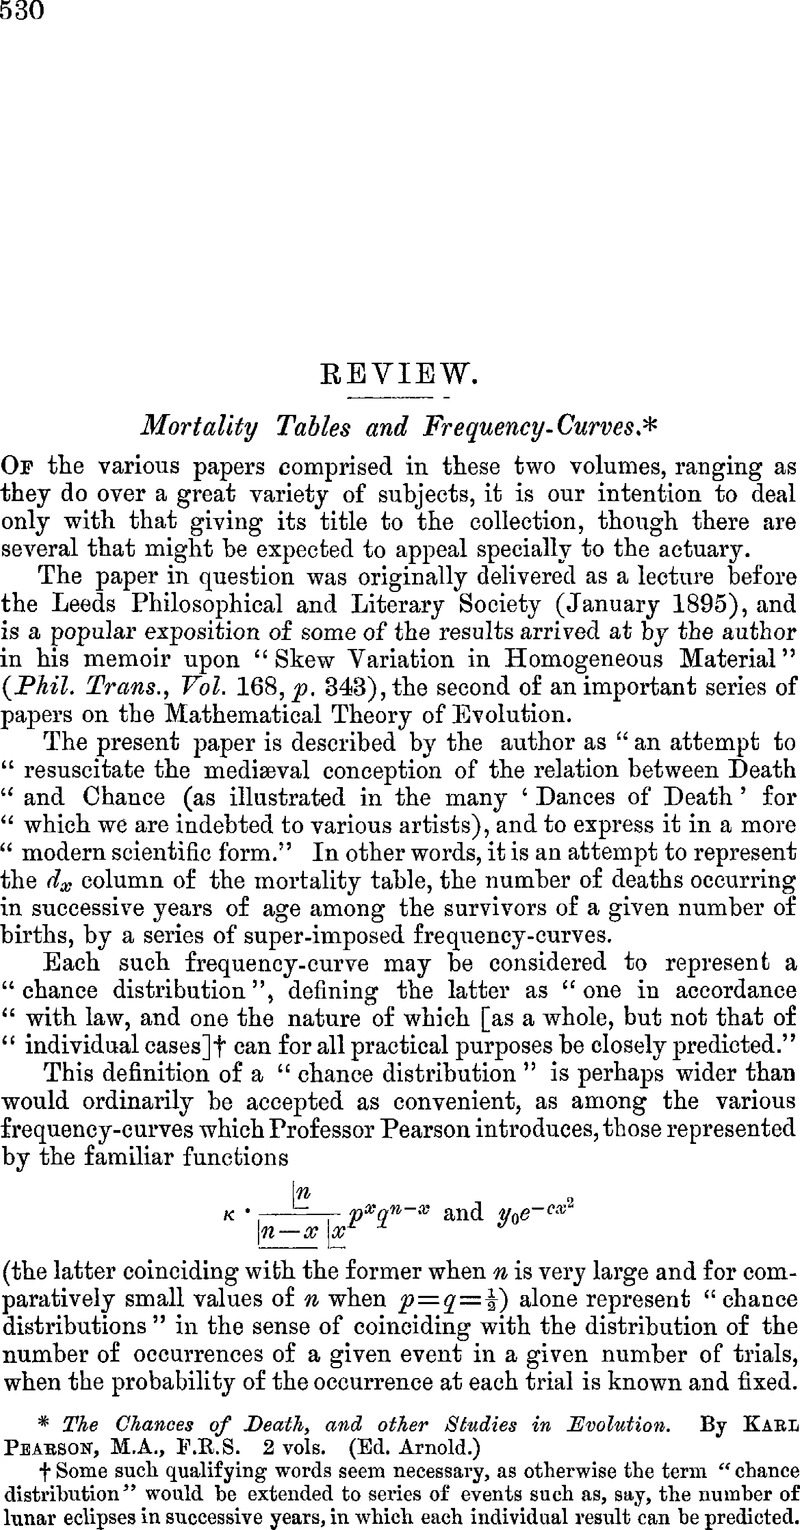
page 530 note † Some such qualifying words seem necessary, as otherwise the term “chance distribution” would be extended to series of events such as, say, the number of lunar eclipses in successive years, in which each individual result can be predicted.
page 531 note * This method, where a single curve only is in question, consists in obtaining expressions in terms of the constants for the 2nd, 3rd, 4th, &c, “moments” of the curve, that is for the sum of the ordinates multiplied by the squares, cubes, &c, of their distance from the “mean”, and comparing these expressions with the corresponding numerical values easily obtained from the unadjusted figures. This process is as convenient as it is ingenious, and the only drawback we see, and this is not perhaps important, is that undue weight would seem to be given to the extremes of the curve where the facts are usually very scanty.
page 533 note * See Supplement to the 55th Annual Rept, of the Registrar General, Part I, page 4. A population table is, of course, not a Life Table, and in the former, assuming the population to be an increasing one, the points of maximum mortality corresponding to the various causes of death would all be shifted towards the younger ages; only slightly where the maximum is strongly marked, but more appreciably so where the maximum is feebly marked.