Introduction
In this article, we draw on national social survey data to identify and report on the social determinants of wellbeing in the UK and we consider some of the challenges the findings present for social policy. In the first section, we review some of the latest developments in subjective wellbeing (SWB) research, and we consider how SWB is now being measured by the Office for National Statistics (ONS) in the UK. In our empirical section, we develop bivariate and multivariate logistic regression models, as well as testing for interaction effects, in order to assess the socio-economic and demographic characteristics that help to predict wellbeing in the national population. We do so using four global measures of SWB. Finally, in the last section, we consider some of the potential social policy implications raised by the findings. Before describing the study methods and results, and discussing their implications, we review the UK's new ‘Measuring National Wellbeing (MNW) Programme’.
Measuring subjective wellbeing and the policy process
It is now widely accepted that traditional economic measures are necessary, but not sufficient, to reflect national wellbeing (Stiglitz et al., Reference Stiglitz, Sen and Fitoussi2010). In recent years, measures of SWB have been refined to help monitor social progress and policy (Taylor, Reference Taylor2011). Governments around the world – including the British government – are increasingly concerned about the quality of life and the environment in which we live, as well as the traditional measures of GDP and economic growth that help to define living standards in society (Stratton, Reference Stratton2010).
The measurement of SWB has advanced rapidly over the last two decades (Diener, Reference Diener2009a). Researchers usually draw a basic distinction between self-reported wellbeing, i.e. SWB, and the more objective non-self-reported assessments and measures (Diener, Reference Diener and Diener2009b). In this article, we are only interested in subjective measures. Broadly speaking, as Dolan and Metcalfe (Reference Dolan and Metcalfe2012) maintain, there are three main theoretical strands underpinning the measurement of SWB which are relevant to this study:
• The ‘evaluative’ approach to SWB asks individuals to reflect on their life and make a cognitive assessment of how their life is going overall, or on certain aspects of their life. ‘Life satisfaction’, as used here, is dependent on a global appraisal of life.
• The ‘hedonic’ approach seeks to measure people's feelings and emotions as Diener (Reference Diener2009a) observes. General states of ‘happiness’ and ‘anxiety’ are used in this study, which form part of the more global cognitive appraisal of wellbeing.
• The ‘eudemonic’ approach, sometimes referred to as the psychological functioning or flourishing approach, draws on self-determination theory and taps into our sense of purpose and meaning in life, with notions of the ‘worthwhile’ life employed here.
In the classical philosophical tradition, interpretations of eudaimonia and human flourishing were defined by Aristotle as the highest human good and included such things as spiritual fulfilment and civic virtue (Bok, Reference Bok2010). Naturally, the MNW Programme does not cover all aspects of ‘eudemonic wellbeing’ but there are of course other more objective measures of human wellbeing, of equality and human rights, and capability, being developed and refined for the development of social policy (Dean, Reference Dean2010).
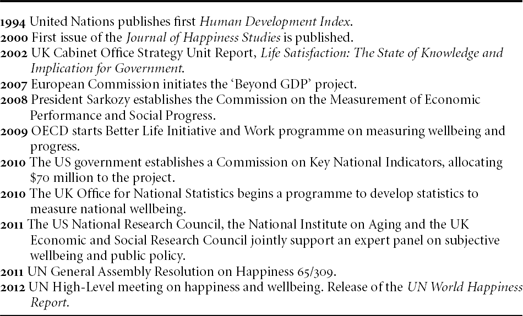
Interest in the idea of national accounts for monitoring population wellbeing is growing (Diener et al., Reference Diener, Lucas, Schimmack and Helliwell2009a) and SWB measures and findings are increasingly being used to inform and appraise social policy (Dolan and Metcalfe, Reference Dolan and Metcalfe2012). In the UK, the MNW Programme was launched by the ONS in 2010, as a response to the growing domestic as well as international policy imperative (Table 1). The programme is designed to provide new statistical measures of SWB, urgently needed to help monitor social progress and shape the direction of social policy. Following the recommendations of Dolan and Metcalfe (Reference Dolan and Metcalfe2012), and those of Stiglitz et al. (Reference Stiglitz, Sen and Fitoussi2010), ONS now attempts to capture the three different components of SWB in household surveys (ONS, 2011a, 2011b, 2011c, 2012).
TABLE 1. Key developments in measuring wellbeing

Source: Parliamentary Office of Science and Technology (POST) (2012: 2).
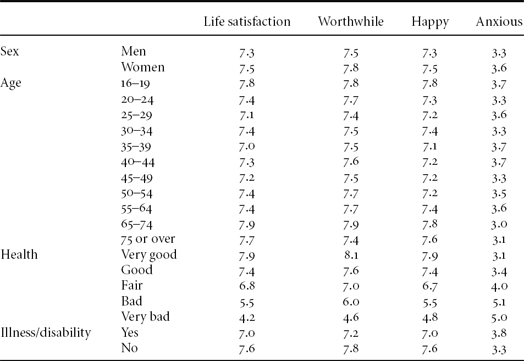
The ONS have discussed their emerging survey findings on SWB in various publications (e.g., ONS, 2011a, 2011b). Although their investigations are informative, the ONS has, however, deliberately stopped short of any sophisticated analysis of data, including the sort of multivariate modelling that is required to shed greater light on the complexity of SWB in the social world (Byrne, Reference Byrne2011). To-date, ONS reports have largely been descriptive, showing basic cross-tabulations and average estimates of SWB for different sections of the population (as shown in Table 2, for example). Their findings do not reveal with any degree of certainty which sections of the British population are particularly vulnerable to experiencing low levels of SWB. Yet we know from the international research literature that a range of socio-demographics (e.g., age, gender, income, household composition, unemployment and disability) can help to explain wellbeing (e.g., Clark and Oswald, Reference Clark and Oswald1994; Stack and Eshleman, Reference Stack and Eshleman1998; Layard, Reference Layard2005; Clark, Reference Clark2006; Blanchflower and Oswald, Reference Blanchflower and Oswald2008; Dolan et al., Reference Dolan, Peasgood and White2008; Oswald and Powdthavee, Reference Oswald and Powdthavee2008; Diener et al., Reference Diener, Kahneman, Arora, Harter, Tov and Diener2009b). There is, therefore, a pressing need to analyse the new social survey data with multivariate regression and modelling techniques (where all the different socio-demographic characteristics are taken together and controlled for) in order to shed more light on the correlates of SWB in the UK. Although officials have not undertaken this work themselves, they are actively encouraging the research community to do so.Footnote 1
TABLE 2. Average (mean) ratings for the four overall subjective – monitoring questions by personal characteristics (sex, age, self-reported health and long standing illness or disability: Great Britain, adults aged 16 and over)

Source: Reference tables for investigation into subjective well-being data from the ONS Opinions Survey (ONS, n.d.).
Methods
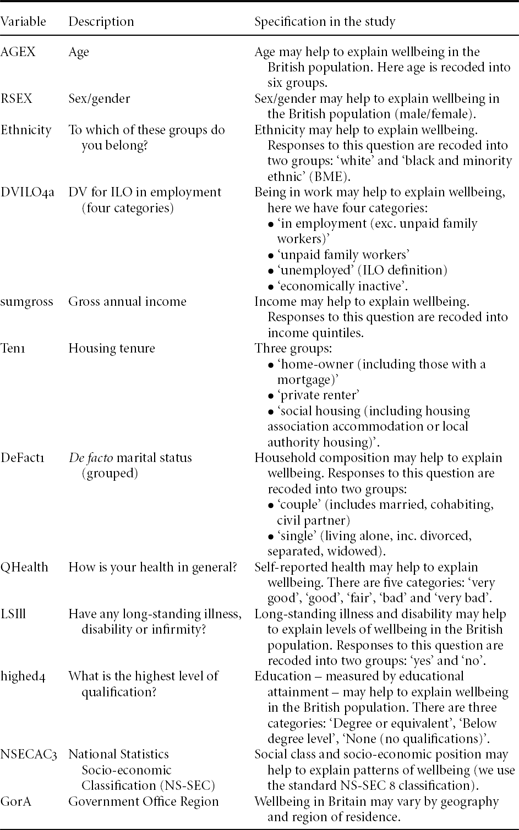
Logistic regression, in SPSS (version 19.0), was used to identify the social determinants of SWB in the national population. We use the four global measures of SWB discussed above (with the relevant ONS variable codes shown in Table 3), and we draw on the range of socio-demographic factors captured by the ONS survey (Table 4) to examine the risk and relative odds of low SWB in the British population (ONS survey described in the Appendix below).
Logistic regression is a statistical technique that belongs to the theoretical framework of the General Linear Models (GLM), described by Dobson (Reference Dobson2001), and is ideally suited to situations where a continuous response variable, such as SWB, has been categorised as a dichotomy using binary coding (Hosmer and Lemeshow, Reference Hosmer and Lemeshow2000). For the analysis therefore, we have created new binary variables on each measure of wellbeing: for ‘unhappiness’, ‘anxiety’, ‘dissatisfaction’ and feeling that life is ‘unfulfilled’. Persons scoring 4 or below on the question about ‘happiness’, for instance, are coded as (1) ‘unhappy’, while those scoring 5 or above are coded as (0) ‘happy’. This dichotomy was repeated for the other measures of SWB. Respondents who did not answer the survey questions on wellbeing are not included in this study.
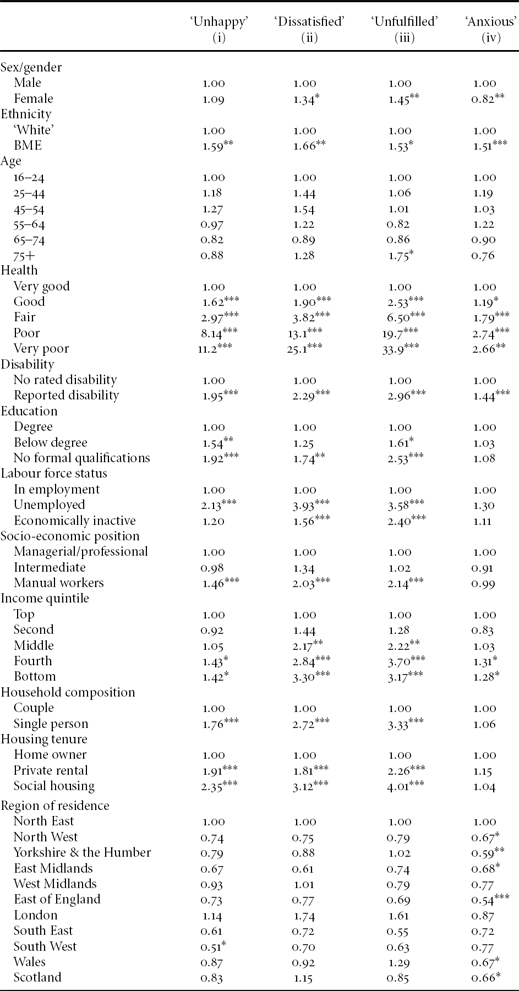
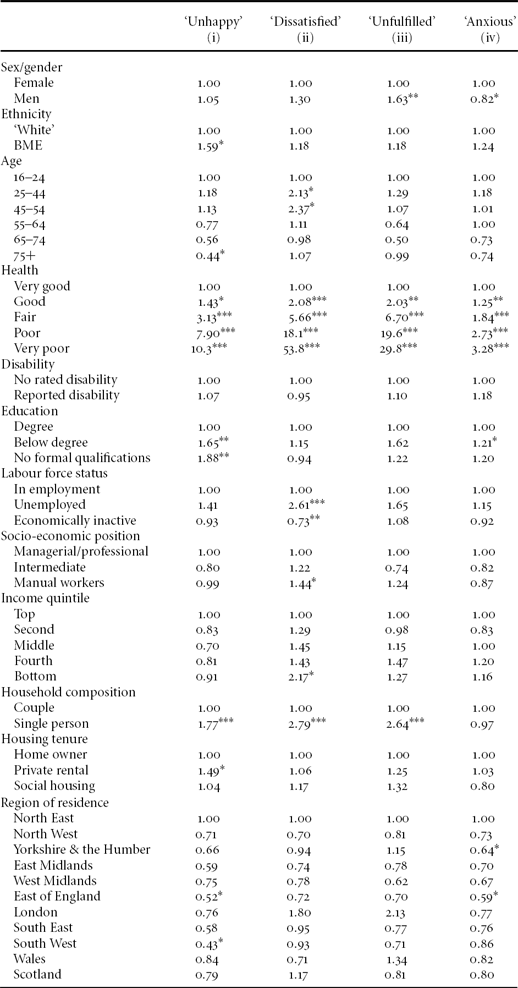
The empirical strategy follows logical sequential steps. First, our bivariate logit models establish the relative odds of wellbeing, along the different dimensions, by the range of individual and household characteristics, but without taking account of any of the other variables (the results are shown in Table 5). A bivariate model is a fairly simple one that shows the relationship between two variables, although many predictive factors are likely to be interrelated – there are often clear links between age, health and income for instance. There is a need for multivariate analysis. Importantly, the relative odds of reporting or predicting high or low levels of SWB independent of other variables can be calculated using a multivariate model (independent here means after taking account of all of the other demographic and socio-economic variables in the model). Much of the discussion below focuses on the findings from the multivariate analysis shown in Table 6, with cross-referencing to the bivariate findings in order to help understand some of the complexity surrounding the social determinants of SWB. Finally, we examine for covariance and interactions between variables in the main effects multivariate model (results are shown in Tables 6 and 7).Footnote 2
TABLE 5. The relative odds of wellbeing (bivariate model)

Notes: Significance levels: *<0.05; **<0.01; ***<0.001.
TABLE 6. The relative odds of wellbeing (multivariate model)

Notes: Significance levels: *<0.05; **<0.01; ***<0.001.
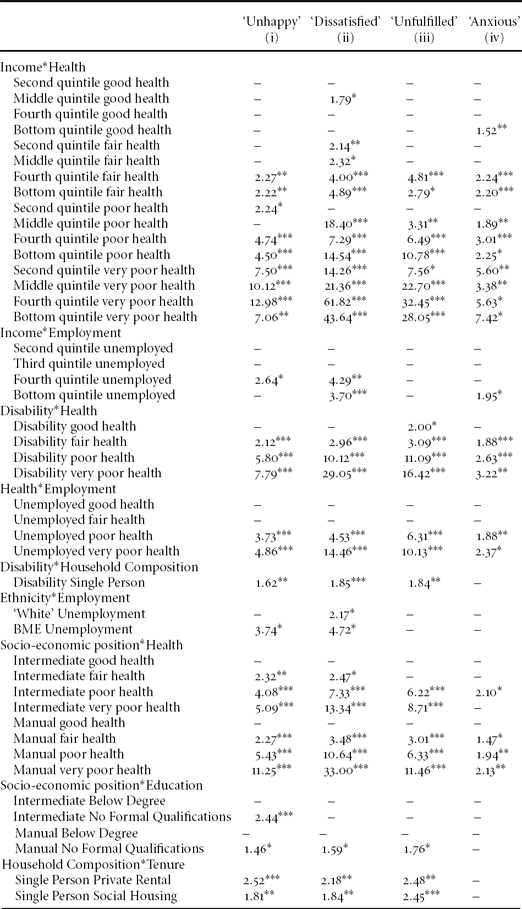
TABLE 7. The relative odds of wellbeing (significant interactions in the main effects model)

Significance levels: *<0.05; **<0.01; ***<0.001.
In the statistical models, those who report being ‘happy’, or ‘satisfied’ with life, not suffering with ‘anxiety’ or leading ‘worthwhile’ lives (being the majority in each case) form the base in each model. Logistic regression models are then able to calculate the relative odds of being ‘unhappy’, ‘dissatisfied’, ‘anxious’ or leading an ‘unfulfilled’ life by the range of socio-demographic factors shown in Table 4. The odds compare the chances of being ‘happy’ verses being ‘unhappy’ etc., with the relative odds reflecting the odds of one particular category compared to the reference. These odds ratios show the strength and the direction of the predictors – asterisks indicate the level of significance and the ‘base case’ is always 1.00. All study calculations are weighted (see Appendix) to correct for non/differential response rates, in order to ensure study estimates relate to the national picture (Crockett, Reference Crockett2006).
Results
A first step in the analysis was to examine the survey data relating to SWB in the British population. Overall, the survey results suggest that wellbeing in the national population is largely positive, not negative, and this is to be expected (Deaton, Reference Deaton2008). We find that most people in the UK, 88.6 per cent, are ‘happy’, leaving 11.4 per cent of the population who are not. We also find the overwhelming majority of people report they are ‘satisfied’ with their life – 92.4 per cent – compared to just 7.6 per cent who are not. According to the survey, most people in Britain (94.4 per cent) appear to lead ‘meaningful’ lives; only 5.6 per cent claim life is not ‘fulfilled’. ‘Anxiety’ is more prevalent however: over a third of people (37.4 per cent) report feeling ‘anxious’ about life when surveyed, leaving 62.6 per with little or no such ‘anxiety’. The study findings are now discussed under the four relevant headings.
‘Happiness’
In Table 6 (column (i)), we observe that age, ethnicity, health, education, household composition and housing tenure continue to have an impact on ‘happiness’ in Great Britain, even after controlling for all other factors in the model, as does geographical region. Interestingly, income was a significant predictor of ‘happiness’ in the bivariate analysis, but the income effects on ‘happiness’ are lost after controlling for all of the other variables. This suggests that the effects of income on ‘happiness’ are moderated by other socio-demographic characteristics in the model, notably by health status, according to the strong interactions with income (observed in Table 7), and employment status to a lesser degree.
Gender, social class and labour-force status do not appear to have much of an impact on ‘happiness’ after controlling for everything else; neither does disability. Disability was a significant predictor of ‘unhappiness’ in the bivariate model, but has an independent effect in the multivariate analysis. In Table 5, for instance, the odds of adults who report a disability being ‘unhappy’ are twice those of non-disabled adults. However, the effects of disability are significantly diluted or covered by the inclusion of other variables in the model (suggesting evidence of multicollinearity here),Footnote 3 particularly with the more global assessment of health status, itself a powerful predictor of SWB across all four dimensions (columns (i)–(iv)). We say more about interaction effects below.
Health status is a strong determinant of ‘happiness’. Other things being equal, the odds of people in very poor health being ‘unhappy’ are ten times those of people in very good health (column (i)); the odds for those in poor health are eight times greater and three times greater for those who report their health is fair. The findings for socio-economic status are more curious; we find manual workers are significantly more likely to be ‘unhappy’ without controls, whereas the ‘social class’ effects on ‘happiness’ are clearly moderated with the controls in place. The results also show an age effect: people in the oldest age group (seventy-five-plus) are significantly more likely to be ‘happy’ than young people aged sixteen to twenty-four (Table 6). Belonging to a black and minority ethnic (BME) group also significantly increases the relative odds of being ‘unhappy’ by 60 per cent, compared to the majority ‘White’ British population. There are also important interactions between ethnicity and other variables in the multivariable model, which are discussed in the section on interactions below.
Education is also an important predictor of ‘happiness’, independent of other factors. The relative odds of being ‘unhappy’ increase significantly with lower levels of educational achievement. For example, the relative odds of reporting ‘unhappiness’ for those with educational attainment below the level of university degree is two-thirds greater than those with a university degree. Those with no formal qualifications display nearly twice the odds of reporting ‘unhappiness’ compared to people awarded a university degree. Household composition and housing tenure also matter (Table 6). The odds of single people living alone reporting ‘unhappiness’ are nearly 80 per cent greater than people living together as a couple. The odds of people in private rented accommodation being ‘unhappy’ are 50 per cent greater than those of a ‘home-owner’ (which includes people buying their own home with a mortgage). Furthermore, there appears to be regional variation in levels of ‘happiness’ across the country. The South West was found to be the ‘happiest’ place to live, being consistent with other surveys of SWB (Anand et al., Reference Anand, Hunter, Carter, Dowding and van Hees2009). The region is unremarkable on traditional economic indicators however, for example, GDP or GVA (ONS, 2011d), thus providing further caution against taking simple economic statistics as measures of social progress and wellbeing, as Harvie et al. (Reference Harvie, Slater, Philp and Wheatley2008) argue.
‘Life satisfaction’
On the ‘life satisfaction’ measure (column (ii)) of self-assessed wellbeing there are some notable differences compared to the findings for ‘happiness’. Income and socio-economic position now matter. Manual workers and those at the bottom of the income distribution all report higher levels of ‘dissatisfaction’. The odds of manual workers reporting ‘dissatisfaction’ with their lives, for instance, are more than 40 per cent greater than representatives from the managerial and professional classes. We also see in Table 6 that the odds of respondents in the lowest income quintile reporting ‘dissatisfaction’ are more than twice those of respondents in the top income quintile.
Age matters too in the multivariate analysis of ‘life satisfaction’. As expected, during the period of middle age (twenty-five to fifty-four) there is increased ‘dissatisfaction’ with life. Although this familiar U-shape to wellbeing across the life-course is not fully understood, clearly this is a time of struggle for most adults, as they start to build a family and buy a home (Blanchflower and Oswald, Reference Blanchflower and Oswald2008). Household composition also matters – as it did for ‘happiness’ – but not housing tenure on this measure of SWB. Other things being equal, the odds of single people living alone reporting to be ‘dissatisfied’ are now three times greater than those of people living together as a couple.
Ethnicity appears to be less decisive on this particular dimension of wellbeing, at least after controlling for all the other variables in the multivariate analysis. People from BME backgrounds appear to experience the same or similar levels of ‘life satisfaction’ as the majority ‘White’ British population. However, since we observe significant levels of ‘dissatisfaction’ in the bivariate analysis we may wish to question the adjustments in the multivariate model. At times it may be problematic to give the appearance of having adjusted for, and thereby having ‘removed’, any socio-economic differences in the statistical model while much of it remains in real life (Karlsen et al., Reference Karlsen, Becares, Roth, Craig, Atkin, Chattoo and Flynn2012). A similar picture is present in the findings on disability status. Adults with a disability appear more ‘dissatisfied’ with life in the bivariate analysis, and yet disability is no longer significant when all of the other variables are controlled for in the model. Again this suggests that it is the social barriers and some of the observed health effects that impinge upon those who report an impairment (Roulstone and Prideaux, Reference Roulstone and Prideaux2012). In other words, it is the circumstances of living with a disability that matter rather than simply the notion or label of ‘disability’ itself. For example, the odds of being ‘dissatisfied’ for a disabled person living alone are nearly twice those of a disabled person living in a couple (Table 7). Good health is a strong determinant of ‘life satisfaction’ in the general population. The independent health effects observed are even more pronounced than those found on the measure of ‘happiness’. For instance, the odds of reporting ‘dissatisfaction’ amongst people who claim their health is very poor are now over fifty times greater than those of people who report that their health is very good (Table 6). While the odds of ‘unhappiness’ for those in poor health are eighteen times greater and six times greater for those who claim only fair health.
Education was found to be an important predictor of ‘happiness’ but not so for ‘life satisfaction’. There was little or no meaningful variation according to educational attainment. Being educated to university degree level appears to make no more difference to overall ‘life satisfaction’ than having no formal educational qualifications. Conversely, while labour market participation had little or no effect on ‘happiness’, employment now seemingly alters perceptions of ‘life satisfaction’. The odds of an unemployed person being ‘dissatisfied’ with life are more than two-and-a-half times those of someone in work. Interestingly, someone who is ‘economically inactive’, having retired from paid work or being a full-time student, is much more likely to be ‘satisfied’ with life.Footnote 4 Unlike the findings relating to ‘happiness’, we observe no meaningful difference in the global assessments of ‘life satisfaction’ by geographical region. In other words, ‘life satisfaction’ appears to be fairly evenly distributed across the regions of Great Britain.
‘Fulfilled lives’
Although research has yet to identify the precise constituents that add meaning to our lives, and help make them worth living, we can, nonetheless, consider some of the relative socio-demographics associated with the life ‘fulfilled’ (column (iii)). In many ways, the multivariate results for ‘worthwhile lives’ (a measure of ‘eudemonic’ wellbeing) mirror the study findings for global ‘life satisfaction’. There are, however, a number of contrasting findings. Women, for instance, are significantly more likely to report a stronger sense of purpose and meaning to their lives than men. This is interesting, not least because we found no significant difference by sex/gender on the ‘happiness’ and global ‘life satisfaction’ measures of SWB.
Good health helps life to be fulfilled. The odds of leading ‘unfulfilled lives’ amongst people who self-report very poor health, for example, are now thirty times greater than those in very good health (Table 6). While the odds for those living in poor health are now twenty times greater, and over six times greater for those who report their health is fair. With health status and all other variables controlled for in the model, there was no significant difference on this measure of SWB between those who report a disability and those who do not. Again, this suggests that many of the issues and disadvantages experienced by people with a disability are located within the social and economic circumstances of everyday life (Roulstone and Prideaux, Reference Roulstone and Prideaux2012). Living alone is consistently significant, as a person with a disability who lives alone displays nearly twice the odds of leading an ‘unfulfilled life’ compared with a disabled person who does not live alone (Table 7); as might be expected, good health is also highly significant.
Household composition makes an independent contribution to feeling ‘fulfilled’ about life. Couples display odds of reporting that their life is ‘worthwhile’ which are three times greater than those of single people living alone. Housing tenure, however, was not a good predictor on this measure of SWB. Age, ethnicity, education, income and social class appeared to play little or no significant role in shaping ‘fulfilment’, after controlling for other factors. The study findings also suggest no significant regional variation here. In other words, geographical region currently plays no major role in shaping the extent to which people feel their lives are ‘fulfilled’ and ‘worthwhile’.
‘Anxious lives’
Although women lead more meaningful lives, they also report significantly more general ‘anxiety’ compared to British men (column (iv)). Age and ethnicity are not especially important on this particular dimension of SWB. In the multivariate analysis, people with BME backgrounds experience the same or similar levels of ‘stress’ as people in the ‘White’ British population. There is the now familiar gradient with health status, but the observed differences here are not as pronounced as we found using the other measures of SWB. For instance, the odds of people in poor health being ‘stressed’ are three times those of people in very good health. This difference is highly significant, but the order of magnitude on the measures of ‘life satisfaction’ and ‘worthwhile’ life was far greater.
Household composition was not important here. Income, socio-economic position and labour force status do not appear to impact on ‘anxiety’ after controlling for other factors; neither does disability. The latter finding is very much in keeping with the other results for SWB in Table 6. Income and disability were significant predictors of ‘anxiety’ in the bivariate analysis, but the effects of income and disability continue to be moderated by the other socio-demographic variables – including health status – in the multivariate model. Again, we find strong interaction effects between income and self-rated health, along with disability and self-rated health (Table 7). These findings are explored below. People with lower levels of education tend to be more ‘stressed’ compared to those with higher education. The study findings also suggest that people living in Yorkshire and in the East of England are significantly less ‘anxious’ when all other factors in the model are controlled for.
Interactions
The results suggest that there is some correlation between some of the variables in the multivariate analysis. The effects of disability, for example, are significantly diluted or covered by the inclusion of other variables in the multivariate model shown in Table 6, particularly the more global assessment of health status; this is a powerful predictor of SWB across all four dimensions (columns (i)–(iv)). In the interaction models (Table 7), we observe strong interaction effects between states of health and disability, showing the impact of declining health on SWB. The results for ‘life satisfaction’ and ‘fulfilment’ are particularly pronounced. The odds of feeling ‘dissatisfied’ amongst adults with a disability who are in very poor health, for example, are now about thirty times those of a disabled adult in very good health. The interaction effects between disability and health illustrate the importance of good health for positive wellbeing. We also observe strong interaction effects between disability and household composition (Table 7). An adult with a disability living alone is significantly more likely to report low levels of SWB compared to an adult with a disability living with another person as a couple.
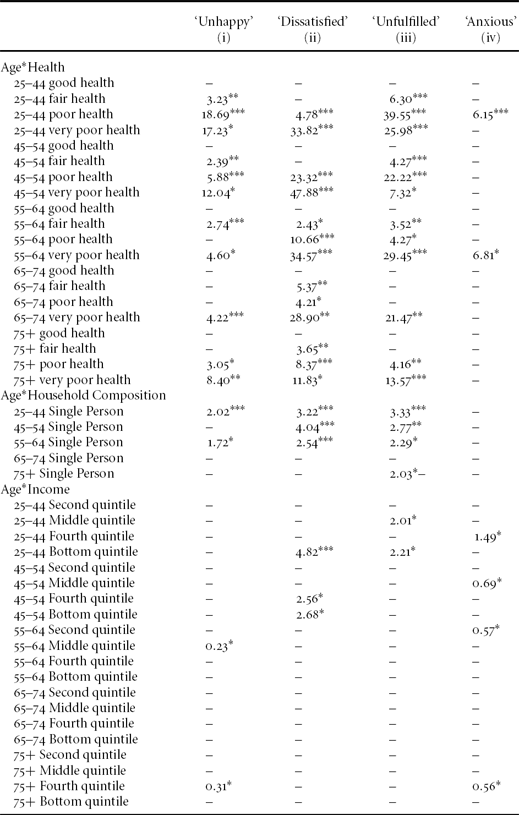
In Table 7, we find strong effects between income and self-rated health. As health declines, the odds of reporting low SWB increase substantially regardless of income; however, the effects are much more dramatic at the lower end of the income distribution (from the lower middle-income quintile to the bottom quintile). In addition, the evidence suggests that income makes more of a difference to general wellbeing during the earlier stages of adult life (twenty-five to forty-four), and in middle age (forty-five–to fifty-four) on the ‘satisfaction’ measure of SWB. Income appears to play a less significant role in shaping wellbeing in later life (seventy-five-plus), particularly for the measures of ‘happiness’ and ‘stress’ free living. However, the picture in Table 8 appears rather patchy. Younger adults living alone are more likely to report significantly low levels of SWB compared to older adults living alone. We also observe significant interactions between age and health as might be expected; adults aged twenty-five to fifty-four in poor health (including the very poor health category) tend to be significantly more ‘unhappy’ than older adults (fifty-five plus). Similarly, levels of ‘dissatisfaction’ and ‘unfulfillment’ also tail off with age.
TABLE 8. The relative odds of wellbeing (significant interactions in the main effects model)

Significance levels: *<0.05; **<0.01; ***<0.001.
There are also important interactions between ethnicity and other variables in the multivariable model. The odds of unemployed people in BME groups reporting being ‘unhappy’ are nearly four times greater than those of the majority ‘White’ British population, and their odds of reporting ‘dissatisfaction’ are nearly five times greater than this group (Table 7). Unemployed adults reporting poor health have significantly lower levels of SWB compared to adults with poor health who are in work. Employment does appear to confer some benefits on those who are able to work, even if their health is not good (Table 7). Unemployed disabled adults are more ‘anxious’ than disabled adults who are in work. Occupational ‘social class’ was associated with other powerful predictors of ‘happiness’, such as health and educational attainment. Manual workers in poor health (including the very poor health category) are shown to have the lowest levels of wellbeing, alongside manual workers without any formal qualifications. Household composition also matters; people living alone in rented accommodation or social housing face twice the odds of being ‘unhappy’, ‘dissatisfied’ and feeling ‘unfulfilled’ compared to single people who are home-owners (Table 7).
Discussion
It is now widely accepted that the measurement of SWB is central to the development of social policy. Measures that capture personal experience, moods, psychological functioning and people's cognitive assessments about how their life is going overall – when aggregated at the national population level – elucidate an important component of the wellbeing concept that can be applied to social policy (Graham, Reference Graham2011). The emerging survey data on SWB in the UK, however, is currently underdeveloped for social policy purposes. In this article, we have considered the application of the survey data for understanding the social determinants of SWB, and here we reflect on how the new insights may be used to inform the development of social policy. A number of findings are particularly striking, and deserve comment given the direction of current policy in the UK.
Work is increasingly recognised as the best form of welfare in twenty-first century capitalist society (DWP, 2010), not only because work usually pays better than welfare, but because work helps to promote wellbeing, as we observe here: the odds of ‘dissatisfaction’ amongst adults not in work are nearly three times greater than those in work, according to the survey data. To this end, the UK's new ‘welfare-to-work’ policies, including the ‘Work Programme’ and the new means-tested benefit ‘Universal Credit’ seek to ensure ‘welfare that works’; a life in work rather than a life on benefits (Welfare Reform Act, 2012).Footnote 5 Consequently, labour market conditionality now applies to most sections of the adult working age population and the principles at stake here appear to be attracting support amongst the British public (Park et al., Reference Park, Clery, Curtice, Phillips and Utting2011). In many ways – and from the perspective of SWB – the policy aim is laudable; there are obvious benefits and gains if more out of work adults are able to find decent, meaningful jobs. However, there are growing concerns over the level of state regulation in the name of labour market ‘activation’. There may be policy limits to ‘activation’, including some of the present structural concerns over the lack of employment opportunities on offer, as well as the high cost of childcare faced by many working parents. The limits of these policies are now being tested by some of the most vulnerable sections of British society, who maintain that their needs are not being respected under the new regulatory regime. For instance, two-thirds of lone parents now targeted by ‘activation’ policy, claim that taking a paid job is not appropriate in their circumstances (Rafferty and Wiggan, Reference Rafferty and Wiggan2011). Instead, they express a strong preference for caring for their own children themselves. Likewise, the government policy to encourage and assist disabled people off benefits and in to paid work is surrounded with controversy for ignoring the needs of disabled people, and societal barriers to their full and equal labour market participation (McCartney, Reference McCartney2012; Patrick, Reference Patrick2012). Paid work will not be appropriate in every circumstance and not all adults will benefit from being ‘activated’. In this inquiry, employment status had little effect on life ‘satisfaction’ for disabled adults, in stark contrast with the findings for the general British population. Many older adults in retirement report relatively high levels of SWB; empirical research continues to show most lead socially active and productive lives. The UK's ‘active ageing’ strategy, therefore, needs to support local ‘big society’ initiatives, and thus extend beyond the rather narrow focus on employment opportunities (Deeming, Reference Deeming2009).
Whether increasing income raises the experience of wellbeing is a matter of major debate (Diener et al., Reference Diener, Kahneman, Arora, Harter, Tov and Diener2009b). In this study, we found little evidence to suggest that income makes an independent contribution to SWB across our four dimensions. However, we should recognise the need for more sophisticated modelling techniques that include both individual and societal factors to probe this complex relationship (Deeming and Hayes, Reference Deeming and Hayes2012). It is noticeable, and also worrying, that there has been a distinct shift in policy away from faith in income and material recourses to solve some of the complex and deep-rooted social problems we see in the UK (e.g., Field, Reference Field2010); and while we wait for research to uncover more ‘truths’, we should not lose sight of the powerful effect that income and wealth has on important social outcomes (Hills et al., Reference Hills, Brewer, Jenkins, Lister, Lupton, Machin, Mills, Modood, Rees and Riddell2010; Rowlingson, Reference Rowlingson2011).
Although we find women in Britain are more likely to lead ‘fulfilled’ lives than men, a finding that is very much in tune with some of the emerging international evidence (OECD, 2012), it is also very apparent that women are more ‘anxious’ about and ‘stressed’ with daily life. This is as a result of combining employment and family care, as Lewis (Reference Lewis2009) argues. Future prospects are not good either with greater labour market regulation enforcing this duality. Many working mothers dislike or reject the new ‘one-size-fits-all’ regulatory framework being imposed upon them by ‘welfare-to-work’. Ensuring that families, especially single parent families, are able to both support themselves and to care for their dependants without material disadvantage continues to be a major challenge for social policy in the UK. The issues raised here are symptomatic of more general shifts in the balance of work and family life, with ever greater family diversity and changes in the labour market. Ageing populations and changing family structures present new challenges. Policymakers have been slow to respond to the ‘new social risks’ of modern societies in the twenty-first century as Taylor-Gooby (Reference Taylor-Gooby2004) argues. Generally speaking, living alone is not good for wellbeing as the study findings and a growing body of research evidence indicate (Stack and Eshleman, Reference Stack and Eshleman1998). Solo living often results in isolation from the privileges and obligations of cohabited (including married) life. The ties of cohabitation help to establish a basic sense of belonging and security; SWB is clearly affected where such ties are lacking. Perhaps a growing area of concern for the policy of wellbeing is the growing numbers who live alone in Britain: a trend which shows little sign of abating (Chandler et al., Reference Chandler, Williams, Maconachie, Collett and Dodgeon2004). Although the ageing population has contributed to this demographic, solo living is a growing trend across all age groups in the adult population. ‘Individualisation’ means people are inextricably linked to the institutions of the labour market and welfare state, while traditional forms of family and community life lose more and more of their meaning. The new institutions and social structures increasingly regulate life, with demands and entitlements that are not wholly addressing the needs of individuals, and nor are they addressing the needs of family variety in the twenty-first century. Policymakers face pressing issues over intergenerational equity, as the study findings indicate wellbeing is not evenly distributed between the generations (Willetts, Reference Willetts2010).
Structural components of ethnic disadvantage persist, despite various employment initiatives and legislation (Virk, Reference Virk, Karlsen, Becares and Roth2012). The results suggest that SWB among unemployed people in BME groups are a particular concern. The interplay of factors at stake here is likely to be complex as Berthoud (Reference Berthoud2000) suggests, but will include known factors such as overt and ‘hidden’ discrimination, expectations, stereotypes, alienation, family and economic structures. Education helps to promote wellbeing, and is well-recognised as a cultivating force within society (Nussbaum, Reference Nussbaum1997). However, the recent reforms to higher education in England are, according to some critics such as Barr (Reference Barr2012), a retrograde step that is likely to undermine the quality of education and the goal of widening participation. Students from poorer backgrounds already experience a range of structural disadvantages in the higher-education system, relating to economic, social, and cultural capital (Lehmann, Reference Lehmann2009). Expensive loans are likely to further impede access and weaken participation, stifling the prospects of social mobility and increased wellbeing for young people from poorer working-class backgrounds.
We find that people living in poor health – which often means coping with a longstanding illness – are amongst the most vulnerable members of British society, reporting the lowest levels of wellbeing.Footnote 6 There are clear links between age and health in the data as expected, but poor health also interacts with other forms of social and material circumstance, such as unemployment, low income, low ‘social class’ and self-rated disability (Clark and Oswald, Reference Clark and Oswald1994). Clearly, social policy has to address this great complexity and diversity. The Coalition government's response is increased personalisation and choice. New strategies demand that individuals take greater responsibility for their own agency and ‘wellness’. Power and responsibility is being devolved to the local level; ‘wellness services’ in each locality are to be held accountable for the wellbeing of their local populations (Health and Social Care Act, 2012).Footnote 7 The danger of this fiercely consumerist and individualist self-directed approach to policy is the increasing fragmentation and marketisation of the social and human services; particularly evident in the new public health paradigm (Bambra et al., Reference Bambra, Smith, Garthwaite, Joyce and Hunter2011), social care policy (Glendinning, Reference Glendinning2012) and housing policy (Lund, Reference Lund2011). Better government regulation of the private rental sector is urgently required to promote health and wellbeing, although this is not a priority for the Coalition government. Nearly 40 per cent of privately rented homes fail the government's Decent Homes Standard, and people in this sector express high levels of ‘dissatisfaction’ with their accommodation (DCLG, 2012).Footnote 8 Moreover, many vulnerable families in Britain are being funnelled into the bottom end of this market, resulting from the caps on housing benefit imposed by the new system of Universal Credit (Harding, Reference Harding2011). The policy turn to individual consumerism and the market, with the desire to devolve responsibility from Whitehall, and arguably shift blame, threatens the very foundations of human health and wellbeing in the UK at a time when the influence of the wider social context is being ignored. There is an urgent need to emphasise the social, given the direction of current policy in Britain.
Conclusions
Research into wellbeing, both the subjective (SWB) components and the substantive (i.e., holistically understood) aspects of human flourishing belong to the core business of social policy (Dean, Reference Dean2012). Here we have focused on SWB and the emerging MNW programme that offers much potential for the development of social policy, informed by the rigorous analysis of survey data within the social scientific tradition (Byrne, Reference Byrne2011). There are, of course, a number of cautions and limitations attached to the study findings. Correlations in this field should not be treated as evidence of one-way causation from factors to ‘happiness’, as Thin (Reference Thin2012) argues. The cross-sectional survey data used here is limited when it comes to studying changes in SWB over time and/or across the lifecourse. Longitudinal studies, cohorts or panel surveys are required for modelling and interpreting cross-temporal comparisons that shed light on whether the same population has become happier (Davies, Reference Davies, Dale and Davies1994). Researchers may wish to consider a radically different approach to the interpretation of this survey data using a set-theoretic method for example. Finally, and more conceptually, we are a long way off from a world in which emotional fulfilment replaces ideas about maximising economic growth, and although social policy is making progress, there would be grave dangers in any single-minded pursuit of this (Burchardt, Reference Burchardt, Bauld, Clarke and Maltby2006). The value of social policy is that it recognises the plurality of human ends and needs (not just ideas relating to ‘happiness’ or SWB), and as such it invokes our social values and principles for thinking about resources, material circumstances, and their distributions.
In terms of future work, there is a more general need to examine more closely the relationship between SWB and mental health issues (Beaumont and Thomas, Reference Beaumont and Thomas2012). Further work should also consider disparities in SWB within and between minority ethnic groups within society (Burton et al., Reference Burton, Nandi and Platt2010; Platt, Reference Platt2011). Finally, the four overall SWB monitoring questions now included in ONS social surveys are designed to collect different types of information from respondents about their own wellbeing; ONS argue that the four SWB constructs and measures can and do stand alone, and while there is a literature to support this thinking, future work might also test some of these assumptions since these measures and constructs are now widely used internationally.
Acknowledgements
I am grateful to the referees and to the Editors for helpful comments on an earlier version of this paper. The study was supported by ESRC grant ES/K001353/1 ‘New Cultural Contradictions in Society’. The ONS material used in this study is Crown Copyright and has been used with relevant permissions. The study is registered with the UK Data Archive (datasets for usage: 63168, study number: 6893).
Appendix: ONS Opinions Survey
This survey is carried out by ONS to allow reliable information on topics of immediate policy interest. Recent topics have included Charitable Giving, Attitudes to Ageing, Migration, Public Perceptions of Tax and Well-being. It uses a random probability sample stratified by: region, the proportion of households with no car, the proportion in the National Statistics socio-economic categories one to three and the proportion of people aged over sixty-five years. In common with other ONS social surveys, it uses the Royal Mail's small-user postcode address file to draw the sample from across Great Britain. Participation is purely voluntary and interviewers only call at addresses where no refusal has been made to the advance letter. The interviewer will make up to twenty calls to an address at different times in the day and the week to try to make contact, after which the address is marked as a non-contact. The interviewer uses a Kish grid to randomly select one of the adults (aged sixteen and over) living within the household for interview. All interviews are carried out face-to-face (except for a very small number of telephone reissues) by ONS interviewers trained to carry out National Statistics surveys. The final achieved sample is around 1,100 adults (aged sixteen and over) per month with an approximate overall survey response rate of around 60 per cent. The data presented in this article are taken from the April, June, July and August 2011 Opinions Survey and provide a combined sample size of around 4,200 adults in Great Britain aged sixteen and over. All calculations and estimates in this study are weighted. By weighting the estimates, we ensure that they are more representative of the population but with the assumption that those people who did not respond to the survey would provide on average the same ratings of subjective wellbeing as those that do. There are two weights in the Opinions Survey: first, a weight that adjusts for the differences in the probability of an individual being selected due to different household sizes and sample design and, second, a weight that calibrates the sample so that it is representative of the overall population levels in Great Britain by age, sex and region.


