


Introduction
Morphometrics and systematic biology share a common interest in the analysis of morphology and the nature of morphological variation (MacLeod, Reference MacLeod2002), although both fields have a history of complex dialogue, which derives, at least partially, from the underlying differences in their theoretical bases (Rae, Reference Rae2002; Jensen, Reference Jensen2003; Clouse et al., Reference Clouse, De Bivort and Giribet2011). The use of ratios (i.e., quotients between morphometric measurements) has become thoroughly ingrained into scientific methodology (Atchley et al., Reference Atchley, Gaskins and Anderson1976), in part given their capability to present, in concise and easily interpretable ways, quantities that are otherwise non-comparable (Leirmann et al., Reference Leirmann, Steel, Rosing and Guttorp2004). Consequently, their use is extensive throughout taxonomic and systematic literature (Reyment et al., Reference Reyment, Blacklith and Campbell1984; Winston, Reference Winston1999; Schuh, Reference Schuh2000). Among these fields, the purpose behind the use of ratios is either to control the body size component in the observed variation of an anatomical feature (Atchley et al., Reference Atchley, Gaskins and Anderson1976) or to represent shapes or proportions (Baur and Leuenberger, Reference Baur and Leuenberger2011) that are useful to identify and describe living organisms. Morphometrics can be an important tool in systematic studies given that it incorporates strong elements of quantification and formal hypothesis testing (MacLeod, Reference MacLeod2002), and linear morphometrics have proven to be valuable tools for the resolution of taxonomic problems (e.g., Hughes, Reference Hughes1994; Żylińska et al., Reference Żylińska, Kin and Nowicki2013). On the other hand, the use of ratios as cladistic characters has raised an intense debate. Most of the criticisms are related to several undesirable statistical properties that violate the fundamental principle of character independence of cladistics studies. Furthermore, Mongiardino Koch et al. (Reference Mongiardino Koch, Soto and Ramírez2015) stated out that the often-arbitrary choice between which measurement is used as numerator and which as denominator affects the phylogenetic outcome of the analysis, so the use of log-transformed ratios would be a suitable solution. Nonetheless, many authors continue to use ratios as continuous characters without any sort of modification. In addition, they have proven to be useful in fossil taxa, in which the morphological variation is the only source of information (e.g., Prevosti, Reference Prevosti2010; Escapa and Catalano, Reference Escapa and Catalano2013; Mannion et al., Reference Mannion, Upchurch, Barnes and Mateus2013; Monti and Confalonieri, Reference Monti and Confalonieri2014).
Parabolinella triarthroides Harrington, Reference Harrington1938 (p. 194, pl. 7, figs. 10, 11) was first described based on two cranidia from the Quebrada Coquena, Purmamarca, Jujuy Province. In its original description, Harrington (Reference Harrington1938) mentioned a simple preoccipital furrow (S1) in the type specimens of P. thriarthroides, which is the only character that distinguishes this species from the rest of the species of Parabolinella Brogger, 1882 (Harrington and Leanza, Reference Harrington and Leanza1957). The generic assignment of P. triarthroides has been questioned by a phylogenetic analysis, which resolved this species as the sister group of Bienvillia Clark, Reference Clark1924 and recovered a bifurcate preoccipital furrow as the only nonhomoplasic synapomorphy of the genus Parabolinella (excluded P.? triarthroides) (Monti and Confalonieri, Reference Monti and Confalonieri2013).
The aim of this study is to solve the generic assignment of this species, performing a revision of the type material and a morphometric analysis of P. triarthroides, Parabolinella, and Bienvillia specimens. The original matrix used in a previous phylogenetic analysis (Monti and Confalonieri, Reference Monti and Confalonieri2013) was reviewed in light of the revision of the type material and was enlarged to include more species of Bienvillia. Continuous characters were coded in different ways in order to compare how they could affect the results. Because the variables used in the morphometric analysis were also treated as characters in the phylogenetic analysis, both results were compared and the behavior of these variables was analyzed. This study points to the importance of combining different methodological approaches with exhaustive qualitative analyses, which are necessary to recognize morphological traits and to solve systematic problems.
Materials and methods
Materials
Studied specimens correspond to previously collected material from Ordovician outcrops in the Cordillera Oriental Argentina, at Purmamarca region and Quebrada Moya, Jujuy Province (Monti et al., Reference Monti, Benítez and Ramírez2016). Also more than 250 specimens from the “Harrington and Leanza Collection” (Harrington and Leanza, Reference Harrington and Leanza1957) were reviewed (Supplementary dataset 1). These samples consist of specimens from Cambro-Ordovician units exposed at different localities in the Cordillera Oriental: quebradas Huasamayo, Rupasca, and San Gregorio (Alfarcito area); Bocoyá River and Nazareno River (Iruya Region); Quebrada Colorada de Fundición and Santa Victoria River (Santa Victoria region); Negrito River (tributary of Santa Cruz River), La Caldera region; Reyes River, Cumbre de Castillejo region; Quebrada de Coquena (Purmamarca region); and Quebrada del Barranco (Pascha area).
We measured 136 specimens (ingroup) and 6 (outgroup) to construct the input matrix for the phylogenetic analysis (Supplementary dataset 1). From these, 90 more-complete specimens were included in the morphometric analysis, given that the method does not allow the existence of missing entries (Supplementary dataset 1, 2). The sample for the morphometric analysis includes 28 specimens of Bienvillia: B. parchaensis (Harrington and Leanza, Reference Harrington and Leanza1957) (5); B. rectifrons (Harrington, Reference Harrington1938) (7); B. tetragonalis (Harrington, Reference Harrington1938) (9), B. jana Waisfeld and Vaccari, Reference Waisfeld and Vaccari2006 (5); and B. kichka Waisfeld and Vaccari, Reference Waisfeld and Vaccari2006 (2). The sample for morphometric analysis also includes 57 specimens of Parabolinella: P. clarisae Monti, Benítez, and Ramírez, Reference Monti, Benítez and Ramírez2016 (28); P. pompadouris Monti, Benítez, and Ramírez, Reference Monti, Benítez and Ramírez2016 (8); P. argentinensis Kobayashi, Reference Kobayashi1935 (13); P. coelatifrons Harrington and Leanza, Reference Harrington and Leanza1957 (6); and P. limitis Brøgger, Reference Brøgger1882 (2) (Supplementary dataset 2). In this analysis, the types of P. triarthroides described by Harrington (Reference Harrington1938) (CPBA 5, type and CPBA 54, paratype) and other specimens of this species from the type locality (CPBA 9; Waisfeld and Vaccari, Reference Waisfeld and Vaccari2003, pl. 32, figs. 15, 16) were also included. Nine additional species of Parabolinella, whose characters were analyzed and coded on the basis of published descriptions and figures (see Monti and Confalonieri, Reference Monti and Confalonieri2013) also were added: P. jianganensis Lu and Lin, Reference Lu and Lin1984; P. ocellata Lu and Lin, Reference Lu and Lin1984; P. prolata Robison and Pantoja-Alor, Reference Robison and Pantoja-Alor1968; P. tumifrons Robison and Pantoja-Alor, Reference Robison and Pantoja-Alor1968; P. variabilis Robison and Pantoja-Alor, Reference Robison and Pantoja-Alor1968; P. bolbifrons Fortey and Owens, Reference Fortey and Owens1997; P. lata Henningsmoen, Reference Henningsmoen1957; P. triarthra (Callaway, Reference Callaway1877) Parabolinella new sp., and P. limitis) were incorporated in the cladistic analysis. All the specimens included in the analyses are holaspids and they are preserved as imprints and molds (internal and external). Most of them have suffered minor tectonic distortion. Disarticulated elements of the trilobite exoskeleton prevail, dominated by cranidia.
Morphometric analysis
Eleven measurements from the above-mentioned 90 specimens corresponding to P.? triarthroides and different species of Parabolinella and Bienvillia were taken for the analyses (Table 1, Fig. 1, Supplementary dataset 2). With the aim of ordering the specimens according to the morphometric variability observed, three different Principal Component Analyses (PCA) were performed from the variance-covariance matrix: (1) using the set of logarithm transformed raw data, (2) using the logarithm of the raw data corrected by the geometric mean (hereafter called GMD) (Mosimann size variables) (see Mosimann and James, Reference Mosimann and James1979; Meachen-Samuels and Van Valkenburgh, Reference Meachen-Samuels and Van Valkenburgh2009), and (3) using the logarithm of nine new variables generated from the relationship of the original ones (hereafter called RD) (Table 1). It is important to note that all of the preceding analyses were also carried out with the correlation matrices (instead of variance-covariance matrices) of the untransformed data, although they are not shown in detail because outcomes regarding the separation of both genera and the variables of importance to distinguish them were very similar to those obtained with the variance-covariance matrices of the log-transformed data (see Supplementary datasets 3, 4). The analyses were performed with the software R version 3.2.2 (R Development Core Team, 2015) using the package vegan 2.3-1 (Oksanen et al., Reference Oksanen, Blanchet, Kindt, Legendre, Minchin, O’Hara, Simpson, Solymos, Henry, Stevens and Wagner2015). For GMD and RD analyses, confidence intervals of the eigenvectors of each variable were estimated by one thousand replicates of bootstrap PCA with R package bootSVD version 0.5 (Fisher, Reference Fisher2015). To compare the effectiveness of both GMD and RD transformations in reducing size effects, the first axis of the PCA was correlated with two variables that estimate size (Log of the Length of the Cephalon [LC] and Log of the Geometric Mean [GM]). Finally, a Discriminant Analysis was conducted for the two genera, excluding the types of P.? triarthroides. In order to classify the type specimens of P.? triarthroides, the values of the discriminant function for these specimens were calculated with the Microsoft Excel spreadsheet using canonical coefficients. These last two analyses were carried out with Infostat version 2015 (Di Rienzo et al., Reference Di Rienzo, Casanoves, Balzarini, Gonzalez, Tablada and Robledo2015).
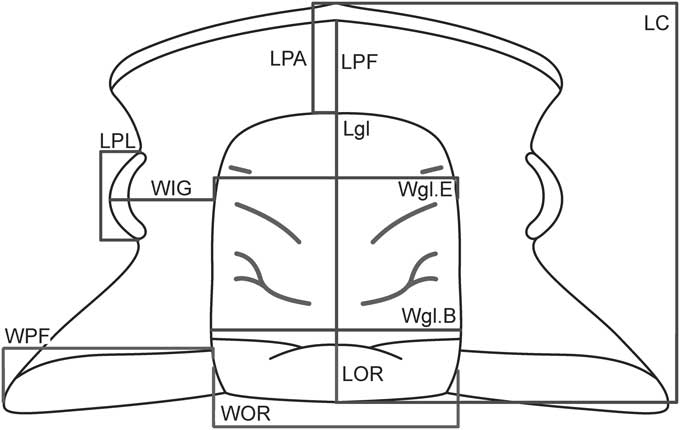
Figure 1 Schematic representation of the cranidium of Parabolinella sp. showing the measurements used in the morphometric analyses. Abbreviations: LOR, Length of the Occipital Ring (sag.); LC, Length of the Cranidium (sag.); Lgl, Length of the glabella (sag.); LPL, Length of the Palpebral Lobes (exasag.); WOR, Width of the Occipital Ring (tr.); Wgl.B, Width of the glabella (at the Base) (tr.); WPF, Width of the Posterior Fixigenae (tr.); WIG, Width of the Interocular Genae (tr.); Wgl.E, Width of the glabella (at the Eye line) (tr.); LPA, Length of the Preglabellar Area (sag.); LPF, Length of the Preglabellar Field (sag.).
Table 1 Description of the variables used in each morphometric analysis.

Cladistic analysis
The matrix used in the phylogenetic analysis of the genus Parabolinella (Monti and Confalonieri, Reference Monti and Confalonieri2013) was reviewed, especially the characters coded for P.? triarthroides. Two new taxa belonging to the genus Bienvillia (B. kicka and B. jana) were added. The matrix has 40 characters, of which fifteen are continuous and the rest are discrete. In the original matrix (Monti and Confalonieri, Reference Monti and Confalonieri2013), the continuous characters were coded as discrete (12 were expressed as ratios and three as meristic), but in the present study they were coded as continuous, as implemented in TNT (Goloboff et al., Reference Goloboff, Mattoni and Quinteros2006). Two strategies were used for coding these continuous characters (Table 2, Supplementary dataset 5): the first one considers their original definition and characters are coded as ratios (hereafter called CPR); the second one considers the use of the raw data corrected for size by the geometric mean (hereafter CPGM) (Mosimann size variables) (see Mosimann and James, Reference Mosimann and James1979; Meachen-Samuels and Van Valkenburgh, Reference Meachen-Samuels and Van Valkenburgh2009). In both strategies the median was used as the statistical descriptor because it has the advantage of being less affected by extreme values of frequency distribution. Also, to solve the scaling problem, the continuous characters were standardized to range 0–1, so the maximum internal steps are equivalent to one step of a discretely coded character (i.e., a change between the two most dissimilar states in each continuous character has the same cost as one step in a discrete character). Because the arbitrary election of the numerator and denominator of the ratio character may affect the results obtained, the ratio variables were transformed with logarithm to minimize this effect (Mongiardino Koch et al., Reference Mongiardino Koch, Soto and Ramírez2015).
Table 2 List of characters used in the cladistic analysis indicating each partition and the character states (only for the qualitative partition). The characters also used as variables in the morphometric analysis are indicated on the right with the acronyms used in Table 1.

Continuous (CPR or CPGM) and discrete (DP) partitions were used combined and separated in the cladistic analyses (Table 2, Supplementary dataset 5). Heuristic searches were performed with TNT (Goloboff et al., Reference Goloboff, Farris and Nixon2008), using random addition sequences (RAS) followed by tree bisection–reconnection branch swapping (TBR). One thousand replicates were carried out, saving 25 trees per replicate. Maximum parsimony and implied weighting (concavity constants from k=3 to k=14) were used as optimality criteria. The trees obtained with the different types of coding were compared using unweighted SPR distances (Goloboff, Reference Goloboff2007) and the number of coincident internal nodes in the strict consensus tree. These values were taken to represent the degree of discordance between each continuous dataset and the discrete partition. Additionally, the mean value of these measurements was interpreted as the average topological difference resulted from choosing a different way to code the continuous characters.
Branch support was calculated by means of Bremer Support values (BS) (Bremer, Reference Bremer1994) through the search of suboptimal trees by TBR swapping. Also, jacknife resampling (Lanyon, Reference Lanyon1985) was calculated using TNT (see Goloboff et al., Reference Goloboff, Farris, Källersjö, Oxelman, Ramírez and Szumik2003). One thousand jacknife replicates were performed, conducting a heuristic tree search consisting of 10 replicates of Wagner trees (with random addition sequences) followed by TBR (saving 10 trees per replicate). A probability of alteration equal to 10% (equivalent to four characters in this database) was used. The differences in GC frequencies (for Group present/Contradicted) are also shown because they give better measures for groups with low support (Goloboff et al., Reference Goloboff, Farris, Källersjö, Oxelman, Ramírez and Szumik2003).
Because the list of synapomorphies depends on the optimal solution, when more than one most parsimonious tree was obtained, the common synapomorphies of all trees were considered on the strict consensus. Those quantitative characters that were important to distinguish both genera in the morphometric analysis were optimized on trees in order to analyze their phylogenetic signal, and to compare both kinds of analyses (i.e., morphometric vs. phylogenetic analyses).
Repository and institutional abbreviation
Studied specimens are deposited in the Invertebrate Paleontology Collection, Department of Geology (Paleontology area), Facultad de Ciencias Exactas y Naturales, Universidad de Buenos Aires, under repository abbreviations CPBA.
Systematic paleontology
Class Trilobita Walch, Reference Walch1771
Order Ptychopariida Swinnerton, Reference Swinnerton1915
Suborder Olenina Burmeister, Reference Burmeister1843
Family Olenidae Burmeister, Reference Burmeister1843
Subfamily Oleninae Burmeister, Reference Burmeister1843
Genus Parabolinella Brøgger, Reference Brøgger1882
Type species
Parabolinella limitis Brøgger, Reference Brøgger1882 (Bassler, Reference Bassler1915) from upper Tremadocian of Scandinavia.
Remarks
Parabolinella is a monophyletic group supported by one nonhomoplastic synapomorphy, the presence of an adaxially bifurcated S1 furrow; palpebral lobes centered to S2; anterior termination of the glabella rounded, S2 furrows shorter than S1, the preglabellar field occupies a larger proportion of the preglabellar area (sag.), a well-developed preglabellar field (sag.), and a short (sag.) glabella with a narrow base (tr.).
Parabolinella triarthroides Harrington, Reference Harrington1938
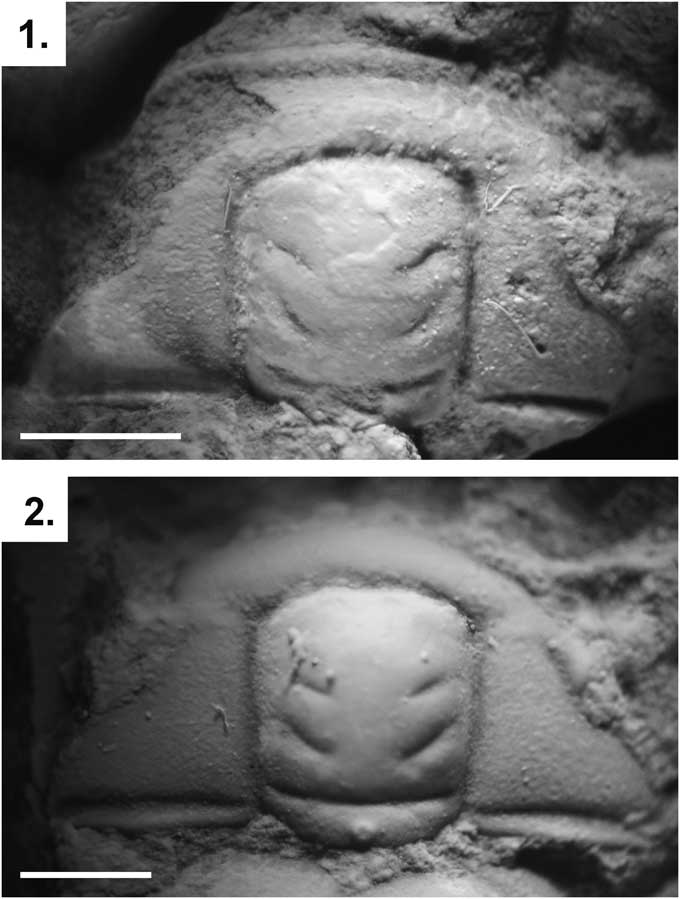
Figure 2 Parabolinella triarthroides (Harrington, Reference Harrington1938) from the Quebrada Coquena, Purmamarca, Jujuy: (1) dorsal view of the cranidium holotype (CPBA 5); (2) dorsal view of the cranidium paratype (CPBA 54). Scale bars represent 1 mm.
1938 Parabolinella triarthroides Reference HarringtonHarrington, p. 194, pl. 7, figs. 10,11.
1957 Parabolinella triarthroides; Reference Harrington and LeanzaHarrington and Leanza, p. 105, figs. 39.1a, 39.1b.
1988 Parabolinella triarthroides; Reference RushtonRushton, p. 686, fig. 3c.
2003Parabolinella triarthroides; Reference Waisfeld and VaccariWaisfeld and Vaccari, p. 330, pl. 32, figs. 14–18.
Holotype
Cranidium (CPBA 5, Fig. 2.1) from the late Tremadocian from the Quebrada Coquena, Purmamarca, Jujuy (Harrington, Reference Harrington1938, pl. 7, fig. 10).
Remarks
Harrington (Reference Harrington1938) mentioned a simple preoccipital furrow (S1) in the type specimens of P. thriarthroides. Later, based on that description, Harrington and Leanza (Reference Harrington and Leanza1957) proposed that this species was an intermediate form between the genera Parabolinella and Bienvillia. The generic assignment of P. triarthroides has been questioned by a phylogenetic analysis, which resolved this species as the sister group of Bienvillia Clark, Reference Clark1924. This analysis recovered a bifurcate preoccipital furrow as the only nonhomoplasic sinapomorphy of the Parabolinella genus (excluded P.? triarthroides) (Monti and Confalonieri, Reference Monti and Confalonieri2013). The holotype of P. triarthroides is poorly preserved and the nature (simple or bifurcate) of the preoccipital furrow (S1) cannot be determinate on this specimen (Fig. 2.1). Nevertheless, the paratype has a bifurcate preoccipital, which is suggested on its left side (Fig. 2.2). Moreover other specimens assigned to this species also have a conspicuous bifurcate preoccipital furrow (Waisfeld and Vaccari, Reference Waisfeld and Vaccari2003). Additionally, P. tirarthroides has a developed preglabellar area (sag.) and preglabellar field (sag.), a wide posterior fixigenae (tr.), a large glabella and cranidium, and a higher ratio between the width of the interocular genae and the width of glabella (at the eye line) (tr.). All these characters justify the inclusion this species in Parabolinella.
Results
Morphometric analysis
The first axis of the PCA performed with the log-transformed raw data accounts for 90.58% of the total variability. Because all the variables are negatively correlated with this axis, it explains the variation related to size (Fig. 3.1). Both genera are distributed evenly over the axis, meaning that the two groups do not show differences in size, although Bienvillia has a smaller range of size variation (Fig. 3.1). The PC2 explains 7.08% of the total variability. Both genera appear separated by this axis, Bienvillia is located in the positive values of this axis while Parabolinella, including the type specimens of P.? triarthroides, is in the negative values (Fig. 3.1). Although no variable significantly correlates with PC2, LPA and LPF are those that most contribute to this axis (Table 3). Because LPA and LPF have negative values of the eigenvectors, specimens of Parabolinella, which lie in the negative region of the PC2, have a more-developed preglabellar field and preglabellar area (Fig. 3.1). Finally the third axis, which explains 0.835% of the total variability, describes variation within each genus.
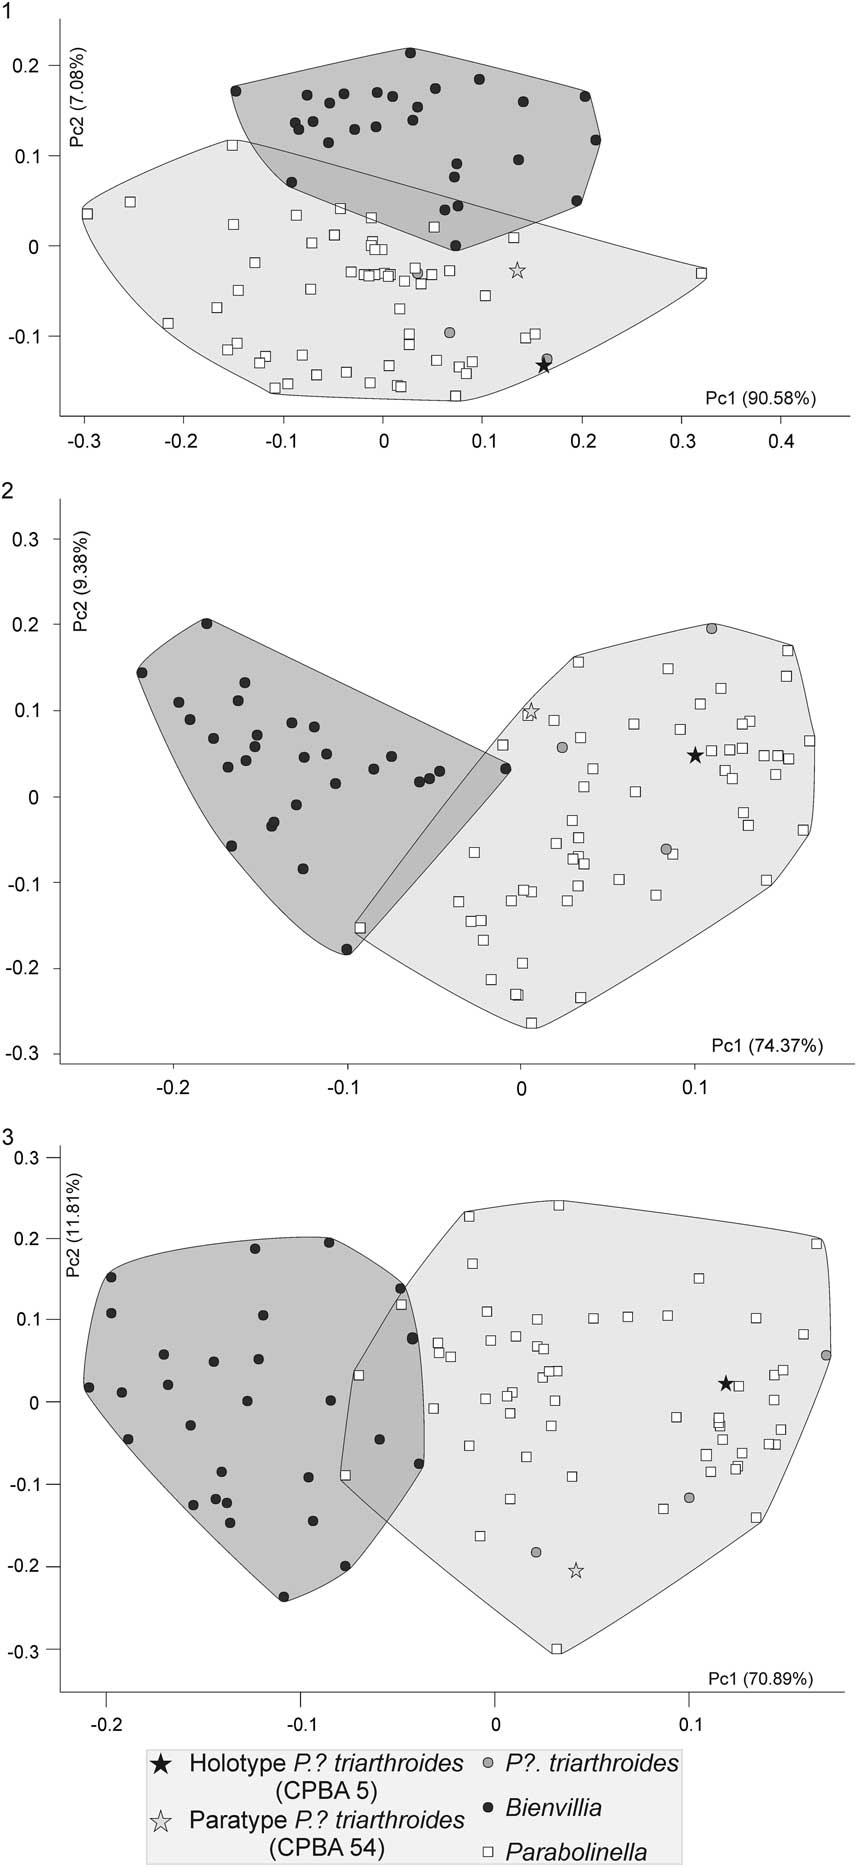
Figure 3 Scatter plot of the two first components of the PCAs: (1) analysis using log-transformed raw data; (2) analysis using log-transformed data corrected by the geometric mean (GMD); (3) analysis using log-transformed ratio variables (RD). Black circles: Bienvillia Clark; white squares: Parabolinella Brogger; black star: Holotype of P.? triarthroides (CPBA 5); gray star: P.? triarthroides (CPBA 54); gray circle: P.? triarthroides.
Table 3 Eigenvalues and correlation coefficients for each variable with the two first components of the PCA obtained with log-transformed data (Fig. 3.1). Abbreviations of variables according to Figure 1 and Table 1. Asterisks indicate significant correlation.

The PCA performed with GMD clearly differentiates both genera, and the type specimens of P.? triarthroides are located within the range of variation of Parabolinella (Fig. 3.2). The PC1 positively correlates with WPF, LPA, and LPF, and negatively correlates with the LOR, LC, Lgl, WOR, and Wgl.B (Table 4). The positive values of the first axis include specimens with a smaller glabella and occipital ring, wider posterior fixigenae (tr.), and a more developed preglabellar area and preglabellar field (sag.). The negative values of the first axis include specimens with a more-developed axis of the cephalon (bigger glabella and occipital ring), narrower posterior fixigenae (tr.), and shorter preglabellar area and preglabellar field (sag.). Both genera can be distinguished by the first axis, while they are evenly distributed over the second one (Fig. 3.2). Species of Parabolinella are located on the positive values of the first axis. This genus is characterized by a wider posterior fixigenae and more-developed preglabellar area and preglabellar field (Fig. 4.1). On the contrary, species of Bienvillia are located completely on the negative values of the first axis. This genus has a bigger axis of the cephalon (larger and wider glabella and occipital ring), narrower posterior fixigenae (tr.), and shorter preglabellar area (sag.) and preglabellar field (sag.) (Fig. 4.2). The specimens of P.? triarthroides are included within the range of variation of Parabolinella (Fig. 3.2). Therefore, P.? triarthroides and Parabolinella share a similar cranidium morphology.
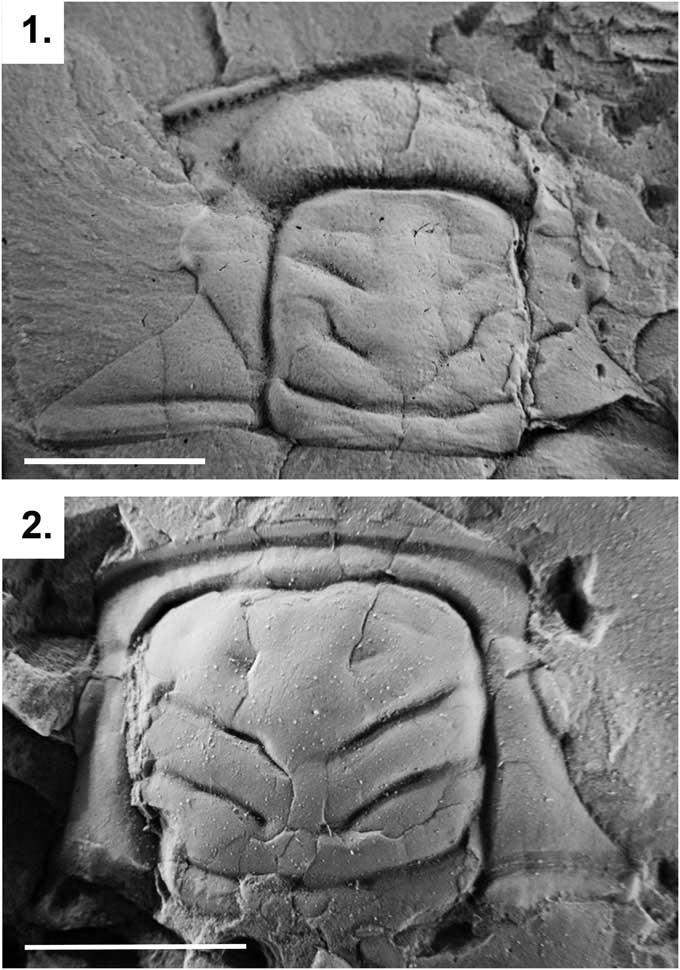
Figure 4 Cranidia of two specimens representing Parabolinella Brøgger, Reference Brøgger1882 and Bienvillia Clark, Reference Clark1924: (1) Parabolinella pompadouris Monti et al., Reference Monti, Benítez and Ramírez2016 from the Bocoyá River (CPBA 4036); (2) Bienvillia tetragonalis Harrington, Reference Harrington1938 from the Quebrada Rupasca (Holotype, CPBA 705). Scale bars represent 5 mm.
Table 4 Eigenvalues with confidence intervals at 95% and correlation coefficients for each variable with the two first components of the PCA obtained with the data corrected by the geometric mean (Fig. 3.2). Abbreviations of variables according to Figure 1 and Table 1. Asterisks indicate significant correlation.

When RD was used, similar results to GMD analysis were obtained. The specimens of Bienvillia are located on the negative values of the PC1, while those of the Parabolinella genus are mostly found on the positives values. Even if an overlapping zone can be recognized, the types of P.? triarthroides are located on the most-positive values of the PC1 (Fig. 3.3). Some differences on the variables that contribute to the PC1 axis are observed, compared to the GMD analysis. In addition, confidence intervals for the loadings of these variables were bigger than those obtained with GMD (Tables 4, 5). The PC1 positively correlates with LPF/LOR, LPF/LPA, WPF/WOR, and WIG/Wgl.E; and negatively correlates with Lgl/LC (Table 5). Specimens located on the positive side of this axis have higher values for these variables. Specimens assigned to Parabolinella are mostly located in the positive values of the PC1 (Fig. 3.3), therefore they are characterized by a more developed preglabellar field related to the length of the occipital ring (sag.), more developed preglabellar field related to the length of the preglabellar area (sag.), wider posterior fixigenae related to the width of the occipital ring (tr.), wider interocular genae related to the width of the glabella (at the eye line) (tr.), and shorter glabella related to the length of the cranidium (sag.) (Fig. 4.1). On the other hand, specimens of the genus Bienvillia have a poorly developed preglabellar field related to the lengths of the occipital ring (sag.) and preglabllar area (sag.), narrower posterior fixigenae related to the width of the occipital ring (tr.), narrower interocular genae related to the width of the glabella (at the eye line) (tr.), and larger glabella related to the length of the cranidium (sag.) (Figs. 3.3, 4.2).
Table 5 Eigenvalues with confidence intervals at 95% and correlation coefficients for each variable with the two first components of the PCA obtained with ratio variables (Fig. 3.3). Abbreviations of variables according to Figure 1 and Table 1. Asterisks indicate significant correlation.

Both methods are equally effective in reducing the size effect. They do not show any correlation between the PC1 and the variables that estimate size (Coefficient of Pearson correlation: PC1 [RD] vs. Log LC: 0.02 [p=0.822]; PC1 [RD] vs. Log GM: 0.09 [p=0.397]; PC1 [GMD] vs. Log LC: 0.06 [p=0.548]; PC1 [GMD] vs. Log GM: 0.13 [p=0.235]).
The discriminant analysis results were quite similar. In both cases the two groups show significant differences and the discriminant functions were equally efficient in classifying the specimens. The total error from the cross-classification table is 3.53% with both datasets (GMD and RD). To avoid redundancy, only the values of the discriminant function obtained with GMD are shown: centroid values are –3.08 and 1.51 for Bienvillia and Parabolinella, respectively, and the discriminant scores for the holotype and paratype of P.? triarthroides are 1.287 and –0.793, respectively, suggesting that they should be classified as Parabolinella.
Cladistic analysis
Revision of the type material of P.? triarthroides reveals that this species has a bifurcate preoccipital (S1). Thus the original matrix from Monti and Confalonieri (Reference Monti and Confalonieri2013) was accordingly modified for this qualitative character (Ch. 22, state 1 instead of 0 for P.? triarhroides, see Table 2 and Supplementary dataset 5). The analyses performed including all 40 characters (Table 2, Supplementary dataset 5) and with the two treatments of continuous characters (ratios vs. geometric mean) show similar results. In both cases, the species of Parabolinella constitute a monophyletic group, even with different conditions of analysis (without implied weighting and with different function of k), and P.? triarthroides is always recovered within this group. Among all the trees recovered with these different conditions, only those with highest similitude index (similarity=0.95; Supplementary dataset 6.1) are shown: the topology in Figure 5 (CPR + DP matrix), which was obtained applying either maximum parsimony or implied weighting (k=11–14), and the topology in Figure 6 (CPGM + DP matrix), which was obtained applying implied weighting (k=10–14). When the analysis was performed only with the continuous partition, Parabolinella was never recovered as a monophyletic clade (Fig. 7). When the CPR matrix was used, two very similar trees were recovered (similarity=0.9), independently of the conditions of analysis (i.e., without implied weighting and with different functions of k); and when the CPGM matrix was used, three slightly different topologies were obtained (similarity=0.6, 0.65, and 0.8). For comparison purposes, only the topologies obtained with k=11 are reported for each kind of partition (Fig. 7). The comparison of topologies through unweighted SPR distances obtained from CPR vs. CPGM matrices indicates that they are very different (similarity=0.3–0.55, Supplementary dataset 6.3). Furthermore, the consensus tree displays only from two to five shared internal nodes, out of a total of 20 (Supplementary dataset 6.5). The topologies obtained with the discrete partition are very different to those obtained with CPR and CPGM (the maximum of similarity is 0.35 for CPR, Supplementary dataset 6.5) (Fig. 7). The topologies obtained from CPR are slightly more consistent with the discrete partition than those obtained from CPGM (mean of similarity 0.2755 and 0.1196 for each strategy, respectively, see Supplementary dataset 6.5). Finally the tree obtained from the complete matrix, but using CPGM, shows slightly higher support values than including CPR (Figs. 5 and 6).
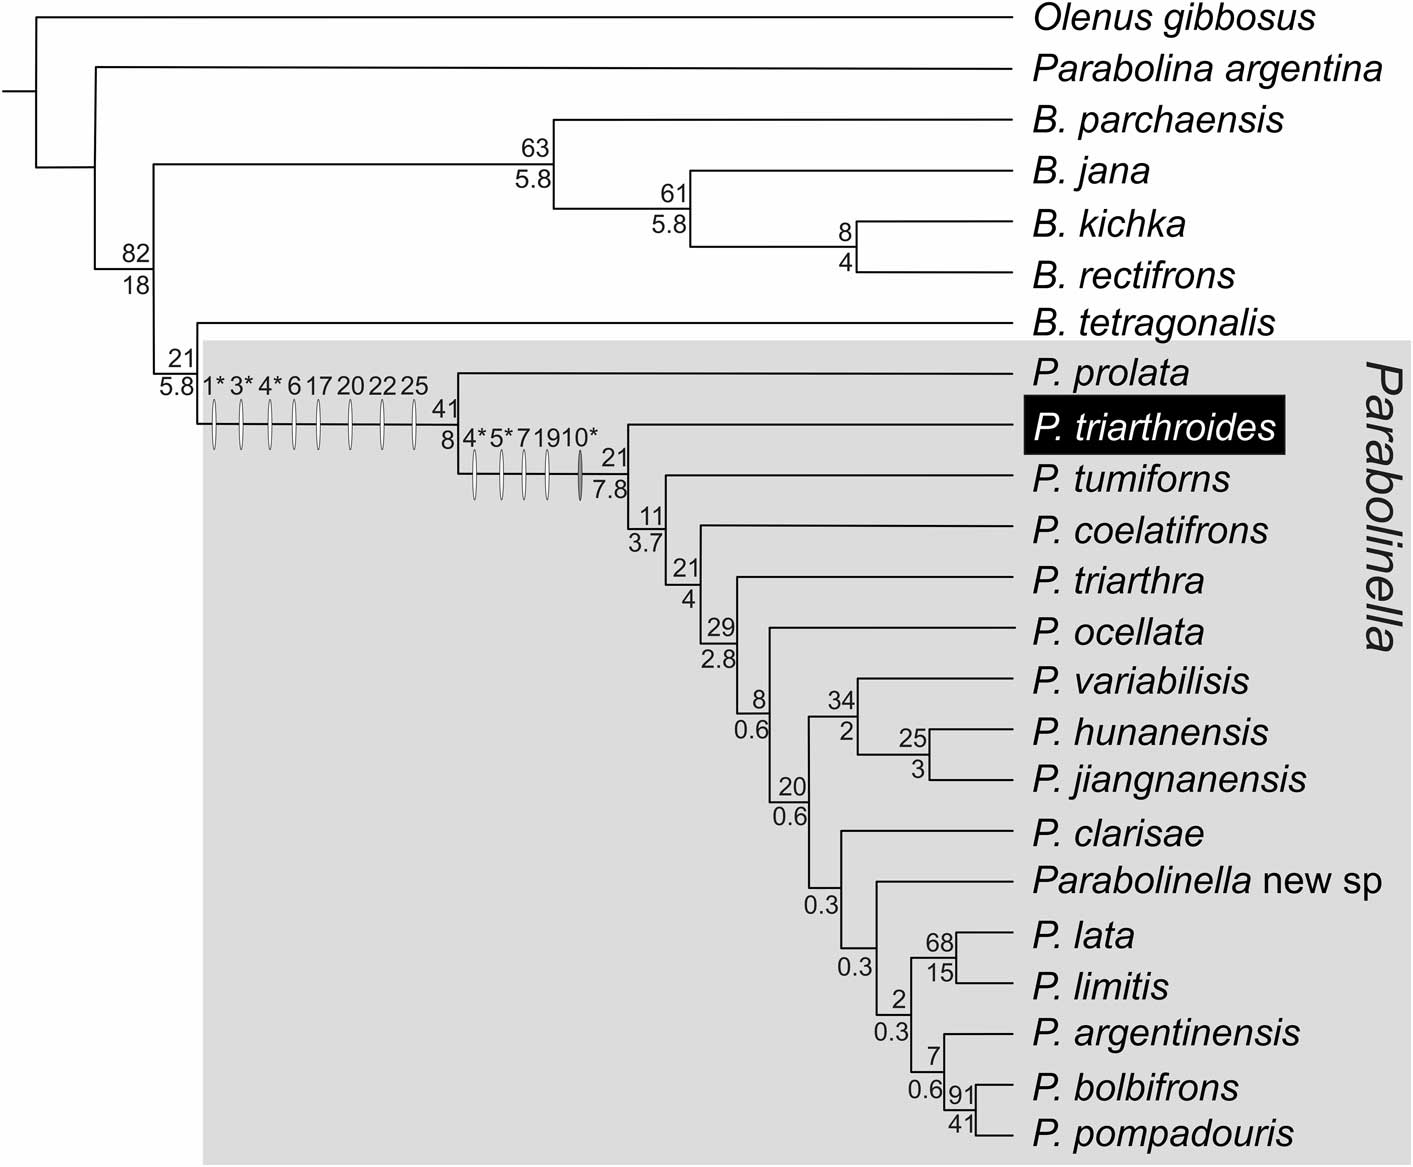
Figure 5 Topology obtained applying maximum parsimony and implied weighting (k=11–14) from the complete dataset with continuous partition code as ratios (DP + CPR); fit: 6.79 (for k=11); length: 146.276; CI: 0.346; RI: 0.526. Synapomorphies are indicated with white ovals over the branches and changes in the range of the continuous characters are represented with gray ovals. Numbers above the ovals are characters in Table 2. Asterisks indicate those characters that allow differentiation of the two genera in the morphometric analysis: Ch. 1: Lgl/LC, Ch. 3: LPF/LPA, Ch. 4: LPF/LOR; Ch. 5: WPF/WOR; Ch. 10: WIG/Wgl.E (acronyms as Table 1). Numbers above branches are the GC Jacknife values; numbers below branches are the Bremer Support in units of fit ×100. Synapomorphies of Parabolinella genus: Ch. 1, 0.68→0.63; Ch. 3, 0.69→0.72; Ch. 4, 0.58→0.94; Ch. 6, 0.58-0.59→0.54–0.57; Ch. 17, 0→1; Ch. 20, 0→1; Ch. 22, 0→1; Ch. 25, 0→1. Synapomorphies of Parabolinella (expect P. prolata): Ch. 4, 0.95→1–1.22; Ch. 5, 0.58→0.67-0.8; Ch. 7, 1.08→1.01; Ch. 19, 0→1. Change of range: Ch. 10, 0.3–0.43→0.37–0.43.
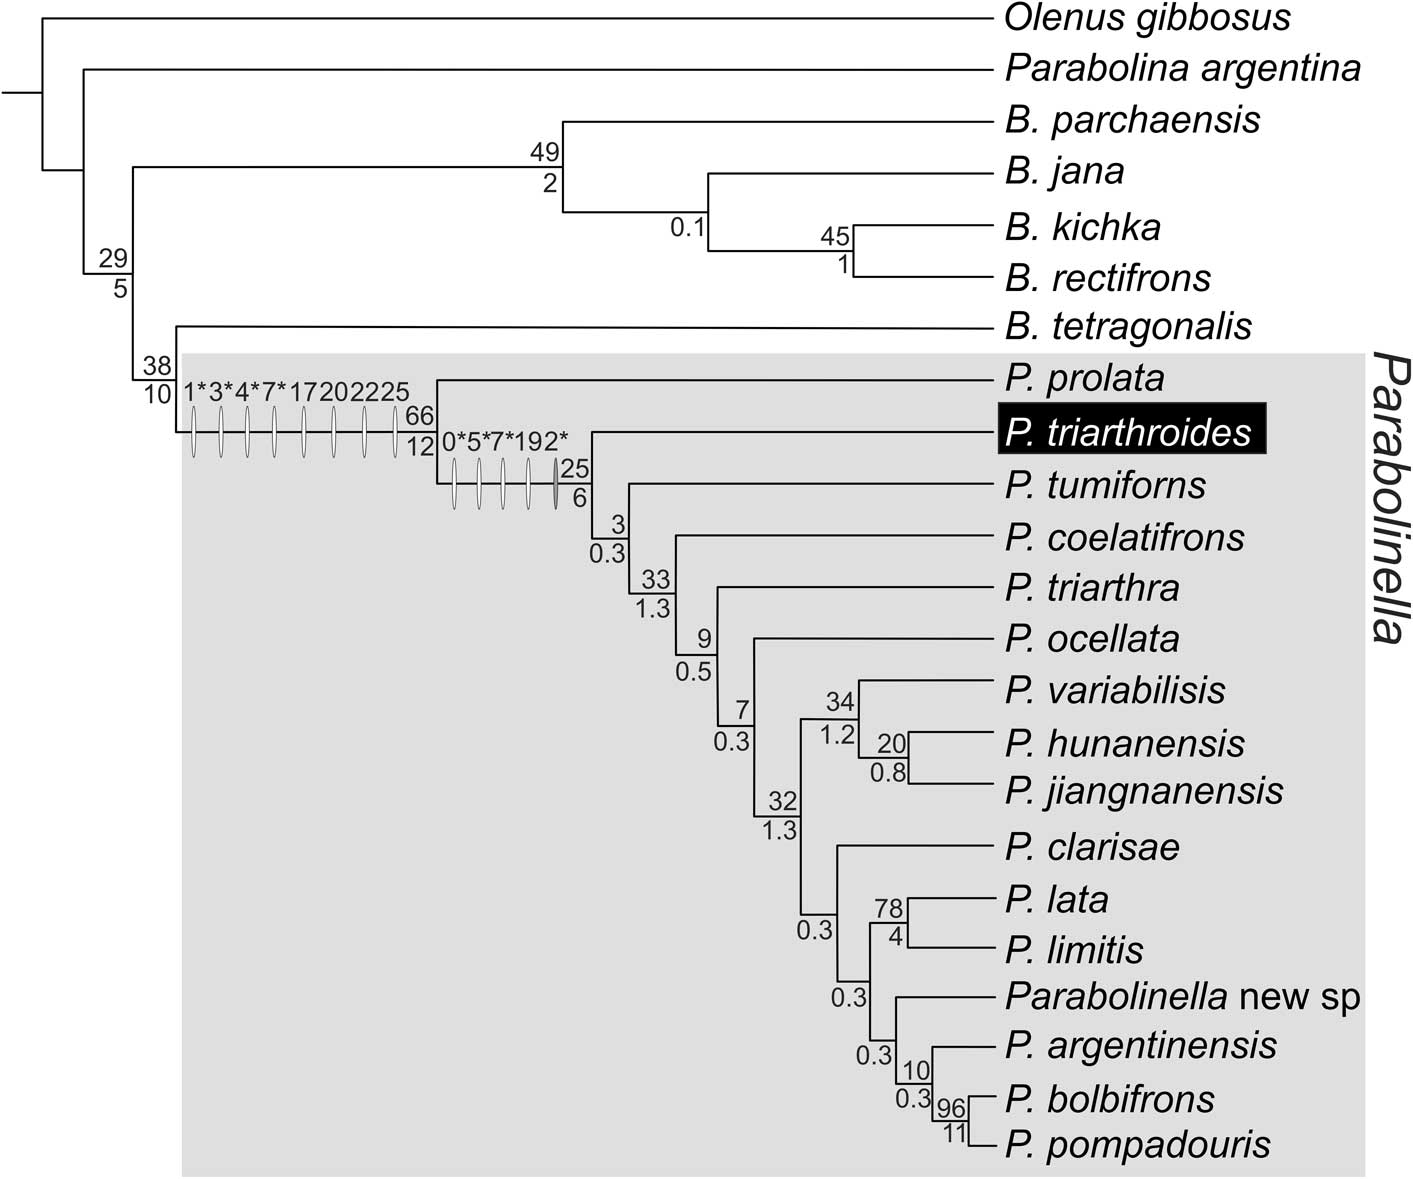
Figure 6 Topology obtained applying implied weighting (k=10–14) from the complete dataset with continuous partition code as data corrected by the geometric mean (DP + CPGM); fit: 7.08 (for k=11); length: 150.590; CI: 0.337; RI: 0.525. Synapomorphies are indicated with white ovals over the branches and changes in range of the continuous characters are represented with gray ovals. Numbers above the ovals are characters in Table 2. Asterisks indicate those characters that allow differentiation of the two genera in the morphometric analysis: Ch. 0: LC, Ch. 1: Lgl, Ch. 2: LOR, Ch. 3: LPA; Ch. 4: LPF, Ch. 5: WPF; Ch. 7: Wgl.B (acronyms as Table 1). Numbers above branches are the GC Jacknife values; numbers below branches are the Bremer Support in units of fit ×100. Synapomorphies of Parabolinella genus: Ch. 1, 1.97→1.92; Ch. 3, 0.51→0.69–0.73; Ch. 4, 0.35→0.48–0.55; Ch. 7, 2.1–2.18→2.06; Ch. 17, 0→1; Ch. 20, 0→1; Ch. 22, 0→1; Ch. 25, 0→1. Synapomorphies of Parabolinella (expect P. prolata): Ch. 0, 3.01–3.05→2.8–2.99; Ch. 5, 1.23→1.31–1.33; Ch. 7, 1.08→1.01; Ch. 19 0→1; change of range: Ch. 2, 0.41–0.46→0.34–0.46.
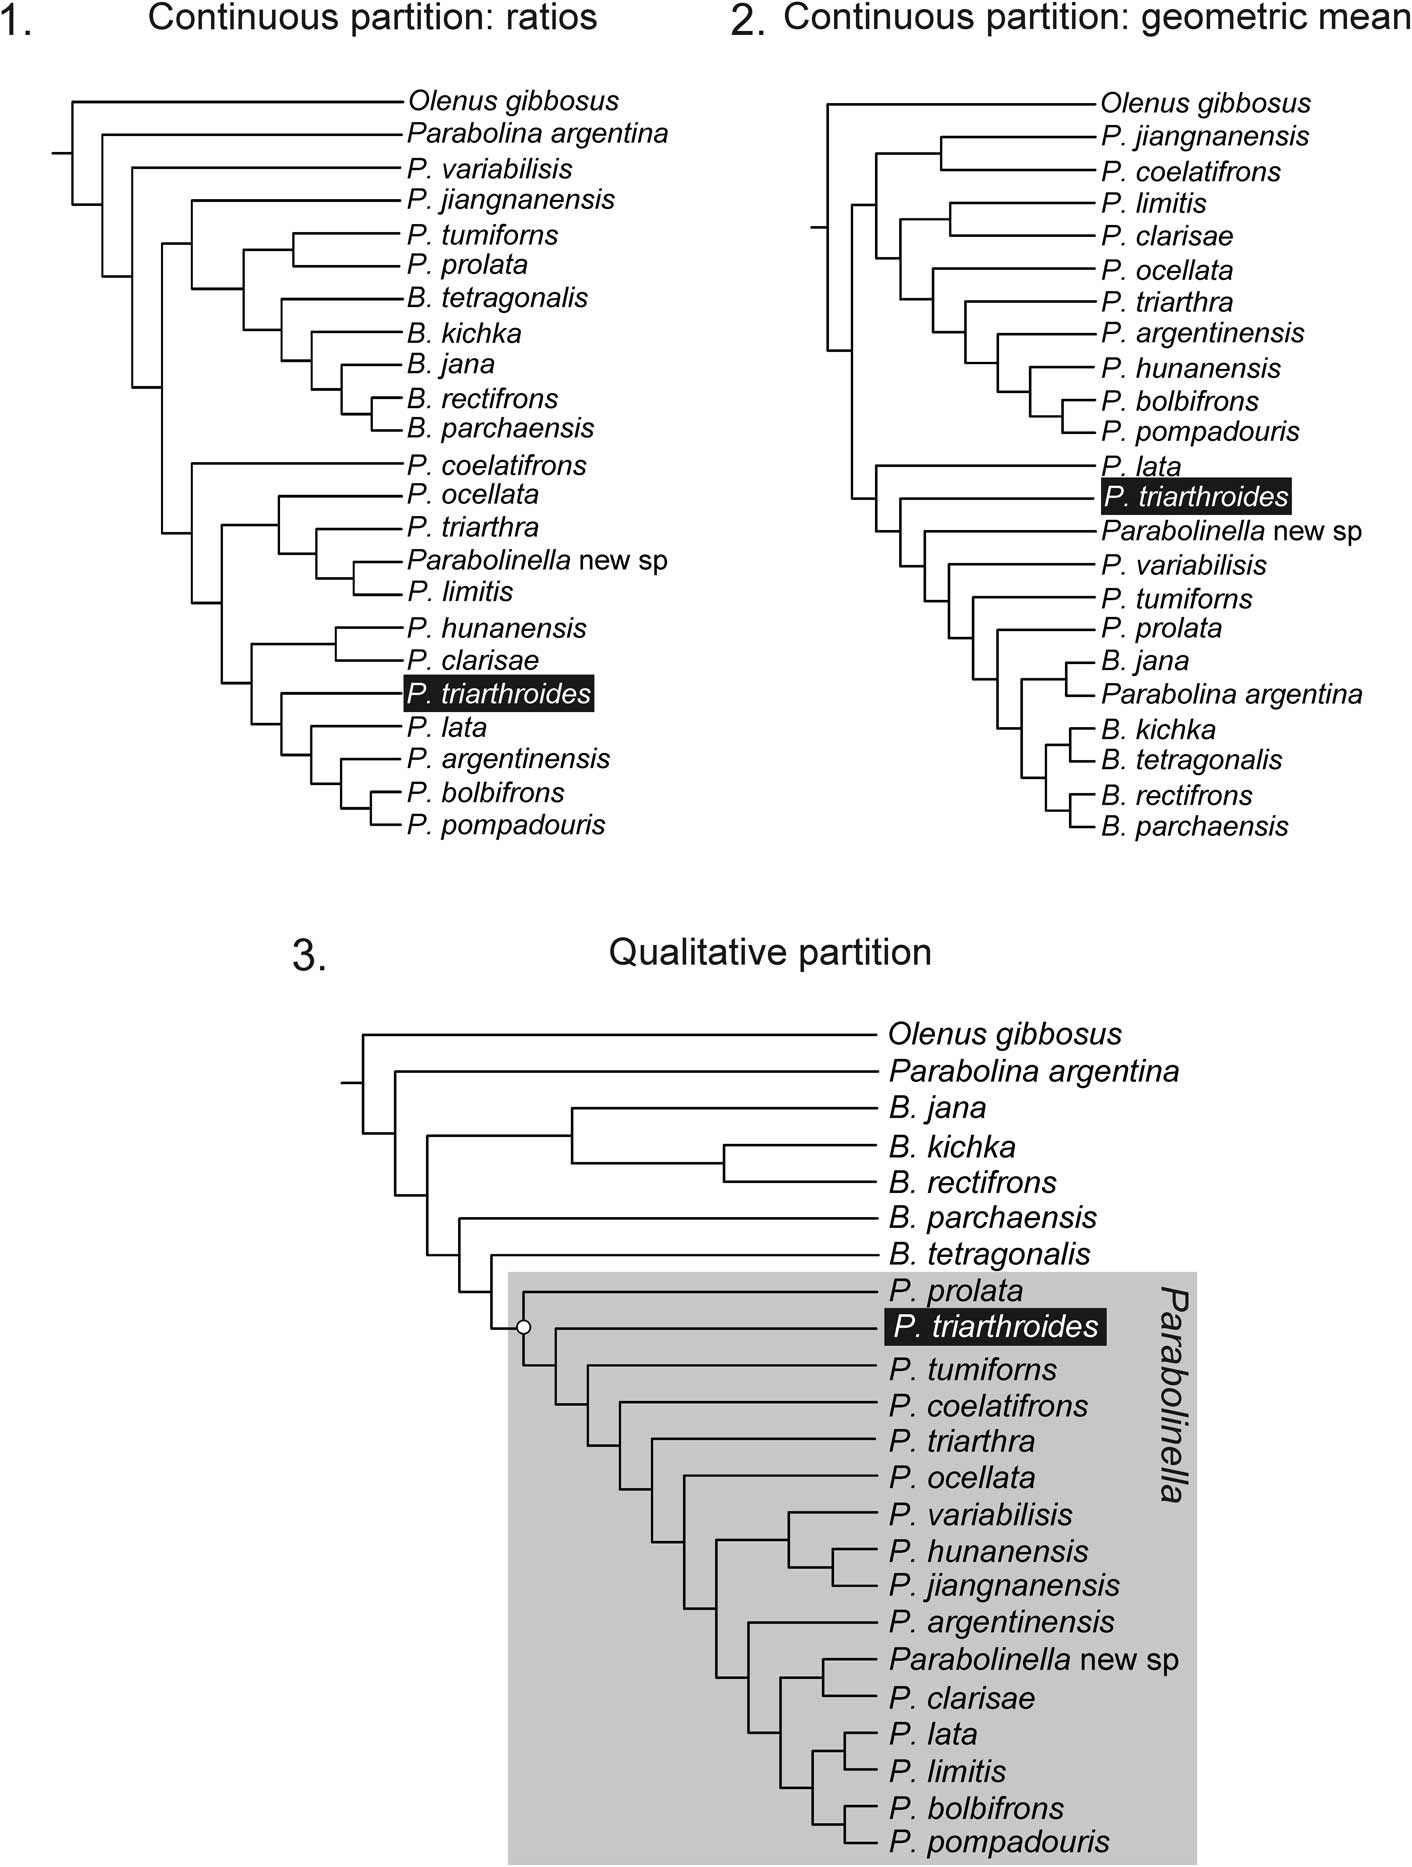
Figure 7 Topologies obtained with each partition: (1) continuous partition coded as ratios (CPR) applying implied weighting (k=12–3), fit: 1.48 (for k=11), length: 33.130, CI: 0.44, RI: 0.548; (2) continuous partition coded as data corrected by the geometric mean (CPGM) applying implied weighting (k=14–4), fit: 7.08 (for k=11), length: 35.371, CI: 0.412, RI: 0.578; (3) qualitative partition; fit: 4.8 (for k=11), length: 106, CI: 0.34, RI: 0.565.
When all characters are included in the analysis, the discrete partition controls the structure of the tree (Figs. 5–7). The topologies obtained for each complete matrix (with CPR or CPGM data) do not differ so widely with the use of different k values. As mentioned above, when the analyses were performed with the complete dataset, the genus Parabolinella was always recovered as a monophyletic group and the differences are within the Parabolinella clade (Figs. 5, 6).
The Parabolinella clade is supported by four synapomorphies within the discrete partition: the presence of an adaxially bifurcated S1 furrow (Ch. 22, 0→1), which is the only non-homoplastic character; the palpebral lobes centered to S2 (Ch. 17, 0→1); the anterior termination of glabella rounded (Ch. 20, 0→1); and the S2 furrows shorter than S1 (Ch. 25, 0→1) (Figs. 5, 6; Table 2). Within the continuous partition, four additional synapomorphies emerge with CPR and with CPGM, although they are not the same. Considering CPR, the synapomorphic transformations are: shorter glabella related to the length of the cephalon (Ch. 1, 0.68→0.63); the preglabellar field occupies a larger proportion of the preglabellar area (sag.) (Ch. 3, 0.69→0.72); preglabellar field well developed related to length of the occipital ring (sag.) (Ch. 4, 0.58→0.94); posterior cephalic border shorter as a proportion of length of occipital ring (Ch. 6, 0.58–0.59→0.54–0.57) (Fig. 5). The first three of these synapomorphies also are recovered as characters of importance to distinguish the two genera in the morphometric analysis. On the other hand, the synapomorphies of the genus for CPGM are: a well-developed preglabellar area (sag.) and preglabellar field (sag.) (Ch. 3, 0.51→0.69-0.73; Ch. 4, 0.35→0.48–0.55); and a short (sag.) glabella with a narrow base (tr.) (Ch. 1, 1.97→1.92; Ch. 7, 2.1–2.18→2.06) (Fig. 6). In this case, all four synapomorphies found coincide with variables that allow separation of both genera in the morphometric analysis.
Other characters that emerge from the morphometric analysis also show some phylogenetic signal; they are recovered as synapomorphies of all Parabolinella species, except for P. prolata Robison and Pantoja-Alor, Reference Robison and Pantoja-Alor1968. Both matrices entail the wider posterior fixigenae (tr.) (CPR, Ch. 5, 0.58→0.67–0.8; CPGM, Ch. 5, 1.23→1.31–1.33) (Figs. 5, 6); and only for CPGM, a shorter cranidium (sag.) (Ch. 0, 3.01–3.05→2.8–2.99) (Fig. 6). Finally, it is important to note that the width of interocular genae related to the width of the glabella at the eye line (Ch. 10 of CPR, see Table 2) and the length of the occipital ring (Ch. 2 of CPGM, see Table 2) show changes in their ranges on the basal nodes of the Parabolinella clade, although they are not recovered as synapomorphies. Therefore, Parabolinella (except P. prolata) have higher interocular genae ratio (Ch. 10, 0.3–0.43→0.37–0.43) (Fig. 5) and larger occipital ring (Ch. 2, 0.41–0.46→0.34–0.46) (Fig. 6).
Discussion
Quantitative characters are important tools for the discrimination of species, especially in fossils in which the morphology is the only data available to distinguish biological units. Multiple approaches are necessary to understand how these characters vary within and between species (e.g., MacLeod, Reference MacLeod2002; Hopkins and Webster, Reference Hopkins and Webster2009; Monti et al., Reference Monti, Benítez and Ramírez2016). Morphometrics can help distinguish patterns of morphological variation in a given group; however, cladistics provides an evolutionary hypothesis for this group, which indicates how these variations would have evolved. Both methods are complementary and necessary to propose a more integral approach and more rigorous taxonomic decisions (MacLeod, Reference MacLeod2002).
The present study demonstrates that log-transformed raw data can be used to differentiate Parabolinella from Bienvillia, although it is difficult in this kind of analysis to recognize variables of importance that can be used to directly distinguish both genera. Only two characters emerged from this analysis: the length of preglabellar area and preglabellar field. However, when data are corrected (using geometric means and ratios), both genera can be readily distinguished and new variables of importance that allow their differentiation can be recognized.
All the analyses performed here gave similar results in relation to the position of P.? triarthroides, which is located within the most extreme forms of the genus Parabolinella. All the analyses also allow separation of the two genera; however, correction with the geometric mean provides more useful characters with smaller confidence intervals (Tables 4, 5) for differentiating them. Particularly, importance of the length and width of the occipital ring and the relative size of the cranidium could be revealed. These two characters could not otherwise be identified in the analysis with the ratios. A possible explanation for this result may be the fact that the geometric mean is a more holistic measurement because it includes all the variables to calculate a size estimator for the specimen. However, ratio variables can be affected by the relationship between the two original variables, if they co-vary. An example of this situation could be the width of the interocular genae. This character is not recovered as important to distinguish both genera when data were corrected by the geometric mean. However, when using ratios, the width of the interocular genae related to the width of the glabella (at the eye line) is strongly correlated with PC1. Through the combination of both results, the width of glabella (at the eye line) is shown to be the character that differentiates both genera, instead of the width of the interocular genae. Even if the size effect could not be completely eliminated from the analyses, both corrections applied to reducing size effects proved to be equally effective in the sense that they revealed the morphological differences of both genera.
This study also confirms that the general morphology of the cranidium of Parabolinella differs from that of Bienvillia in having a more-developed preglabellar area (sag.) and preglabellar field (sag.), wider posterior fixigenae (tr.), larger glabella and cranidium, and higher ratio between the width of the interocular genae and the width of glabella (at the eye line) (tr.) (Fig. 4). The first three characters have been used to justify the inclusion of P.? triarthroides in Parabolinella (e.g., Harrington and Leanza, Reference Harrington and Leanza1957). In addition, the types of P.? triarthroides show a similar morphology to the genus Parabolinella, and they are located far from the overlapping zone. Therefore, the morphology of P.? triarthroides cannot be considered as intermediate, as proposed by Harrington and Leanza (Reference Harrington and Leanza1957). These authors arrived at this conclusion based on the original description of P.? triarthroides made by Harrington (Reference Harrington1938), who reported the presence of a simple preoccipital furrow (S1) in this species. Indeed, in a previous phylogenetic analysis, this character was also identified the most significant difference between P.? triarthroides and the rest of the species of Parabolinella (Monti and Confalonieri, Reference Monti and Confalonieri2013). However, despite the importance of this character for the genus diagnosis, the correction of the original matrix regarding this particular character (from simple to bifurcated for P. triarthroides) does not produce a substantial change in the results of the cladistics analysis compared with the previous work (tree not shown). In this context, the combination between the codification of the continuous characters and the inclusion of more species of Bienvillia were key strategies to solve the position of P.? triarthroides. Therefore, the implementation of different methodologies (morphometric and phylogenetic approaches, based on raw and corrected data) gave a better understanding of how the quantitative characters and their codification may affect the proposed relationships between the species, as well as the clue to observe with more detail more specimens, and to uncover possible reasons of the discrepancies: the misidentification of one character (simple instead of bifurcated furrow).
Both types of continuous partitions recovered as synapomorphies of Parabolinella the following characters: larger preglabellar area (sag.) and preglabellar field (sag.), and shorter glabella (sag.). One more character was recovered as a synapomorphy of the genus, but it is different according to the type of coding. When quantitative characters are coded as ratio variables, there is more consistency between the qualitative and quantitative partitions, but characters coded as geometric means gave better-supported clades. Many authors have pointed out that the use of ratios may fail to eliminate the allometric effect, and at the same time can create new relationships between previously uncorrelated characters (e.g., Corruccini, Reference Corruccini1977; Albrecht et al., Reference Albrecht, Gelvin and Hartman1993).
Another problem could be that some measurements can be repeated in more than one character, violating the fundamental principle of character independence. There is a long debate in the scientific literature about the best way of coding quantitative characters, but no consensus on how to solve this problem has been yet reached (e.g., Corruccini, Reference Corruccini1977; Hills, Reference Hills1978; Albrecht et al., Reference Albrecht, Gelvin and Hartman1993; MacLeod, Reference MacLeod2002; Rae, Reference Rae2002; Jansen, Reference Jensen2003; Clouse et al., Reference Clouse, De Bivort and Giribet2010; De Bivort et al., Reference De Bivort, Clouse and Giribet2010). For instance, different techniques were proposed to adjust ratios that maximize the reduction of size information (Corruccini, Reference Corruccini1977; Hills, Reference Hills1978; Albrecht et al., Reference Albrecht, Gelvin and Hartman1993), and to eliminate co-varying continuous characters from the data matrix (Clouse et al., Reference Clouse, De Bivort and Giribet2010; De Bivort et al., Reference De Bivort, Clouse and Giribet2010). In the present study, the main difference between both ways of coding is that the use of geometric means has the primary function to eliminate size effect while the use of ratios reflects shapes; relative proportions or positions of different structures of the cranidium morphology (see Albrecht et al., Reference Albrecht, Gelvin and Hartman1993 for a similar distinction). Likewise, both types of coding used here are intuitive and easily understandable, being an advantage when interpreting results. Their performance was very similar. Therefore, there is not definite answer on how to code characters and which way will be better in each case, so further research will be necessary to explore the best way of coding in every particular dataset.
Finally, some characters of importance to distinguish the two genera in the morphometric analysis also have evolutionary importance because they are recovered as synapomorphies of Parabolinella (e.g., the length of the preglabellar area [Ch. 3], the length of the preglabellar field [Ch. 4], and the length of the glabella [Ch.1]), both expressed as ratios or as data corrected by the geometric mean (Table 2, Figs. 5, 6). The width of the glabella at the base (Ch. 7) is also added to the list of synapomorphies when using CPGM. Regarding the width of the posterior fixigenae (Ch. 5) and the length of the cranidium (Ch. 0), they show some phylogenetic signal because they are recovered as synapomorphies of all of the Parabolinella species, except P. prolata (Figs. 5, 6). Lastly, the other characters that emerge from the morphometric analysis are those that change in their ranges on the basal nodes of the Parabolinella clade (for CPR, Ch. 10 [WPF/WOR] and for CPMG Ch. 2 [LOR]; see Table 2; Figs. 5, 6), although they are not recovered as synapomorphies. In this sense, the two types of analysis are complementary: the range of the morphological variation for each genus and the position of the type material of P.? triarthroides can be set from the morphometric analysis; however, without a phylogenetic context, the morphological similarities can also be interpreted as the result of convergence. When combining the analyses, the similarities between the cranidium of P.? triarthroides and the rest of the species of Parabolinella can be interpreted as evidence of homology rather than as the result of convergent evolution. Summarizing, based on the general morphology of the cranidium, the qualitative characters, and the phylogenetic analysis, P. thriartroides should be left within the genus Parabolinella.
As a more general conclusion, the results here presented lead to the suggestion that that the analysis of qualitative characters that emerge from direct observation of the specimens will be the first step to consider for elaborating generic diagnoses. Morphometric analyses will be a useful complementary approach to easily identify recognizable quantitative characters that all the species included in a particular genus will share. Finally, phylogenetic analyses will allow assessment of the evolution of those diagnostic characters and testing of their importance as true synapomorphies defining natural groups.
Conclusions
Both methodologies, together with a good description of the specimens, are complementary and necessary to propose a more integral analysis and to make taxonomic decisions. The combined analyses show that the similitudes observed among the cranidia of P. triarthroides and the rest species of Parabolinella are not the product of evolutionary convergence. Therefore, P. triarthroides should be included in the genus Parabolinella, as traditionally has been considered.
In regard to the morphometric analysis, the two ways of taking size differences into consideration are equally effective, and the results are similar. But the analysis carried out with the data corrected by the geometric mean provides more characters of importance for differentiating the genera and is more effective in classifying with the discriminant function. On the other hand, the cladistic analysis based on characters coded as ratios exhibit more consistency between qualitative and quantitative partitions.
The general morphology of the cranidium of P. triarthroides is within the range of variation of the Parabolinella genus. Parabolinella (including P. triarthroides) is a monophyletic group supported by one nonhomoplastic synapomorphy, the presence of an adaxially bifurcated S1 furrow, the palpebral lobes centered to S2, the anterior termination of glabella rounded, S2 furrows shorter than S1, the preglabellar field occupying a larger proportion of the preglabellar area (sag.), a well-developed preglabellar field (sag.), and a short (sag.) glabella with a narrow base (tr.).
Acknowledgments
We thank M. Ramírez for carefully reading an early version of the manuscript and for giving valuable comments and advice. Also acknowledgments are given to B. Aguirre-Urreta and M. Tanuz of the Facultad de Ciencias Exactas y Naturales, Universidad de Buenos Aires (Argentina) for the loan of material in their care. We also tank M.F. Fourastié for helping with the figures. We thank J. Esteve, an anonymous reviewer, and the editors, B. Hunda and N. Hughes, for improving the quality of the work. Finally we acknowledge CONICET and Universidad de Buenos Aires for financial support.
Accessibility of supplemental data
Data available from the Dryad Digital Repository: http://dx.doi.org/10.5061/dryad.27qj6


