Introduction
Powder-snow avalanches are a poorly understood physical phenomenon (Reference Dufour, Gruber and AmmannDufour and others, 2001). Although it is generally accepted that powder avalanches form as a result of a fast-flowing dense snow avalanche, the physical mechanisms involved in the formation and motion of the highly turbulent powder cloud are still the subject of much debate. The turbulent cloud flows above the dense flow, and an interaction between the two flows exists. Because the motion of the airborne cloud is less sensitive to terrain features, the cloud can decouple from the dense flow and often flows with enough force to cause considerable damage to forests and buildings. Instrumented field studies of powder-snow avalanches are difficult to realize, although macroscopic characteristics such as powder-cloud height and front velocity have been measured at the Swiss Vallée de la Sionne test site (Reference Dufour, Gruber and AmmannDufour and others, 2001; Reference BiescasBiescas, 2003; Reference Vallet, Turnbull, Joly and DufourVallet and others, 2004) (Fig. 1). The measurements reveal that powder-snow avalanche heights can quickly reach 100 m, while their velocity can exceed 100 m s-1.
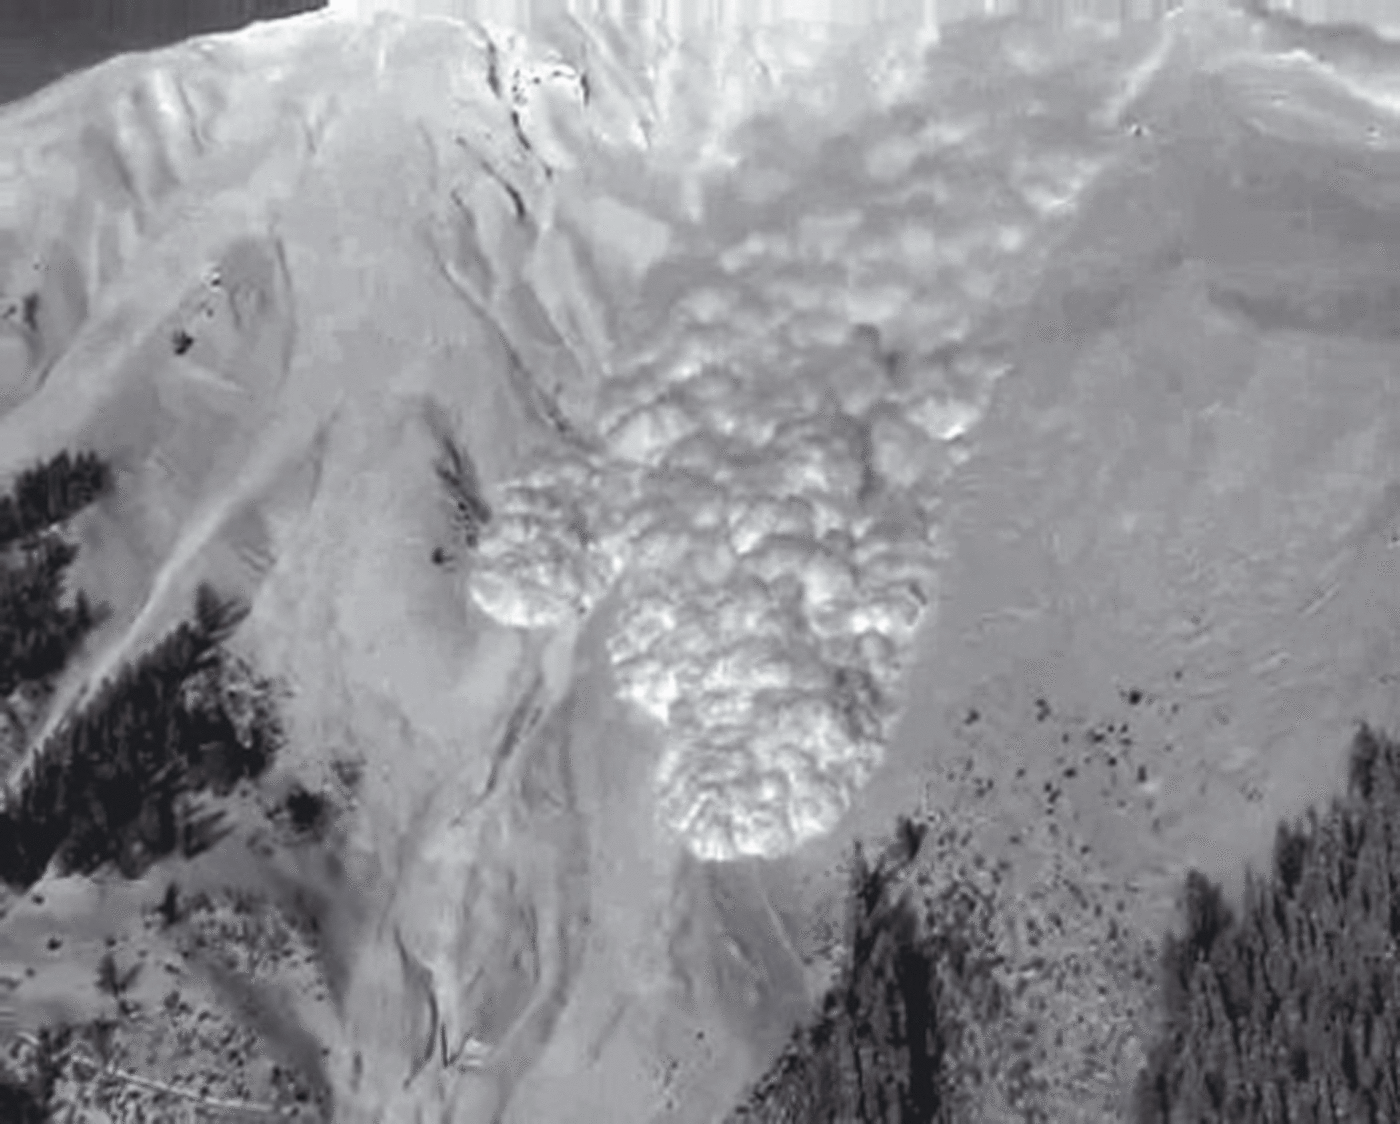
Fig. 1. Photograph of the avalanche triggered artificially at the Vallée de la Sionne avalanche test site in Switzerland on 31 January 2003 (courtesy of J. Le Goulm).
Research efforts to understand powder-avalanche flow mechanics have concentrated on physical modelling coupled with laboratory experiments (Reference Beghin, Hopfinger and BritterBeghin and others, 1981; Hutter, 1996; Reference Rastello, Ancey, Ousset, Magnard and HopfingerRastello and others, 2002; Reference AnceyAncey, 2004; Reference Rastello and HopfingerRastello and Hopfinger, 2004) and numerical modelling (Naaim, 1995; Reference Sampl and ZwingerSampl and Zwinger, 2004; Reference Étienne, Rastello and HopfingerÉtienne and others, 2006; Reference Turnbull and McElwaineTurnbull and McElwaine, 2007). Comparisons have been made with gravity-driven suspensions (Reference SimpsonSimpson, 1997; Reference Rastello and HopfingerRastello and Hopfinger, 2004), gravity-driven plumes (Reference Turnbull, McElwaine and AnceyTurnbull and others, 2007) and non-Boussinesq gravity clouds on steep slopes (Reference AnceyAncey, 2004; Reference Rastello and HopfingerRastello and Hopfinger, 2004).
All modelling approaches should reflect the fundamental characteristics of natural powder-snow avalanches. A poorly known quantity is the size of the snow particles in the powder-snow cloud. The behaviour of a turbulent dilute suspension (powder cloud) is highly dependent on the sedimentation velocity of the particles. The erosion or particle intake mechanism depends directly on the particle size (Reference Rastello and HopfingerRastello and Hopfinger, 2004). Furthermore, the self-maintenance of the suspension strongly depends on the ratio between the sedimentation velocity of the particles and the avalanche velocity (Reference Stacey and BowenStacey and Bowen, 1988).
An error of a factor of 10 in the particle diameter leads to an error of a factor of 100 in the sedimentation velocity of the particles (Reference Clift, Grace and WeberClift and others, 1978). In earlier work, Reference Clément-RastelloClément-Rastello (2001) reported a theoretical study that provides an order-of-magnitude estimate of the snow particles in a powder-snow avalanche. This work focused on the mechanisms present in a powder-snow avalanche and on how particle size is related to the evolution of the avalanche.
This paper tackles the problem from the experimental point of view: snow particles were captured inside a powder-snow avalanche, then stored and transferred to the laboratory where their size could be measured. The design and implementation of a device to capture particles from a powder-snow avalanche is described. The technique to process digital images of the captured particles to obtain particle size distributions is introduced, and the initial results are analysed and discussed.
Experimental Set-Up
The design of an experiment that captures snow particles in a powder-snow avalanche faces several difficulties as follows.
-
1. Velocities for a powder-snow avalanche are easily of the order of 60 m s−1 in the run-out zone and can reach >100 m s-1 in the transit zone. The exposed area must be small and streamlined to reduce impact stresses. The device should be inexpensive because of the high probability of avalanche damage.
-
2. Health and safety dictates an upper limit of 5 min for standing in the avalanche path before it is artificially triggered. The device located in the running zone must be set within these time constraints.
-
3. After the avalanche, a time of 20 min to 1 hour is required to secure the avalanche path. During this time, the captured snow particles must not undergo any metamorphism.
-
4. Particular care is necessary to ensure that snow particles are not damaged while captured.
The snow-capturing device was designed and built with these limitations in mind (Figs 2 and 3).
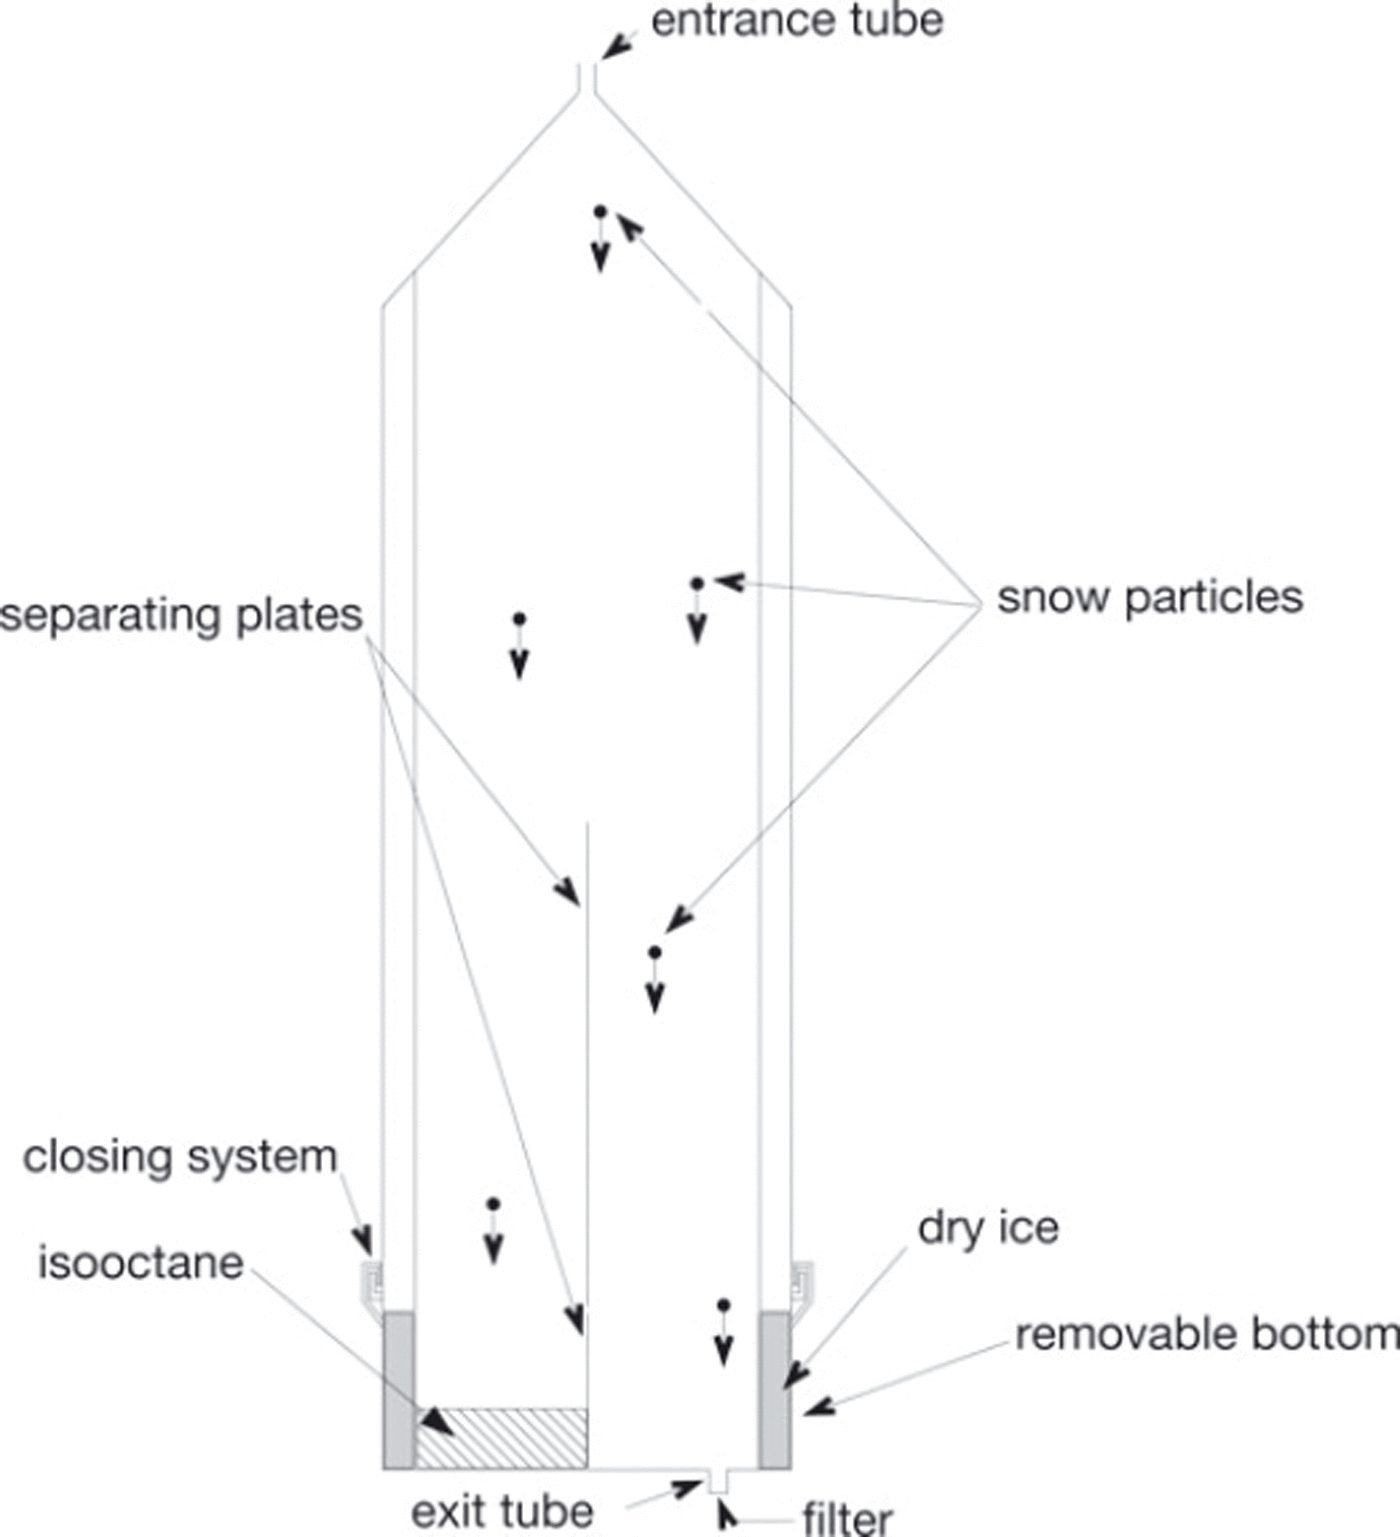
Fig. 2. Sketch of the device: section view.
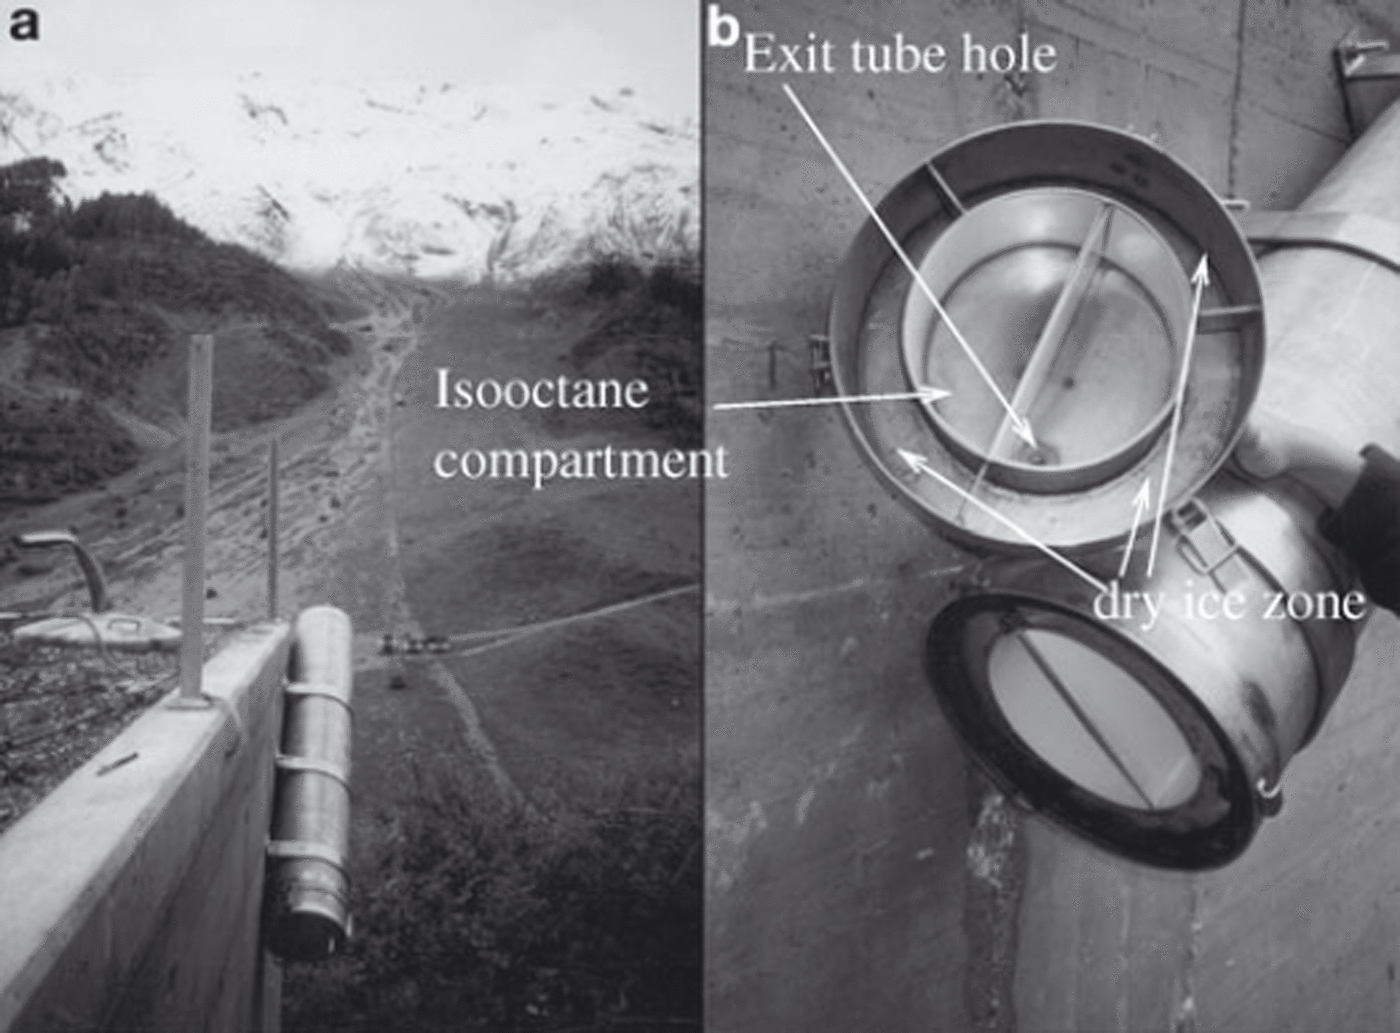
Fig. 3. (a) The experimental device fixed to the bunker of the Vallée de la Sionne test site and (b) the removable bottom.
Air and snow particles enter the device through a small tube (Ø = 0.02 m) that widens to a cavity of diameter 0.4 m.
This widening has the effect of slowing down the moving air by a factor of 400. An air velocity at the entrance of the tube of 60 m s−1 is thus reduced to 0.15 m s−1 within the instrument. Particle-drag forces then slow down the snow particles and prevent high-speed collisions of the particles with the collecting device. The tube is 1 m long.
Air is expelled through a 0.02 m diameter rear-facing tube. To prevent particles from filling the device, compacting and agglomerating, a ceramic filter has been included in the exit tube which allows air (but not snow) to exit the device. As soon as enough snow particles have filled the filter, no air or particle circulation is therefore possible in the device.
Snow particles can be conserved without any metamorphism occurring for many months if they are immersed in isooctane at temperatures lower than 0°C (Reference Brun and PahautBrun and Pahaut, 1991). The bottom of the device was therefore equipped with a removable section (Fig. 3b). This section has three compartments, two in the centre and one on the outside. The first contains the exit tube and the filter. The second, into which isooctane is poured, collects the snow particles. The third, located on the outside, contains dry ice. The dry ice cools the isooctane to a temperature below 0°C, preventing snow particles from undergoing any metamorphism before they can be collected.
The device is made of stainless steel, and the inner part is partially covered in Teflon to prevent snow particles from sticking to the cold metal. Since it is mounted at a 45° angle to the horizontal plane in the axis of the avalanche path (Fig. 3a), gravity helps both the deposition process and the isooctane to remain in its compartment.
Experimental Procedure
Collection of particles
The device was fixed on the side of the bunker at the Vallée de la Sionne test site. A large, mixed snow avalanche (No. 506) depicted in Figure 1 was artificially triggered on 31 January 2003 (Reference BiescasBiescas, 2003; Reference Sovilla, Burlando and BarteltSovilla and others, 2006).
This avalanche has been discussed in detail by Reference Christen, Kowalski and BarteltChristen and others (2010). It was released at 0934 h from the Crêta Besse 2 release zone. The release area was ∼92 000 m2, with a volume of 77 550 m3 (assuming a mean fracture height of ∼0.84 m and width of 450 m over 200 m). The difference in altitude covered by the avalanche was 1200 m. Its width was of the order of 300–450 m. Front velocities of the order of 50–60 m s−1 were measured by video analysis.
Snow particles from the powder-snow part of the avalanche were collected. The dense flowing component stopped before reaching the bunker, which is located 100 m higher on the counterslope of the avalanche path. The avalanche deposits at the valley bottom reached 6.5 m. Twenty minutes after the avalanche event, the rear face of the device was opened to transfer the collected particles into small boxes filled with isooctane and cooled with dry ice. The device contained ∼650 particles which were perfectly separated from each other with no trace of compaction or damage. The boxes were subsequently preserved below 0°C before the imaging processing was performed.
Images of the snow particles
The snow particles were transported to the Laboratoire de Glaciologie et Géophysique de l’Environnement, Grenoble, France (LGGE), where the image processing was realized in a cold chamber. Air temperature in the chamber was maintained between −20 and −30°C, and no metamorphism of the snow was observed throughout the process. Snow particles were transferred from the boxes onto pieces of coloured paper. Pictures were taken only after the thin isooctane film, initially present, had completely volatilized. A digital camera, equipped with a zoom and fixed on a rack, was used. A ruler was included in each picture of the particles so that pixel dimensions could be accurately scaled.
Image and Data Processing
The goal is to measure an equivalent radius of particles from the digital pictures. Because pictures are inherently only two-dimensional (2-D), the third dimension of the particle is not accessible to us. Another difficulty arose from isooctane capillarity that makes it difficult to find small particles. It is difficult to distinguish between naturally agglomerated particles and those joined by residual isooctane. The task was complicated by the fact that the typical minimal precision (one pixel) of a picture corresponds to 0.02 mm, while the equivalent radius of many particles is ∼0.1 mm.
The image processing was divided into the following steps.
Dynamic thresholding
Pixels of the image classified as part of a particle are separated from the background of the picture using dynamic thresholding (Reference Gonzalez and WoodsGonzalez and Woods, 1992). The particle region grows iteratively starting from an initial point selected manually; each adjacent point of a similar colour is also classified as the particle region. The notion of similarity of colours is a simple threshold (Reference Gonzalez and WoodsGonzalez and Woods, 1992) on the Euclidean distance between colour vectors.
The designed image-processing tool allows each particle region to be tuned to the value of the threshold by a visual check of the result. The corresponding particle regions of the image of Figure 4 are depicted in Figure 5.
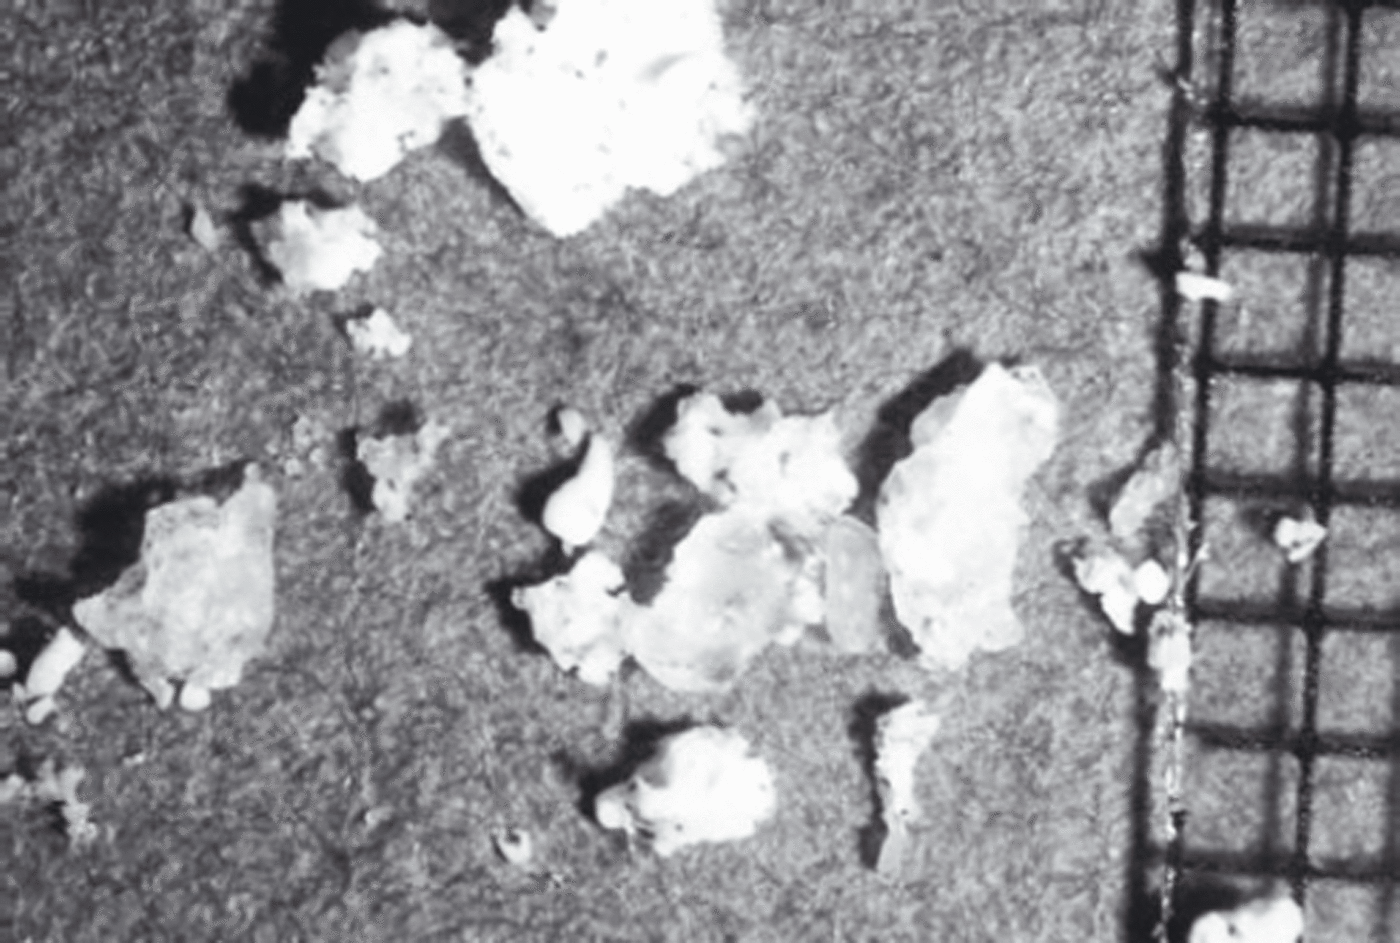
Fig. 4. Initial picture.
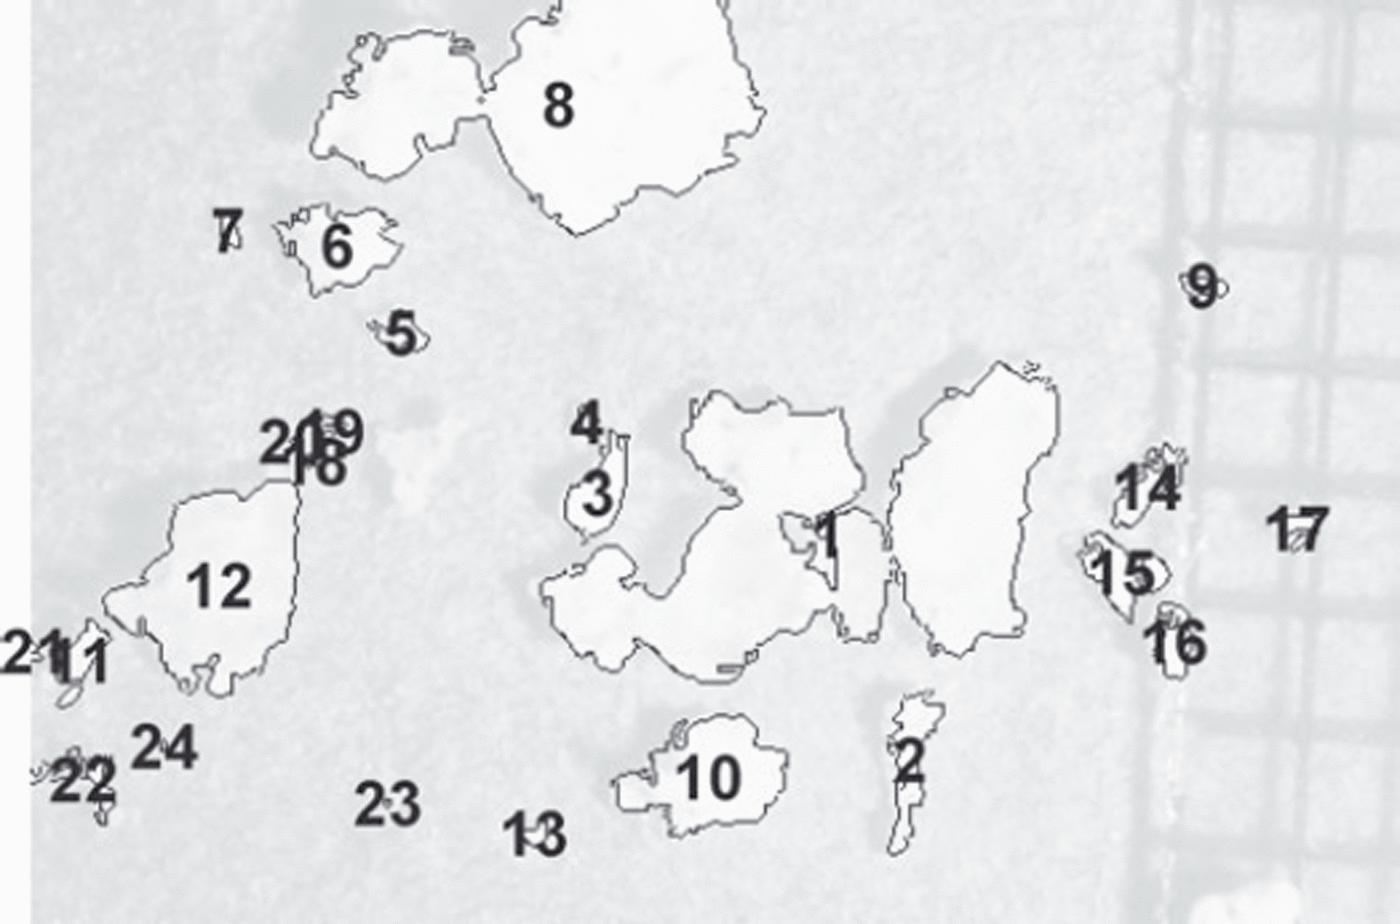
Fig. 5. Particle regions (24 were found) corresponding to Figure 4.
Aggregation
A particle (represented by an ellipsoid shape in Fig. 6) will be considered as an aggregate of subparticles. Particle regions are manually divided into subparticles, as depicted in Figure 7.
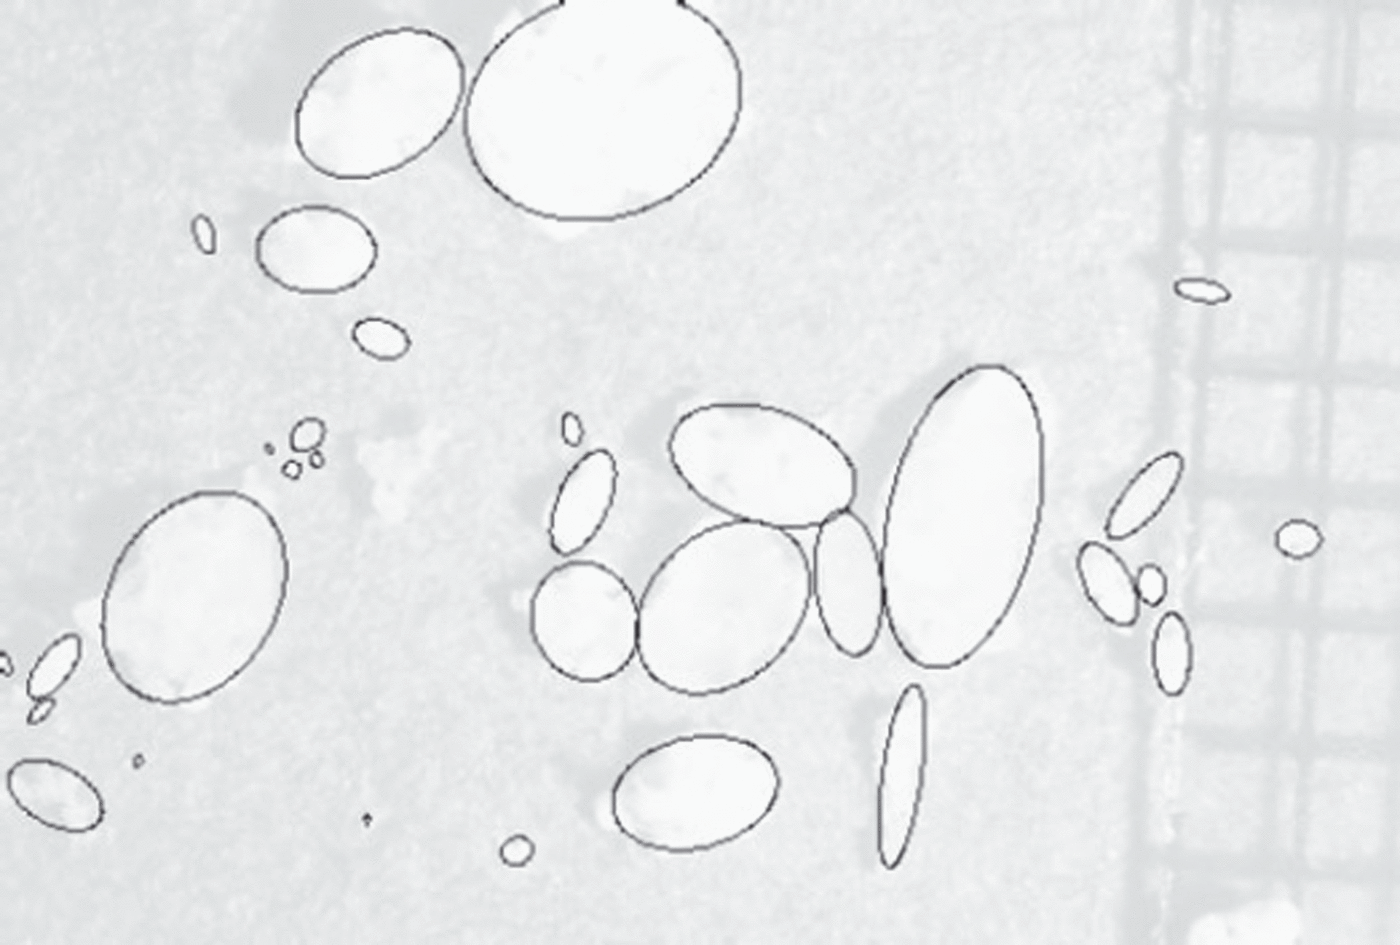
Fig. 6. Particles and their corresponding ellipses.
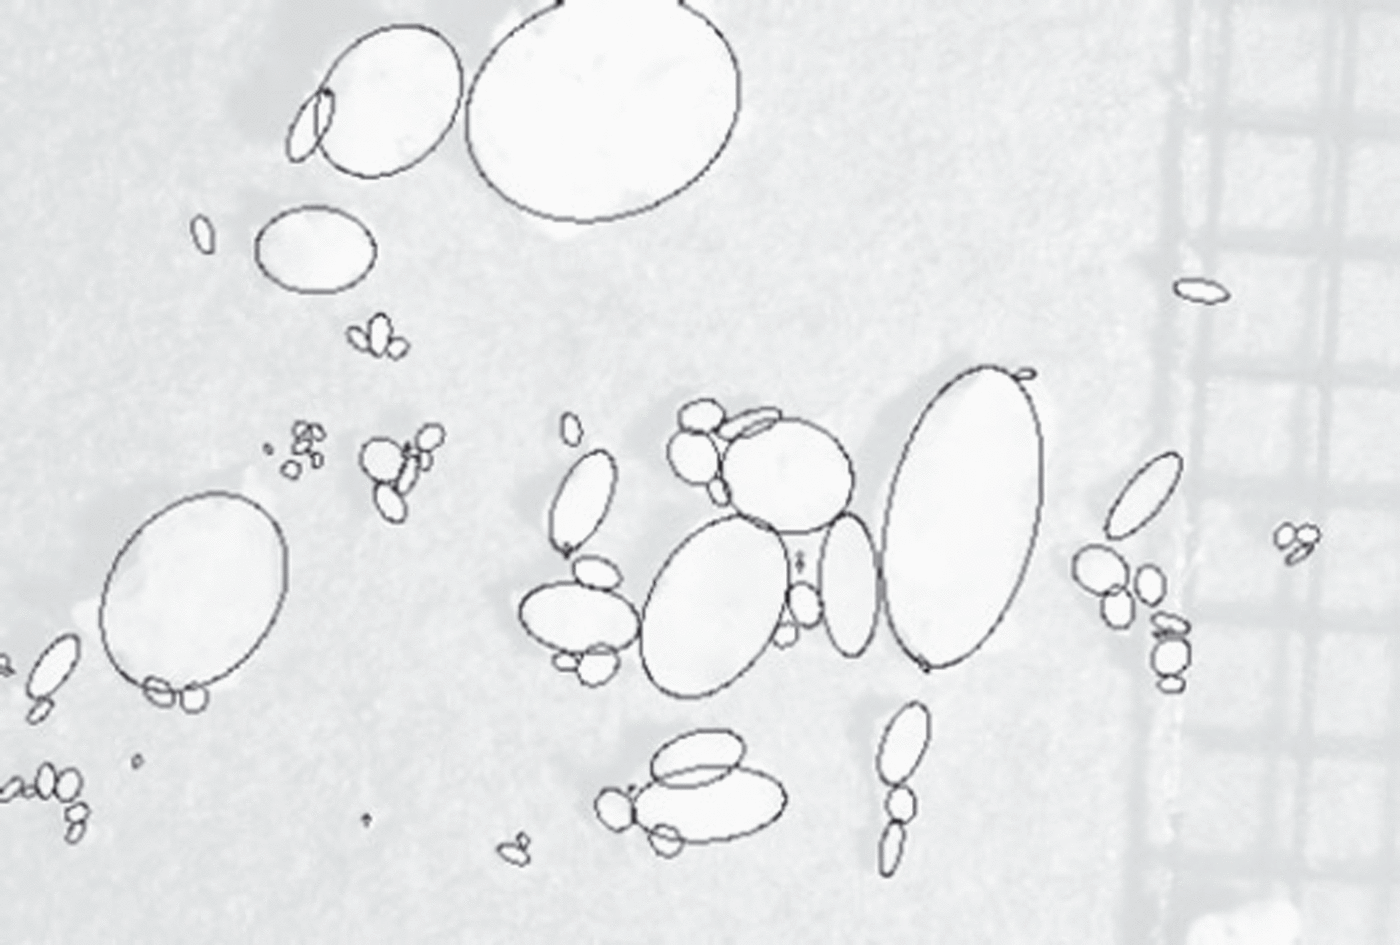
Fig. 7. Manually delimited subparticles and their corresponding ellipses.
This process of aggregation allows us to distinguish three cases:
-
1. a lower bound for particle size is obtained by considering that each particle is composed of only one subparticle;
-
2. an upper bound for particle size is obtained by considering that each particle is composed of all adjacent subparticles, i.e. all subparticles of a particle region;
-
3. an intermediate value (more realistic) for particle size is obtained by choosing the aggregates manually.
Particle volume
The 2-D image of each subparticle is first represented by an ellipse that has the same normalized second central moments (Reference TeagueTeague, 1980) (Fig. 7). Let A and a be the major and minor axes, respectively, of this 2-D ellipsoid. The subparticle is then represented by a three-dimensional (3-D) ellipsoid of axis lengths (A, a, a). The volume of each subparticle is evaluated as the volume of this 3-D ellipsoid. The volume of a particle is the sum of the volume of its composite subparticles. We define the size of the particle to be the equivalent radius, i.e. the radius of the sphere that has the same volume as the particle.
This procedure is not the only way to evaluate the size of the particles; other characteristic sizes exist. Reference ColbeckColbeck and others (1990) defined the size of a particle as the greatest extension. They noticed that it could be defined differently and mention two other different methods for measuring the size of particles: stereology and sieving. The authors outline the fact that the different methods provide different results.
Reference Gay, Fily, Genthon, Frezzotti, Oerter and WintherGay and others (2002) have proposed a method to measure the size of particles using image processing. A Sobel operator (gradient) (Reference Gonzalez and WoodsGonzalez and Woods, 1992) is used to separate particles from the background. For each particle, a so-called ‘skeleton’ is built. The method yields the mean convex radius, which is the average of the radii associated with each endpoint of the skeleton. The problem with this method is that end-points depend upon the resolution of the image. Most sizes obtained are between 0.1 and 0.3 mm.
Results and Discussion
The above image-processing technique applied to the set of images gives us the equivalent radius distribution for the subparticles, the intermediate case and the upper bound. The upper bound represents the maximum value for the equivalent radius of the snow particles present in the sample.
As can be seen in Figure 5, the automatic aggregation of the adjacent subparticles can sometimes give unrealistic particles (e.g. particle 1 in Fig. 5). The distribution of subparticles represents particles before clustering. Clustering should have occurred before or during the avalanche, but not during the gathering.
This provides a pessimistic lower bound for the particle equivalent radius. The obtained distribution for the intermediate equivalent radius of particles (corresponding radius given in millimetres) can be fitted by a log-normal distribution.
Figure 8 depicts a histogram of the logarithm (base 10) of the equivalent radius fitted by a normal distribution. The arithmetic mean and standard deviation (μ, σ) for the logarithm of the measured equivalent radii are (−0.79, 0.41). This gives a geometric mean and standard deviation (μG, σG) for the set of measured equivalent radii of (0.16, 2.57). Therefore, 90% of particles have an equivalent radius between 0.03 and 0.8 mm, with a (geometric) mean radius of 0.2 mm.
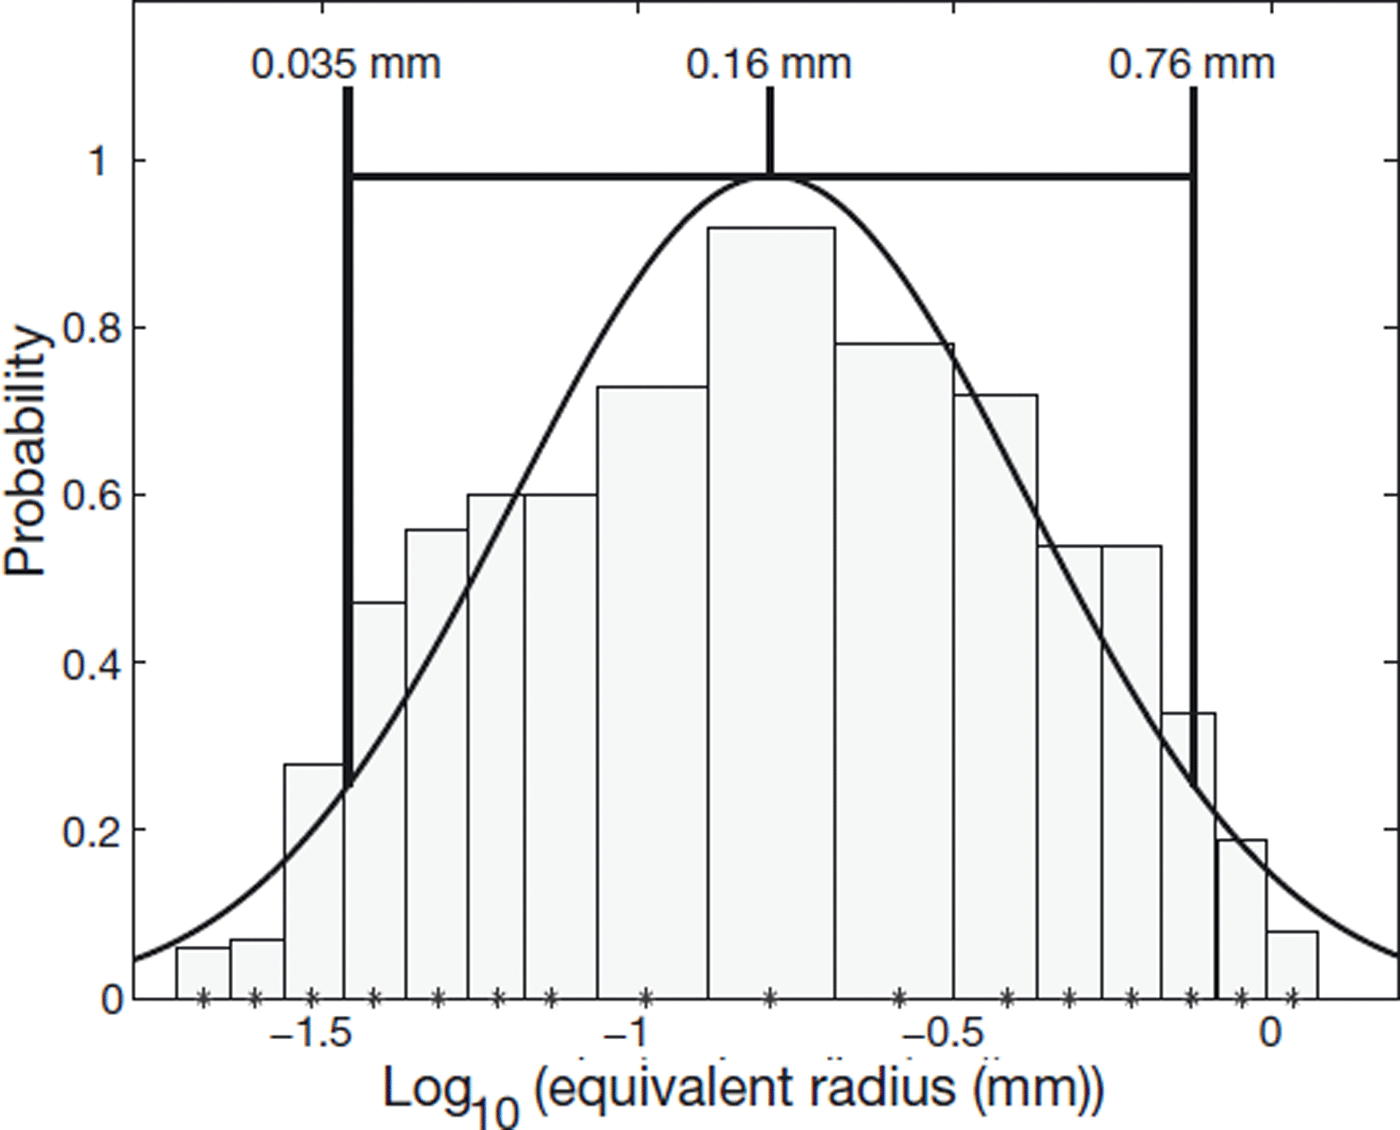
Fig. 8. Logarithm of the particle size fitted with a normal distribution.
The upper bound has similar values, with particle radii between 0.03 and 0.9 mm and a (geometric) mean radius of 0.2 mm. The obtained distribution for subparticles is also well fitted by a log-normal distribution with (μ, σ) = (−1.02, 0.38) (Fig. 9). This gives a pessimistic lower bound of particle radius between 0.02 and 0.4 mm, with a (geometric) mean radius of 0.1 mm.
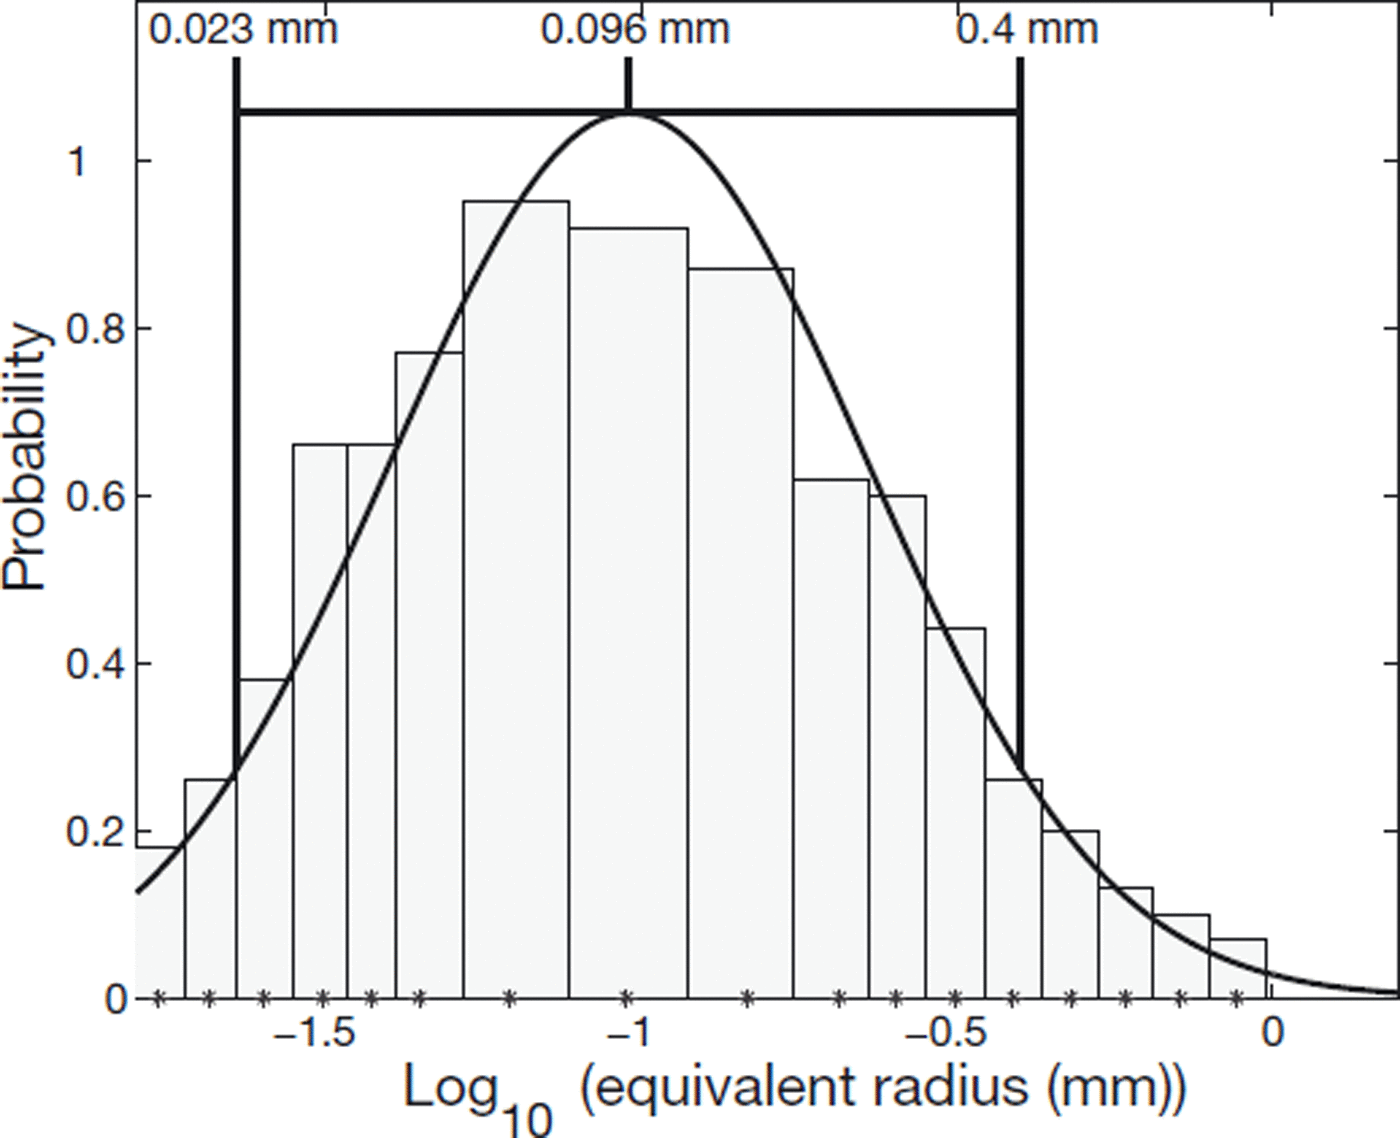
Fig. 9. Logarithm of subparticle size fitted with a normal distribution.
Reference Clément-RastelloClément-Rastello (2001) performed a theoretical study of the size of the particles present in a powder-snow avalanche. The study considered typical particle sizes present in the snow layer and then modelled different processes present in a powder-snow avalanche that impact the selection of the particles. The estimate obtained for the upper limit of the particle radius was 0.1 mm. The agreement with the present results is therefore encouraging.
Log-normal distributions have frequently been found for raindrops (Reference Feingold and LevinFeingold and Levin, 1986) and snow particles (Reference Nolin, Shi and DozierNolin and others, 1992). Rounded/wet snow particles (Reference ColbeckColbeck, 1986, Reference Colbeck1987; Reference EspinEspin, 2003) follow a log-normal distribution, while airborne grains have been fitted by Reference Clifton, Rüedi and LehningClifton and others (2006) using a two-parameter gamma distribution. Reference Bartelt and McArdellBartelt and McArdell (2009) found log-normal distributions for the size of the granules in the deposit of different dry and wet dense avalanches.
We are not aware of any results concerning size distribution of precipitation snow particles; nevertheless, they may reasonably behave as raindrops. Note that the size of the particles probably changes during the avalanche. Local shear due to turbulence, collisions and energy dissipation may lead to fragmentation, melting or fusion. Log-normal distributions are classically used when dealing with splitting (Reference ShinnarShinnar, 1961; Reference Cheng and RednerCheng and Redner, 1988), coalescing or crushing (A. Fujihara and others, http://iopscience.iop.org/1742-6596/31/1/038).
The size of particles in the snow cover has been widely measured in different contexts (e.g. Reference MellorMellor, 1964; Reference Shi and DozierShi and Dozier, 2000; Reference Gay, Fily, Genthon, Frezzotti, Oerter and WintherGay and others, 2002; Reference Dozier and PainterDozier and Painter, 2004). Most measured mean equivalent radii are between 0.1 and 0.8 mm (Fig. 10). The largest snow particles can reach several millimetres.
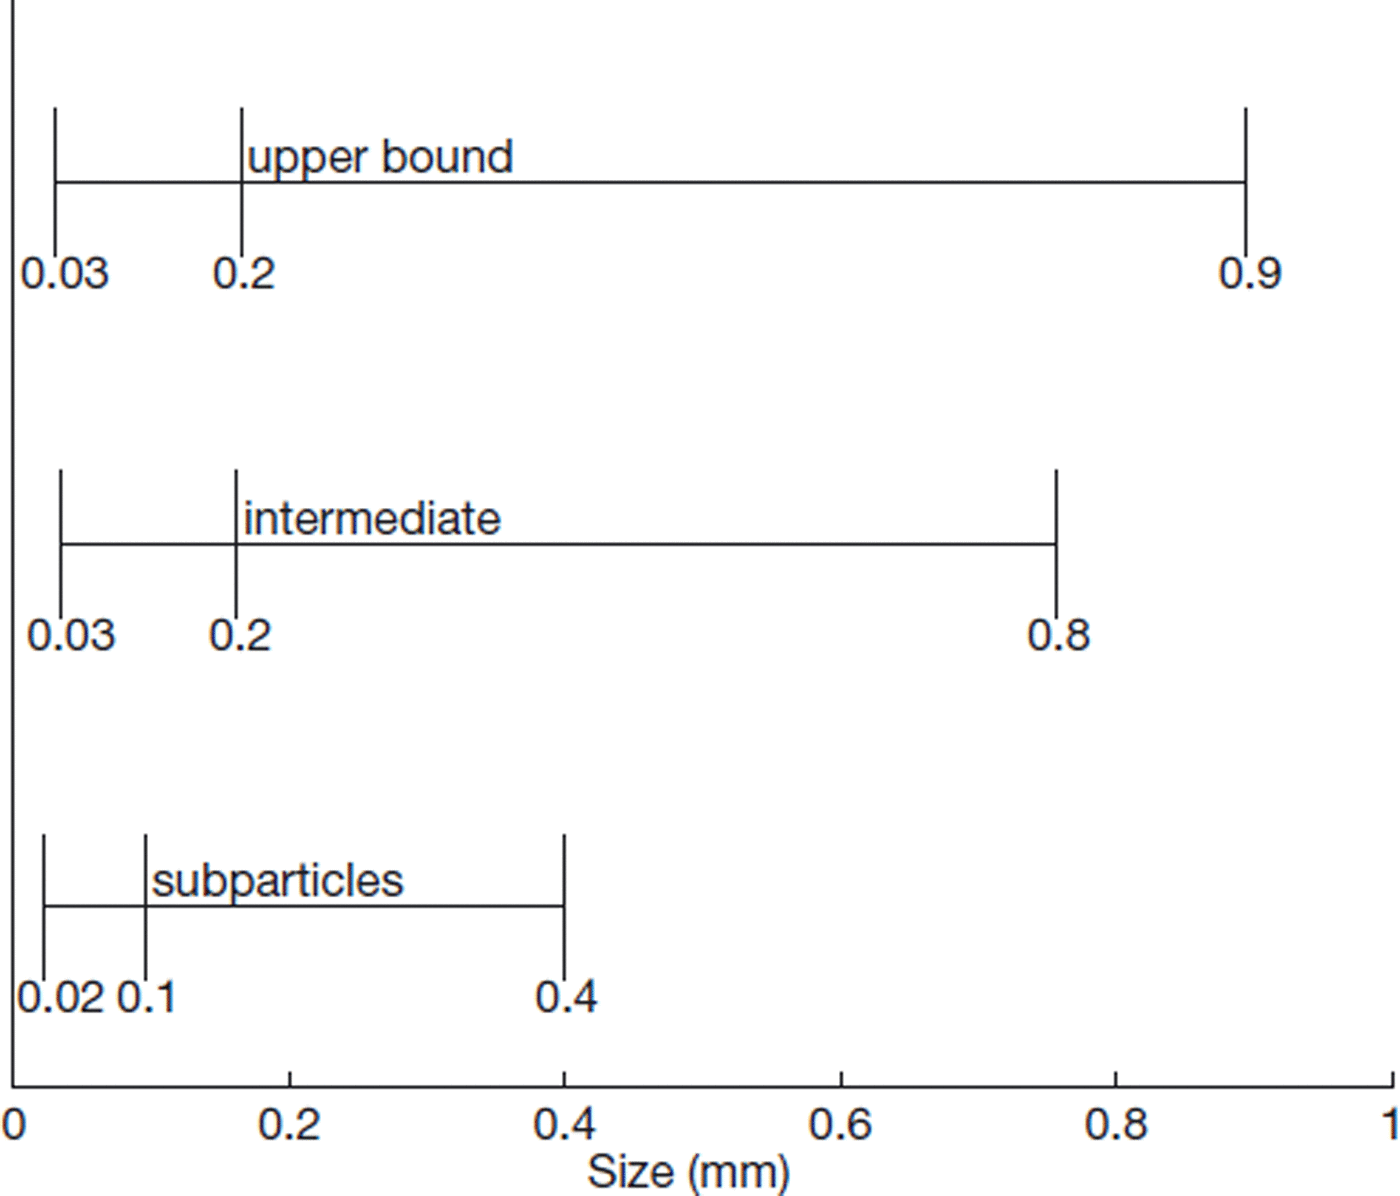
Fig. 10. Equivalent radius of particles.
Conclusion
We have designed a device to capture snow particles in a powder-snow avalanche. Compaction and agglomeration of particles have been avoided due to a ceramic filter positioned at the exit of the tube. The device slows down the particles to avoid particle commutations by collisions. Particles have been protected from any metamorphism by preserving them with isooctane and dry ice. Snow particles were collected in the powder-snow part of a mixed avalanche triggered on the Vallée de la Sionne experimental test site.
Images of the snow particles were taken in a cold chamber, and studied using an image-processing technique developed for this purpose. Each particle is decomposed into subparticles, and its volume is the sum of these. A subparticle has been represented as a 3-D ellipsoid (A, a, a) where A is the major axis and a the minor axis of an ellipse with the same normalized second central moment as the 2-D image of the subparticle. Image processing was also used to separate adjacent particles.
The obtained distribution of particle equivalent radii (mm) has been fitted by a log-normal distribution. The geometric mean and the geometric standard deviation (μG, σG) of the set of measured equivalent radii were (0.16, 2.57), giving a particle equivalent radius of 0.03–0.8 mm, with a (geometric) mean equivalent radius of 0.2 mm.
Acknowledgements
We thank the SLF for access to the Vallée de la Sionne test site. We also thank J. Meyssonnier for helping to take the pictures. The experimental set-up was realized during M. Rastello’s PhD research, under the supervision of C. Ancey and E.J. Hopfinger.


