1. Introduction
Small, cold high-altitude glaciers react sensitively to variations in the surface energy balance. Thin ice (typically 50–100 m) and high accumulation rates (typically 0.2–5 m a−1 w.e.) rapidly advect temperature changes of the firn near the surface into the body of the glacier. Through the temperature dependence of the firn viscosity, deformation rates and thus the flow field are influenced. Even more dramatic changes occur if basal boundary conditions are affected, especially if patches previously frozen to the bedrock become temperate. Under these conditions, basal sliding may alter the flow field. Under certain circumstances, large ice avalanches can be the consequence of reduced stabilization at the glacier base (Reference RöthlisbergerRöthlisberger, 1981, Reference Röthlisberger1987; Reference Margreth and FunkMargreth and Funk, 1999).
Ice cores from several cold Alpine high-altitude glaciers have been investigated in order to reconstruct the climatic history of the past (Reference Oeschger, Schotterer, Stauffer, Haeberli and RothlisbergerOeschger and others, 1978; Reference Schotterer, Oeschger, Wagenbach and MunnichSchotterer and others, 1985; Reference Wagenbach, Munnich, Schotterer and OeschgerWagenbach and others, 1988; Reference De Angelis and Gaudichetde Angelis and Gaudichet, 1991; Reference Doscher, Gäggeler, Schotterer and SchwikowskiDöscher and others, 1996; Reference Vincent, Vallon, Pinglot, Funk and ReynaudVincent and others, 1997; Reference Schwikowski, Döscher, Gäggeler and SchottererSchwikowski and others, 1999a, Reference Schwikowski, Brütsch, Gäggeler and Schottererb). The interpretation of the information obtained from these cores relies on the assumption that ice temperatures were cold throughout the period investigated. Detailed modelling of the heat flow and the ice advection provide the required information. Moreover, such models provide an independent dating of the ice cores, based on the modelled ice flow only.
The analysis of heat-flow processes in high-altitude glaciers is complicated by several factors, each of which requires careful treatment:
The complex surface and bedrock geometries of the glacier induce complex ice-flow patterns.
The thermal and mechanical properties of firn depend strongly on firn density.
Surface boundary conditions vary strongly with topography (shading, surface inclination and altitude). Typically these boundary conditions are poorly determined and must be estimated.
The mountain topography leads to non-vertical heat fluxes in the bedrock, especially near mountain tops and free rock faces.
A seasonal snow cover of rock faces further complicates the treatment.
The long-term temperature history affects the heat fluxes at depth.
Permafrost conditions prevail within the upper parts of the mountains. Phase transitions due to thawing and freezing water at the permafrost boundaries cannot be neglected in transient calculations.
Most of the problems outlined above have been individually addressed in previous studies. In this paper we demonstrate the application of numerical models to the joint solution of the heat advection-diffusion problem including effects of latent heat. The calculation of the velocity field and the density distribution within the glacier is achieved with a flow model including firn deformation and firn compaction. Except for the precise boundary conditions, all problems are physically correctly addressed. As an application of the models, recent temperature records in two boreholes to the bedrock on Colle Gnifetti, Monte Rosa, Swiss Alps, are discussed.
2. Heat Flux in Mountains
Glaciers located on mountains with pronounced topographic relief are subject to the influence of a spatially varying, non-vertical heat flux at the glacier base. These variations of heat fluxes are a consequence of the often complicated temperature distribution within the mountain, which is caused by the strong variation of boundary conditions in both space and time. The rock-face exposure, seasonal shading effects and a varying snow cover contribute to this pattern. Only at very large depths (several kilometres) are the geothermal heat fluxes unaffected by the mountain topography. In contrast, temperature gradients are mainly perpendicular to the surface near mountain faces.
The temperature field and associated heat fluxes in a mountain ridge have been investigated in detail, revealing the above-mentioned influences as well as the importance of phase transitions of vein water in the rock near the surface (Reference Wegmann, Gudmundsson and HaeberliWegmann and others, 1998). In a modelling study of a ridge with two faces of different exposure (north and south), predominantly horizontal heat fluxes have been obtained. Snow patches and glaciers further complicate this heat-flow pattern as they often act as a heat source (through refreezing meltwater) in an otherwise cold mountain face.
It is well established that temperatures at depth are a consequence of the temperature history over thousands of years. In addition to the well-known process of heat diffusion, the possibility of phase transitions at the permafrost boundaries must be considered. Assuming a moisture content of several per cent, the transient degradation of permafrost consumes an important part of the geothermal heat flux (Reference Wegmann, Gudmundsson and HaeberliWegmann and others, 1998). Inversely, a cooling condition causes additional water to freeze, thus releasing heat and adding to the geothermal heat flux.
3. Field Equations
The quantitative analysis of the processes outlined in the introductory section of this paper requires the solution of a coupled system of equations for the balances of mass, linear momentum and energy. The mathematical formulation of the slow flow of an isotropic, viscous, compressible, heat-conducting fluid (i.e. firn) is formulated in the Eulerian description and reads (Reference MalvernMalvern, 1969; Reference HutterHutter, 1983)

Here ρ is the density, v is the velocity vector, σ is the stress tensor, g is the gravitational body force,
![]() is the strain-rate tensor and C is the heat capacity The acceleration term is omitted in Equation (1b), which may be established with a scaling argument (Reference HutterHutter, 1983). The Fourier law of heat conduction q = −k∇T has been used, where k is the thermal conductivity. Heat sources are the dissipative heat production
is the strain-rate tensor and C is the heat capacity The acceleration term is omitted in Equation (1b), which may be established with a scaling argument (Reference HutterHutter, 1983). The Fourier law of heat conduction q = −k∇T has been used, where k is the thermal conductivity. Heat sources are the dissipative heat production
![]() during deformation and the release of latent heat Q
f during freezing. It is assumed that no moisture transport occurs. The equation system is closed by a constitutive equation for the firn, relating the stress tensor to the strain-rate tensor.
during deformation and the release of latent heat Q
f during freezing. It is assumed that no moisture transport occurs. The equation system is closed by a constitutive equation for the firn, relating the stress tensor to the strain-rate tensor.
The equation system (1) is coupled through temperature and density. The evolution of these quantities is given by Equations (1a) and (1c), and they appear as state variables in the constitutive Equation (3). Moreover, the thermal conductivity k is strongly dependent on density and, to a lesser extent, on temperature.
4. Numerical Solution
The solution of Equations (1) for a given geometry requires numerical analysis. Since the glacier-flow and the heat-diffusion processes are interdependent, a coupled mechanical and thermal analysis is needed. This coupling is achieved with independent finite-element models for firn densification, glacier flow and heat flow (Equations (1a–c), respectively).
A steady-state solution of Equations (1a) and (1b) for given firn temperatures has been calculated with coupled models of glacier flow and firn densification in three dimensions (Reference Lüthi and FunkLüthi and Funk, 2000). The coupling of both models has been achieved with a fixed-point iteration. The prescribed firn temperatures were interpolated from the measured borehole temperatures. Resulting firn densities closely match the densities measured on ice cores.
In this paper we discuss the transient solution of Equations (1b) and (1c) along a flowline. The firn densities are taken from the three-dimensional model discussed above (Reference Lüthi and FunkLüthi and Funk, 2000) and are assumed constant with time. The ice-flow model depends on the temperature field calculated with the heat-flow model, which on the other hand requires output quantities from the flow model such as the ice velocity and the dissipative heat production. This coupling is again achieved through iterative use of both models.
4.1. Glacier-flow model
The glacier-flow model is based on a flow law of firn. This flow law includes the firn compressibility as well as the density-dependent variation of firn viscosity. The flow law is formulated in terms of an isotropic, viscous, compressible fluid, where effective viscosities are dependent on the stress state and on temperature and density as scalar state variables. In the limit of full density this constitutive equation should take the form of a power-law fluid (i.e. Glen’s flow law).
Denoting the stress tensor by σij
, the mean stress is
![]() and the stress deviator tensor is
and the stress deviator tensor is
![]() . Glen’s flow law is written as
. Glen’s flow law is written as
where A
0 and n are flow-law parameters and the effective shear stress is defined by
![]() . It is assumed that the temperature dependence may be separated into a multiplicative factor B(T).
. It is assumed that the temperature dependence may be separated into a multiplicative factor B(T).
The flow law for firn extends Equation (2) to include a compressible part proportional to σ
m (Reference Sofronis and McMeekingSofronis and McMeeking, 1992; Reference CocksCocks, 1994; Reference Duva and CrowDuva and Crow, 1994). Two parameters a(D) and b(D) describing the influence of the relative firn density D = ρ/ρ
ice (where ρ
ice = 917 kg m−3) are introduced. The strain rates
![]() depend on the stress deviator tensor
depend on the stress deviator tensor
![]() and the mean stress σ
m according to the relation
and the mean stress σ
m according to the relation

where the stress invariant σD is defined as
In the limit of full density (D → 1) the contribution of the compressible part must vanish so that Glen’s flow law is recovered. These requirements restrain the limiting behaviour of the parameters to
The detailed form of this parameterization for firn has been given by Reference Gagliardini and MeyssonnierGagliardini and Meyssonnier (1997). This flow law has been implemented in the finite-element code MARC (MARC, 1997; Reference Lüthi and FunkLüthi and Funk, 2000). Eight-node isoparametric quadratic elements with Galerkin weighting have been used in the two-dimensional streamline model discussed in this paper.
4.2. Heat-flow model
Steady-state and transient situations are modelled with the heat-transfer code of MARC, which includes a streamline-upwind Petrov–Galerkin (SUPG) weighting (Reference Zienkiewicz and TaylorZienkiewicz and Taylor, 1989; MARC, 1997). Eight-node isoparametric quadratic heat-transfer elements are used. Required input quantities such as the velocity field and internal heat sources are provided by the mechanical analysis.
4.3. Latent heat
Freezing and thawing of moisture with production or consumption of latent heat are important effects which must be taken into account. The treatment of the phase transition requires exact location of the phase boundary surface and application of an additional internal boundary condition. This approach has been worked out successfully for the finite-difference method (Reference Funk, Echelmeyer and IkenFunk and others, 1994). However, the application of this approach within the finite-element method would require the extensive use of remeshing in order to match the transition surface with element boundaries. An alternative, simple continuum approximation has been used in the heat-flow model, which can readily be used within the finite-element method.
We assume that the phase transition occurs within a temperature interval between the (colder) solidus temperature T s and the (warmer) liquidus temperature T 1. The amount of heat released during freezing then is
where L is the latent heat of freezing, C i and C w are the heat capacities of ice and water, respectively (in J kg K−1), and we assume that the amount of freezing water varies linearly with temperature. Thus we arrive at an effective heat capacity during freezing of
The volumetric heat capacity c = ρC (in J m−3 K−1) of rock with a moisture content w (volume fraction) is then given by

This approximate approach is physically justified if the phase-transition surface is located within the bedrock (as in the present study). Due to the capillary nature of the rock veins and cracks, the phase transition does not occur at a single temperature but in a temperature interval of about 0.3 K (Reference Wegmann, Gudmundsson and HaeberliWegmann and others, 1998). A similar argument has been put forward for glacier ice (Reference LliboutryLliboutry, 1993).
5. A Case-Study of Colle Gnifetti
The methods outlined in the previous sections are used to interpret temperature measurements from two boreholes on Colle Gnifetti. Colle Gnifetti is the uppermost part of the accumulation area of Grenzgletscher, forming a saddle between Zumsteinspitze and Punta Gnifetti of Monte Rosa, at 4400–4550 m a.s.l. The ice flows from both peaks to the main outflow of Grenzgletscher, or breaks off over a steep ice cliff on its northeastern margin (Fig. 1). Measured accumulation rates are 0.2–1.1 m a−1 w.e., with very strong spatial and temporal variations due to the wind-exposed location. The glacier is located between the recrystallization–infiltration zone and the cold infiltration zone (Reference Alean, Haeberli and SchädlerAlean and others, 1984). Meltwater produced occasionally by intense solar radiation at elevated air temperatures refreezes some centimetres below the surface. Measured ice temperatures never exceed the range between −9° and −14°C (Reference Oeschger, Schotterer, Stauffer, Haeberli and RothlisbergerOeschger and others, 1978; Reference Alean, Haeberli and SchädlerAlean and others, 1984; Reference Haeberli and FunkHaeberli and Funk, 1991; Reference LüthiLüthi, 1999).
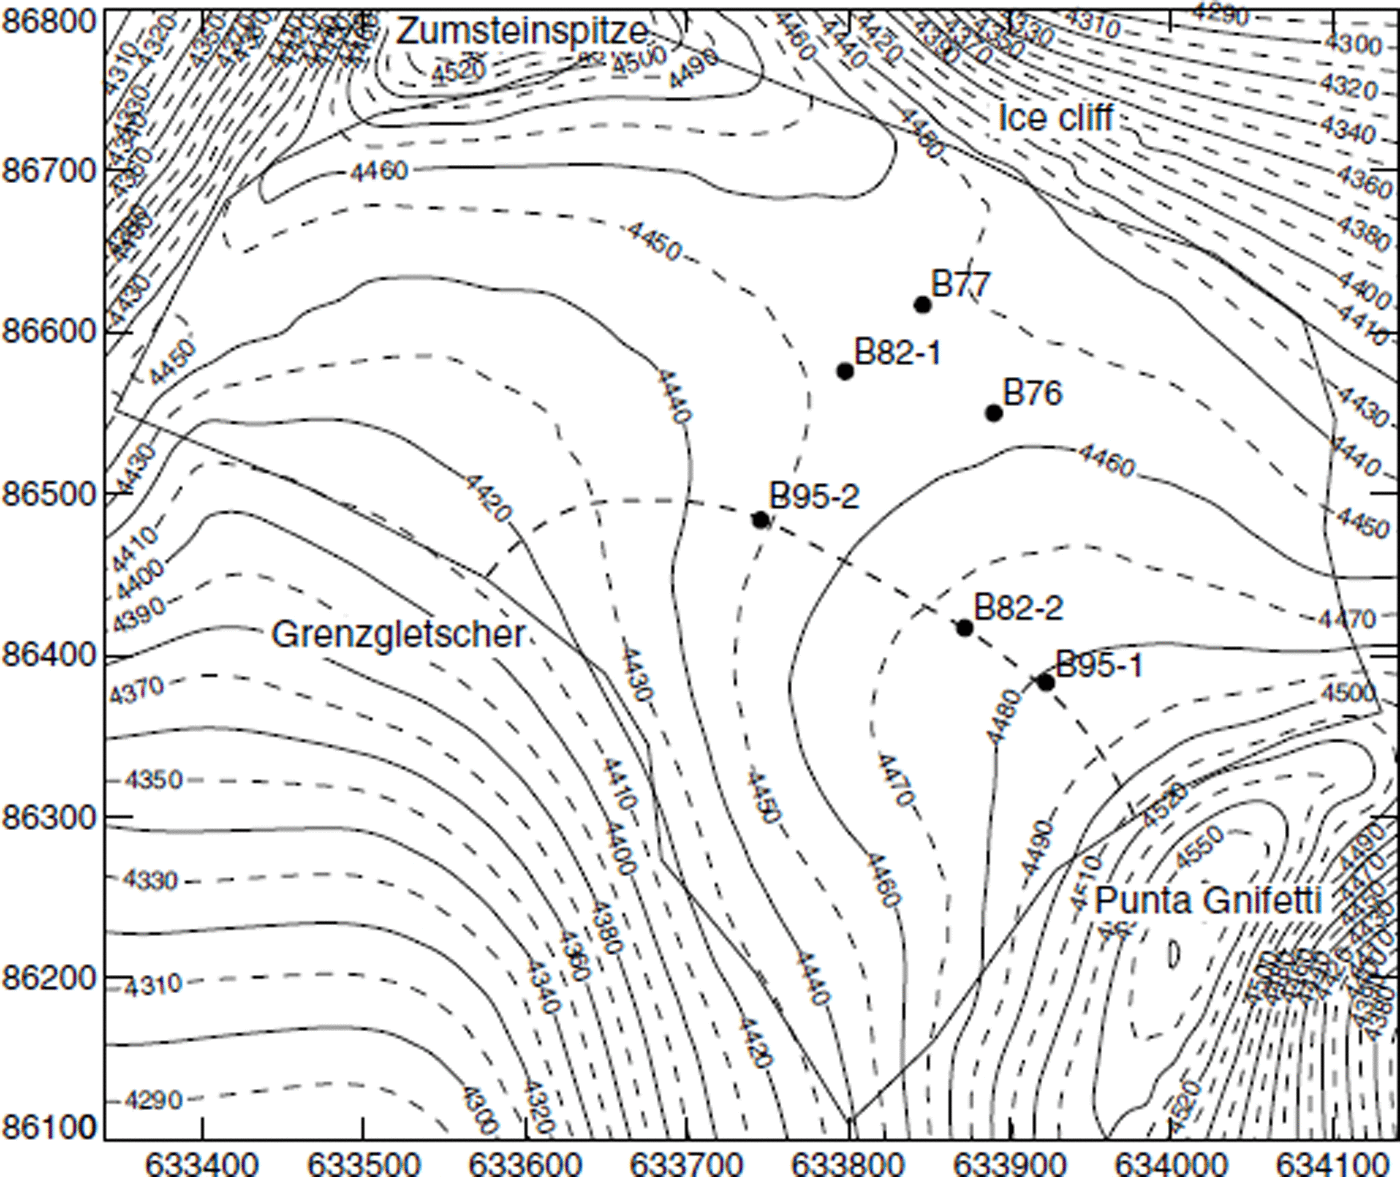
Fig. 1. Surface elevation map of Colle Gnifetti. The thick line indicates the border of the three-dimensional model, and points mark the drill sites. Boreholes reached near bedrock at depths of 124 m (B82-1), 66 m (B82-2), 61 m (B95-1) and 101 m (B95-2). Boreholes B76 (33 m) and B77 (55 and 65 m) stopped far above bedrock. Coordinates are in meters and correspond to the official Swiss coordinate system; contour lines indicate the altitude above sea level. The location of the flowline model is marked with a thick dashed line.
A basal temperature of −12.3°C and a temperature gradient of 19 mK m−1 were measured in the 120 m deep borehole B82-1 (located in the saddle center; Fig. 1) in 1982. The temperature profile from this borehole closely matched a modelled steady-state temperature profile (Reference Haeberli and FunkHaeberli and Funk, 1991). Contrary to observations in the Arctic, no influence of the warming since the beginning of the 20th century was discernible. This observation will be further investigated in section 6.4.
Firn temperatures measured in shallow (2 m) holes vary up to 6°C within 400 m horizontal distance (Reference Alean, Haeberli and SchädlerAlean and others, 1984). Only a small variation of the firn temperature was observed within the north-exposed slope between Punta Gnifetti and the saddle center. In contrast, near-surface firn temperatures substantially increased on the south-exposed slope towards Zumsteinspitze (Reference Haeberli and AleanHaeberli and Alean, 1985). This is obviously due to enhanced net radiation, which was corroborated by the increased number of melt layers.
5.1. Borehole temperature measurements
In 1996/97, we performed new temperature measurements in two deep boreholes drilled in 1995 by the Universities of Heidelberg and Berne. Five thermistors were installed in the 62 m deep hole B95-1, and seven in the 101 m deep hole B95-2, with a vertical spacing varying from 5 to 20 m (see Fig. 1 for the location of these boreholes).
Thermistors of negative temperature coefficient (NTC) type (Fenwal 197-103LAG-A01) were sealed into nearly fitting aluminium tubes in order to keep the influence of pressure and humidity low. The thermistors were soldered to individual two-conductor cables and were waterproofed by heat-shrink tubing. All thermistors were individually calibrated at seven reference temperatures in the range −17° to 5°C in a bath of a mixture of water and antifreeze. The calibration was performed with connected cables in exactly the same configuration and with the same digital multimeter used in the field. Four reference thermistors, calibrated to an absolute accuracy of 20 mK by the Swiss Federal Office of Metrology, were used to determine the homogeneity and the absolute value of the bath temperature. The accuracy of measured temperatures is better than 50 mK over the temperature range −15° to −10°C encountered in the glacier. Relative temperature changes at a single thermistor may be as accurate as 20 mK.
Thermistors were installed in both boreholes in June 1996, 1 year after completion of the drilling. We therefore assume that borehole temperatures reached an undisturbed state. Four to five readings were taken between June 1996 and October 1997. Borehole temperatures from thermistors installed below the zone of annual variation (below 15 m) are shown in Figure 2. Measured temperatures are between −12.4° and −13.5°C and lie within the range of previous measurements.
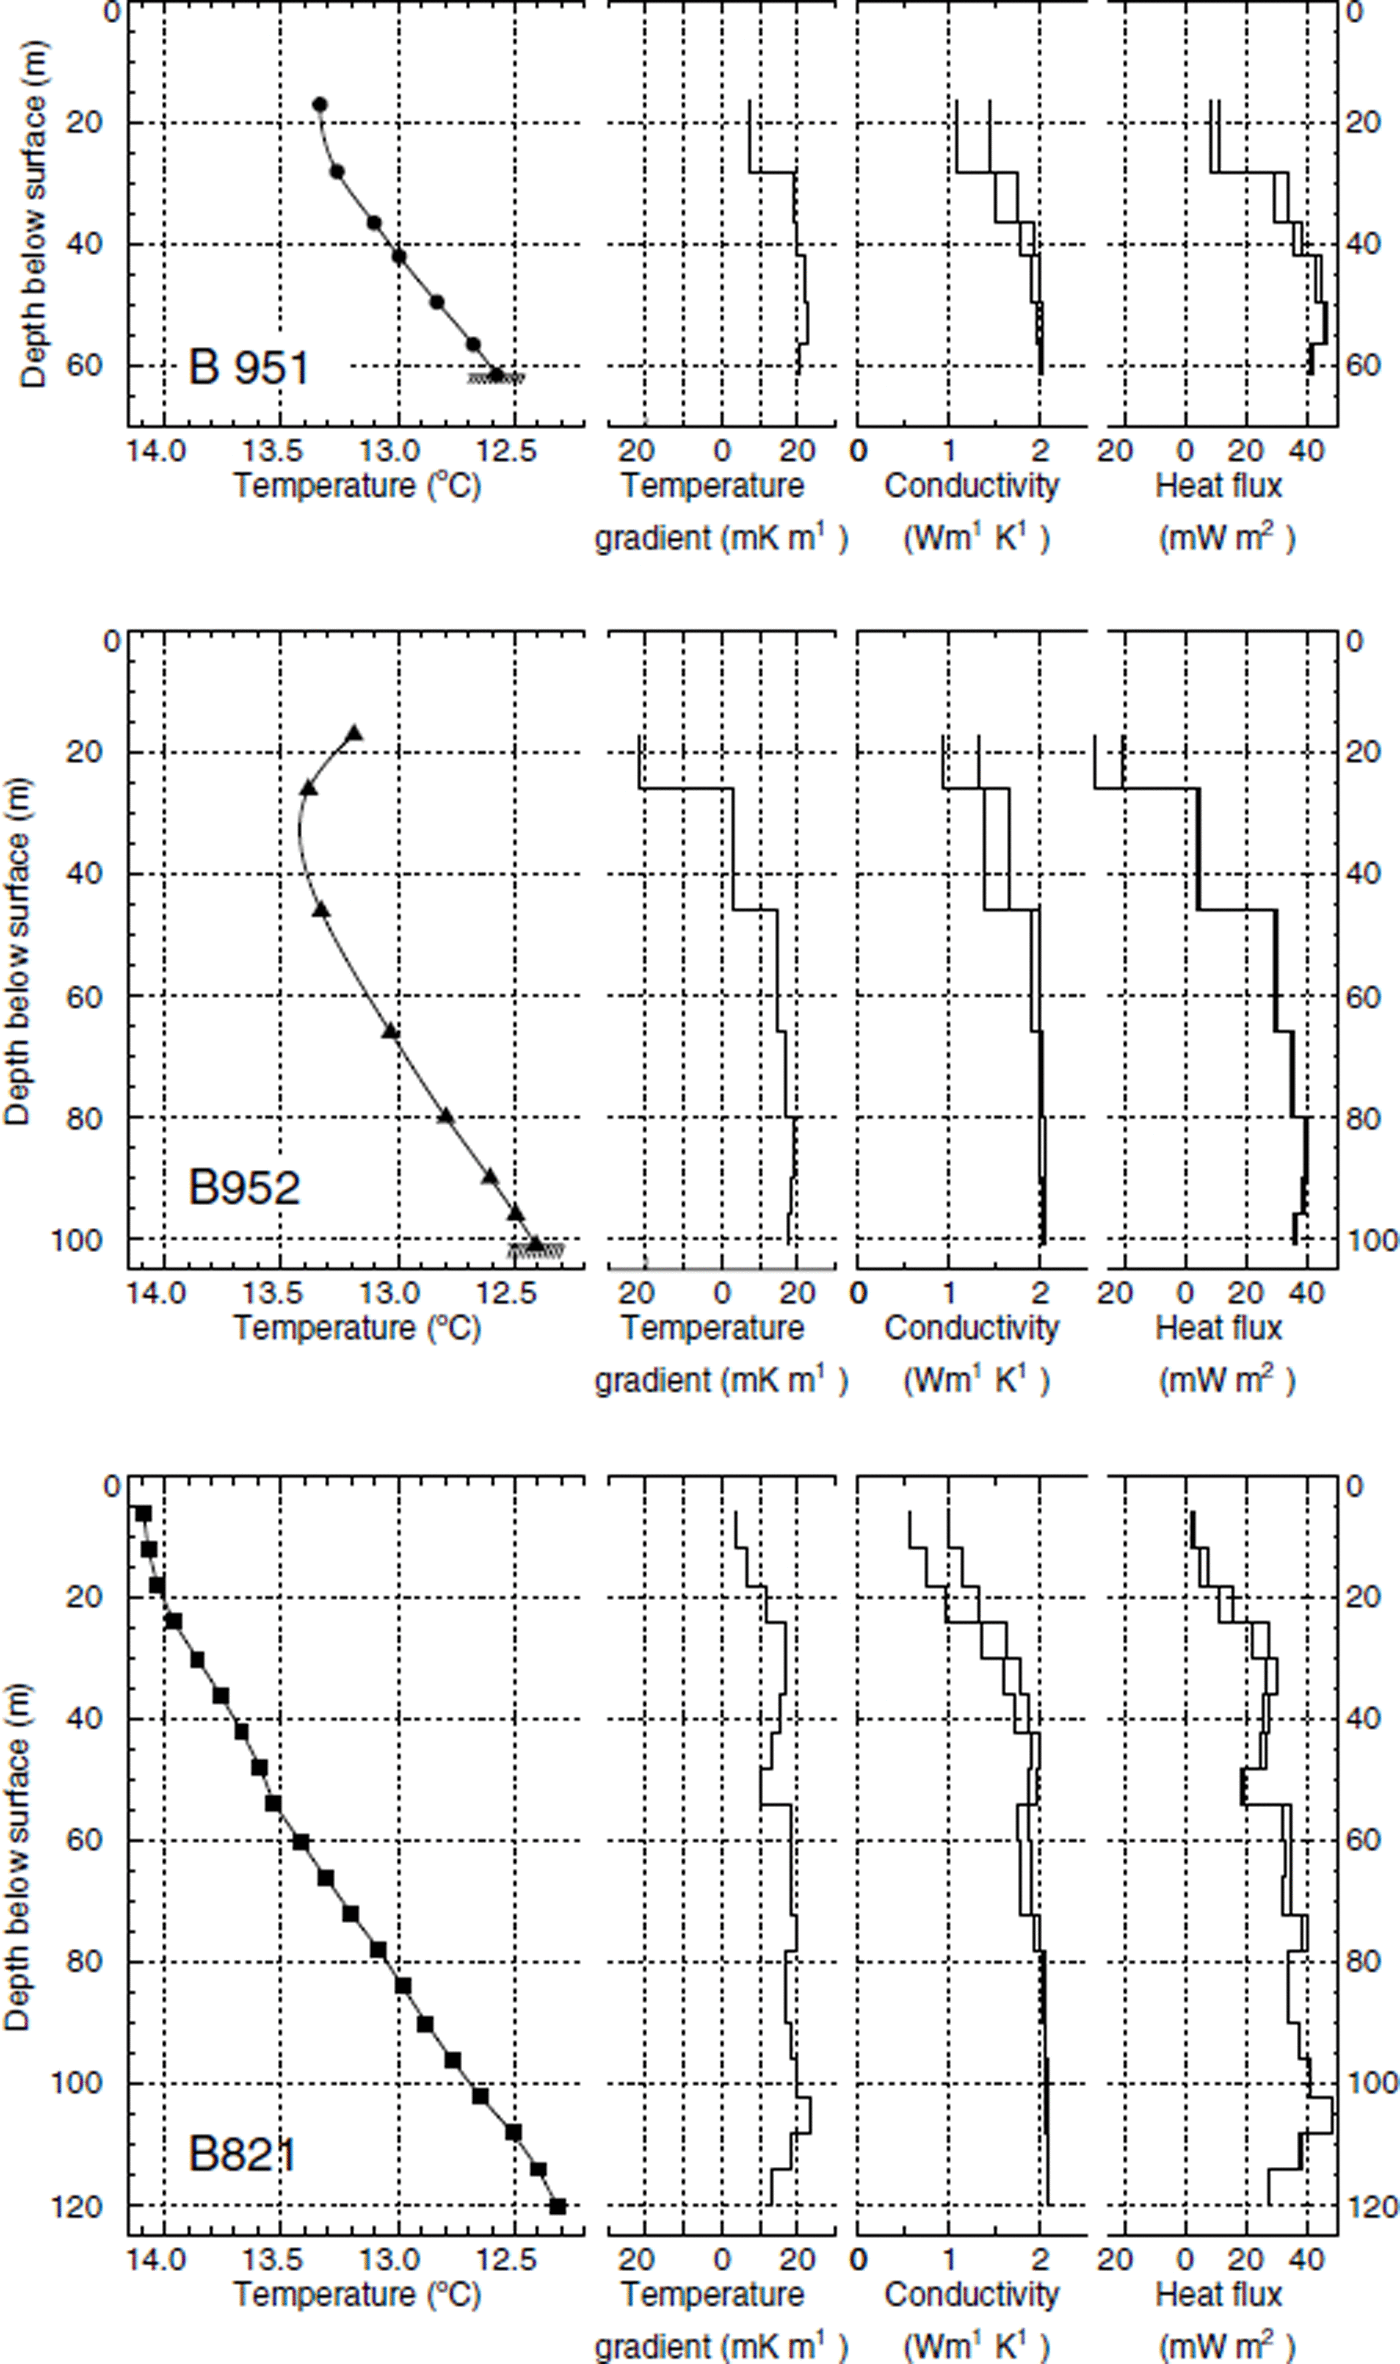
Fig. 2. Temperatures measured in three boreholes on Colle Gnifetti are plotted in the left frames. Temperatures in boreholes B95-1 and B95-2 were measured in 1996/97, and those of B82-1 in 1983 (data for B82-1 from Reference Haeberli and FunkHaeberli and Funk, 1991). Heat fluxes are calculated from measured temperature gradients and the density-dependent thermal conductivities.
A slight warming of most thermistors has been observed, with warming rates of up to 70 mK a−1 at thermistors between 20 and 30 m depth. A possible misinterpretation due to stretching of the thermistor cables during ice motion is improbable and would result in a higher resistivity, and therefore in apparent colder temperatures. A warming of the thermistors should be expected as they move downwards with the firn. An estimate of this effect for the thermistors with the largest warming rates in borehole B95-2 gives warming rates of 4–8 mK a−1, which are considerably smaller than the measured warming rates. The warming of the firn is further corroborated by the striking bend of the temperature profile to warmer temperatures which is clearly visible in borehole B95-2 at 30 m depth (Fig. 2). Such a feature has not been observed in Alpine glaciers before (Reference Haeberli and FunkHaeberli and Funk, 1991).
From these observations we conclude that the measurements indicate a warming of the firn in a non-steady situation. Similar temperature profiles exhibiting a bend towards warmer temperatures were measured some decades ago on White Glacier, Axel Heiberg Island, Canadian Arctic (Reference BlatterBlatter, 1987; Reference Blatter and KappenbergerBlatter and Kappenberger, 1988). The shapes of these temperature profiles have been reproduced with a heat-flow model and a prescribed surface temperature history. We aim at a similar modelling study in this paper, which will take into account the topographic influence of the Monte Rosa massif.
5.2. Temperature gradients and heat fluxes
Temperature gradients from the three deep boreholes are plotted in Figure 2. Both deep boreholes B82-1 and B95-2 in the central saddle area exhibit temperature gradients of 18–19 mK m−1, whereas they reach 22–25 mK m−1 in borehole B95-1. Two boreholes drilled in 1977 (B77) exhibit similar temperature gradients, but they reach only relatively shallow depths of 30 and 50 m, compared to an ice thickness of 120 m (Reference Oeschger, Schotterer, Stauffer, Haeberli and RothlisbergerOeschger and others, 1978).
An inspection of the location of the drill sites (Fig. 1) reveals that boreholes with higher temperature gradients are relatively close to the ice cliff on the northeastern side (boreholes B77-1 and B77-2) or to the steep southwestern face of Monte Rosa (borehole B95-1). Thus the influence of these rock walls, which are exposed to the atmosphere and solar radiation, is clearly manifested in the temperature gradients. Reference WegmannWegmann (1998) showed that irradiated mountain slopes strongly influence the heat fluxes, and therefore the temperature distribution, on a mountain top. The observed temperature gradients are interpreted as reflecting the consequences of this.
Heat fluxes are calculated from the measured temperature gradients using a density-dependent thermal conductivity. Two different relations are used as a lower and upper limit (the relations of Reference Van Dusen and Washburnvan Dusen (1929) and Reference SchwerdtfegerSchwerdtfeger (1963); cf. Appendix). The heat fluxes calculated with these relations, and evaluated with the respective density profiles, are shown in Figure 2. Calculated basal heat fluxes are 35–40 mW m−2 for both saddle boreholes B82-1 and B95-2 and increase to 40–45 mW m−2 for borehole B95-1. Geothermal heat flux is estimated to be roughly 70 mW m−2 at sea level in the Monte Rosa area (Reference Medici and RybachMedici and Rybach, 1995). Such a decrease of the vertical heat flux may be expected, as the temperature field in the upper part of high mountains is strongly influenced by lateral heat fluxes from exposed slopes. This is further investigated in section 6.
5.3. Modelled flow velocities
The flow velocities of Colle Gnifetti have been modelled along a flowline as well as in three dimensions (Reference Lüthi and FunkLüthi and Funk, 2000). For the purpose of this study we concentrate on the two-dimensional flow model along an approximate flow-line, shown in Figure 3. Starting below Punta Gnifetti, it passes through the borehole locations B95-1, B82-2 and B95-2 (thick dashed line in Fig. 1) and ends at the big crevasse in the outflow to Grenzgletscher. The bedrock depth is well known from a radar profile, and surface velocities have been measured at nine stakes.

Fig. 3. Modelled velocityfieldfrom theflowline model. Flags indicate the position of stakes. The measured velocities are indicated with black arrows; modelled velocities are drawn in grey. Mote the unusual shape of the velocity profiles, with an increase of horizontal velocities near the surface, which is an effect of the low viscosity of the firn layer. Temperature profiles were measured in boreholes B95-1 and B95-2, indicated with thick vertical lines.
Ages of chemically dated layers in ice cores, firn-density profiles as well as surface velocities measured at nine stakes on the flowline have been reproduced by the flow model (Reference Lüthi and FunkLüthi and Funk, 2000). While it is clear that a flowline model is a poor approximation in the downstream part of the model geometry where ice flow is largely influenced by the topography in three dimensions, it is likely to be a reasonable approximation of the ice flow in the upper part of the glacier, i.e. upstream of borehole B95-2.
The flow velocities calculated with the flowline model are plotted on several cross-sections in Figure 3. The comparison with velocities measured at nine stakes shows a good agreement in the region between the boreholes. A noteworthy feature is the unusual shape of the velocity profiles, with an increasing horizontal velocity near the surface. This is a consequence of the low viscosity of the firn layer. Substantial deviations occur towards the left model margin because of the curvature of the flowline and undetermined boundary conditions at a large crevasse.
6. Heat-Flow Model
In the present study we concentrate on the principal effects of heat fluxes within a mountain on a small, cold glacier. The model geometry is a two-dimensional cross-section through the Monte Rosa massif including the Colle Gnifetti glacier on the top (the modelled flowline is indicated with a dashed line in Figure 1). The model geometry shown in Figure 4 includes the whole Monte Rosa massif and reaches down to sea level. The grid of the heat-flow model is indicated, and matches that of the mechanical flowline model within the glacier (Fig. 3 and shaded area in Fig. 4; Reference Lüthi and FunkLüthi and Funk, 2000).

Fig. 4. The model geometry and applied boundary conditions of the heat-flow model. Only the uppermost part of the model is shown (the geometry extends down to sea level). The shaded area annotated “Glacier” identifies the glacier flow-model geometry (Fig. 3) and thus the part of the model where advection is operative.
An implementation of a similar model in three dimensions would pose no serious additional difficulties. A glacier-flow model including the firn rheology has been successfully implemented (Reference Lüthi and FunkLüthi and Funk, 2000), and the solution of the heat diffusion–advection equation is a standard capability of most finite-element codes. The main problem is to provide accurate thermal boundary conditions on the glacier surface as well as on the rock walls.
6.1. Thermal conductivities
The specific heat capacity C and the thermal conductivity k of firn are both density-and temperature-dependent and are appropriately parameterized (cf. Appendix). Since it is difficult to determine from the measurements which formula should be preferred, an average conductivity is used.
The thermal properties of the bedrock are not known. Thermal conductivities of gneiss show large variations, mainly due to anisotropy, and are usually in the range 2.5–3.5 Wm−1 K−1 (Reference Clauser, Huenges and AhrensClauser and Huenges, 1995). A thermal conductivity of 3.2 W m−1 K−1 has been measured in frozen, water-saturated samples of gneiss from a high Alpine site (Reference WegmannWegmann, 1998). Since the upper 1000 m (at least) of Monte Rosa are in permafrost conditions, a value of 3.2 W m−1 is adopted throughout this study. The volumetric heat capacity is assumed to be 2063 kJ m−3 K−1 (Reference WegmannWegmann, 1998).
6.2. Boundary conditions
Thermal boundary conditions are not well known for highaltitude glaciers and rock walls. Consequently, simple parameterizations are used in this study. A mean firn surface temperature is used in order to avoid the details of the complex heat- and mass-exchange processes at the firn surface. The mean firn temperature at the glacier surface is set to T surf = −14.1°C (this was also the 10 m firn temperature in the southern part of Colle Gnifetti in 1985 (Reference Haeberli and FunkHaeberli and Funk, 1991)). A decrease in surface temperatures on the steep slope towards Punta Gnifetti is plausible due to reduced solar radiation caused by a shading effect. Hence, a horizontal gradient of the surface firn temperature of −0.02°C m−1 is prescribed from the center between the boreholes (at coordinate 300 m in Figures 3 and 4) in the upstream direction towards the top of Punta Gnifetti. This boundary condition is applied along the edge of the model indicated with T surf in Figure 4. On the south face of Monte Rosa (T south in Fig. 4), parameterized thermal boundary conditions are chosen according to Reference WegmannWegmann (1998, p. 102), namely, a surface temperature depending on altitude z of T south(z) = 13.0°C − (z × 0.0045°C) m−1 (a nearly identical parameterization was given by Reference Rybach and PfisterRybach and Pfister (1994) for the south side of the Alps). No horizontal heat fluxes are admitted on the left boundary and on the lower half of the right boundary of the model geometry (q = 0 in Fig. 4). A vertical heat flux of 70 mW m−2 (Reference Medici and RybachMedici and Rybach, 1995) was initially prescribed at sea level (lower model boundary). As will be shown, this heat flux only leads to reasonable results in a transient model including the effects of latent heat within the bedrock.
6.3. Steady-state solutions
The calculated steady-state temperature profiles are shown in Figure 5. A reasonable agreement with the measured temperatures (section 5.1) is obtained for the lower part of the boreholes. The temperature gradients in the bottom part of both boreholes can only be reproduced by setting the basal heat flux at sea level to a value of q ≤ 20 mW m−2. This surprisingly low value may be an effect of several processes, and therefore must not be taken literally. In fact, the whole complexity of the three-dimensional geometry, the geology, eventual effects of hydraulic active systems and radiative heat sources strongly influence the heat fluxes in the alpine massifs (Reference BusslingerBusslinger, 1998). Additionally, the effects of latent heat must be taken into account near the rock surface and at the permafrost base, which is estimated to be at least 1000 m below the glacier. One might speculate that a thawing permafrost base consumes much of the geothermal heat flux. For the purpose of obtaining reasonable steady-state temperature profiles, the vertical heat flux at sea level has been set to 20 mW m−2 in this and the next subsection. Also the marked bends observed in the upper part of the temperature profiles cannot be explained with the steady-state model. These issues will be further investigated in section 6.4 with a transient heat-flow model.
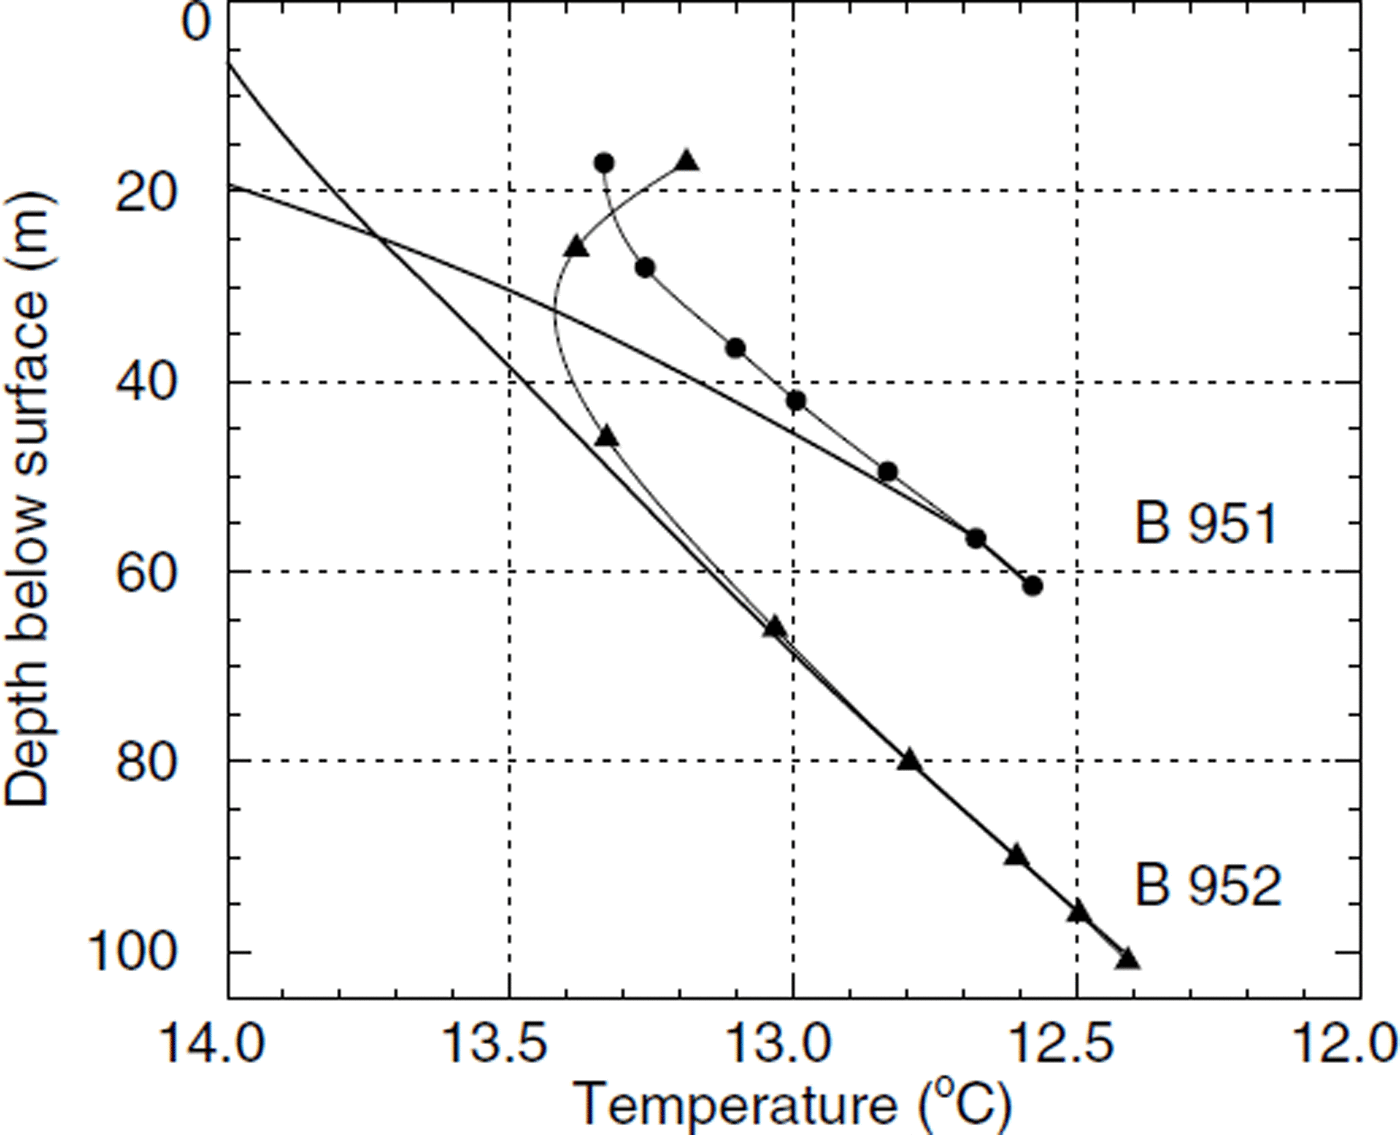
Fig. 5. Modelled steady-state temperature profiles. Note the different curvature of the profiles.
The modelled steady-state temperature profiles show a noteworthy feature. While profile B95-2 is curved in the positive direction, profile B95-1 exhibits the opposite curvature. The fact that steady-state temperature profiles from two neighbouring locations are different in shape demonstrates the need to take into account the horizontal and vertical advection and accurate boundary conditions. Also the heat fluxes at the glacier base differ considerably, as they are affected by the free southeast and northeast faces of Monte Rosa. Borehole B95-1 which is closer to the southeast face shows a temperature gradient which is enhanced by about 25% with respect to borehole B95-2. This feature was already detected in the temperature measurements (Fig. 2).
6.4. Transient solutions
All surface temperatures (T surf (t) and T south(t) in Fig. 4) are varied according to the difference of mean annual air temperature with respect to the secular mean temperature (Fig. 6). This relies on the assumption that the processes of heat exchange at the surface show the same variation with time as the monthly mean air temperature. Measured temperatures since 1850 from the nearby Grand St Bernard meteorological station (2479 m a.s.l., some 50 km apart) are used (data from SMA (1864–1999) and Schuepp (1961), doubly smoothed with a 9 year running mean). Starting with a steady state in the year 800 and including the medieval climatic optimum and the Little Ice Age, this is a rough approximation to the reconstructed temperature history (Reference Von Rudloff, Oeschger, Messerli and Svilarvon Rudloff, 1980).
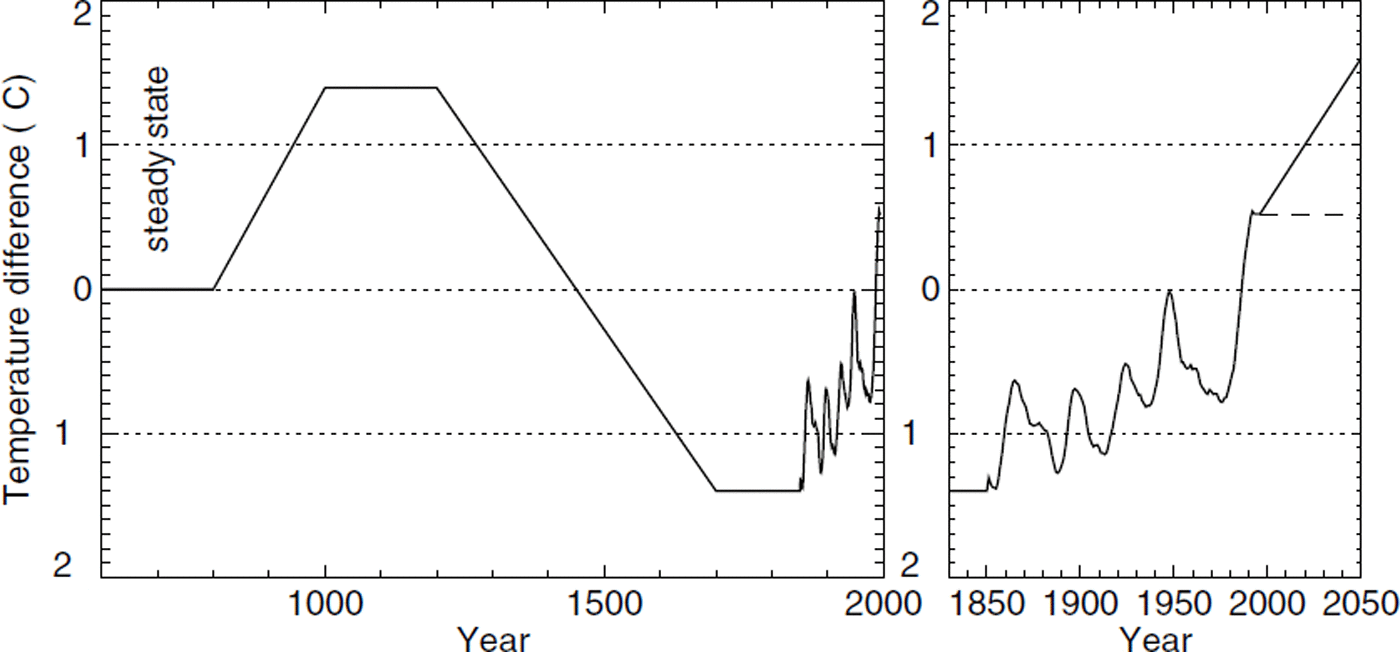
Fig. 6. The surface temperature variation prescribed in the transient model runs. The temperature curve is doubly smoothed over a 9 year period. Steady conditions are assumed for the time prior to the year 800. The right panel shows a close-up of the last part of the prescribed history and two future scenarios: steady temperatures (dashedline) or a linear increase of 1°C during the next 50 years (solid line).
Results from the transient model runs are shown in Figure 7. Avery good agreement with measurements is obtained for the curvature of profile B95-2 as well as for the heat fluxes at the glacier base. Modelled temperatures are too low by 0.2°C in the upper part of borehole B95-1. This discrepancy could in principle be accounted for with an appropriate parameterization of surface temperatures upstream of the borehole. We feel that such a matching procedure is of little significance, and therefore prefer a simple parameterization of the surface temperature.
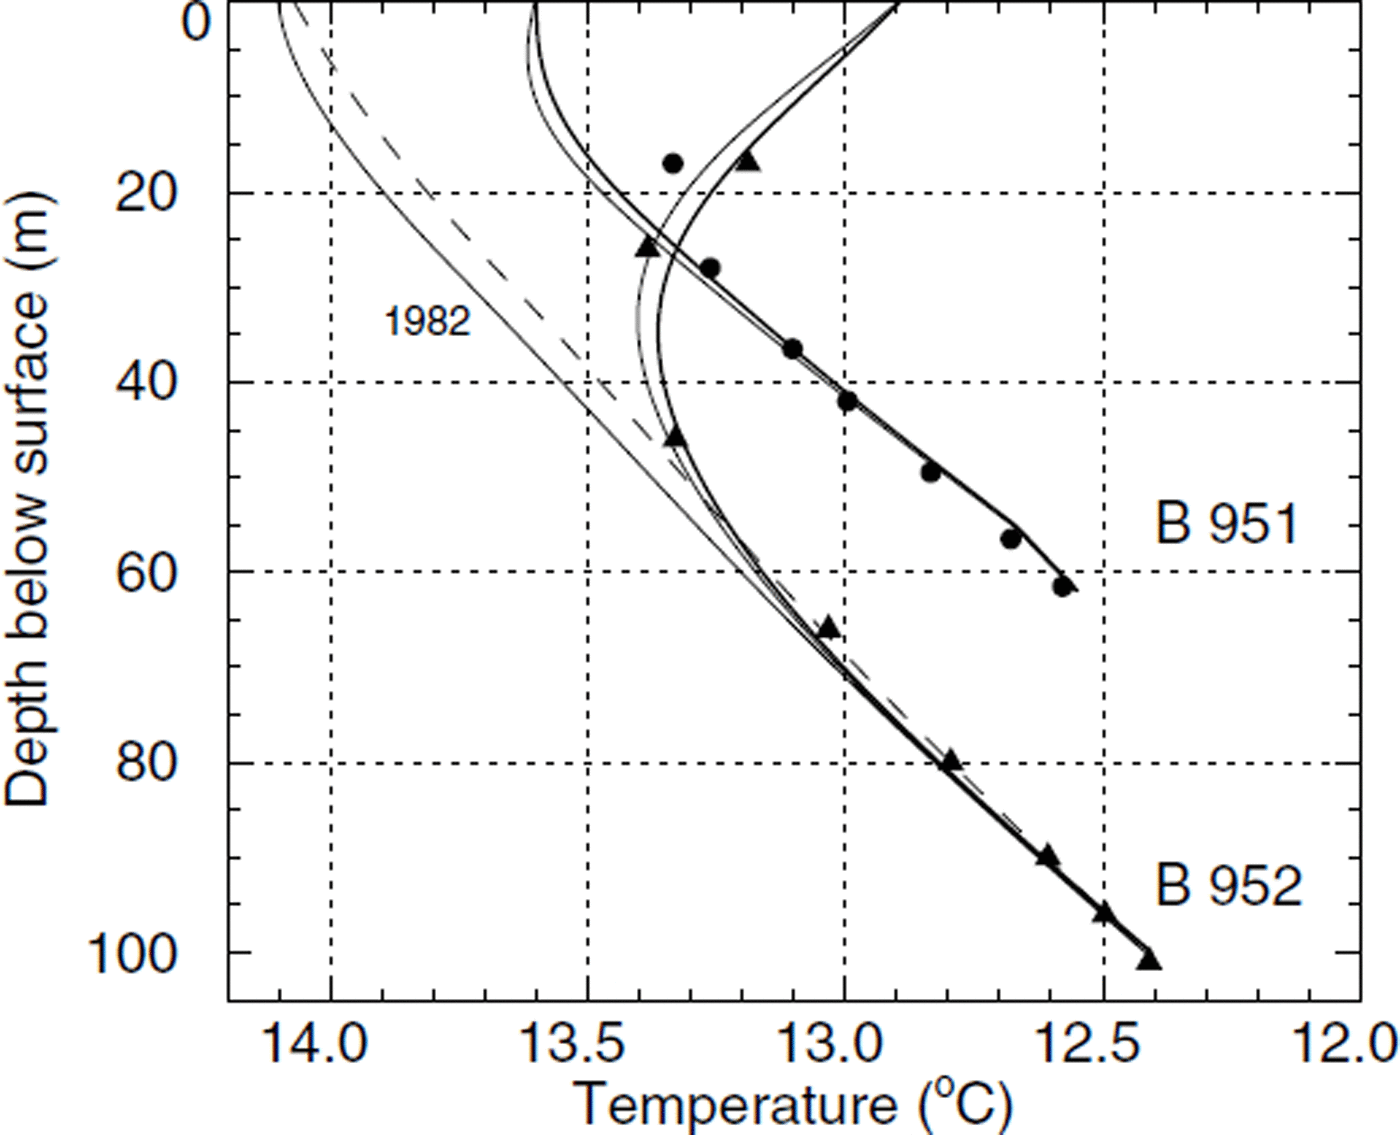
Fig. 7. Modelled englacial temperatures in 1997 (thick solid line) from the transient model are compared to measured temperatures (dots and triangles). Thin solid lines indicate the modelled temperatures in 1996. The 1982 temperature profile is similar to a steady-state profile (dashed line, same as in Fig. 5).
With a prescribed constant surface temperature of T surf = −13.7°C, the temperature profile in borehole B95-2 is captured exactly, while the temperatures of B95-1 are too high by about 0.6°C. The results shown in Figure 7 were obtained with a horizontal temperature gradient of −0.005°C m upstream of the center between the boreholes (i.e. starting at 300 m in the model geometry of Figures 3 and 4).
6.5. Effects of latent heat
A suspiciously low vertical heat flux at sea level had to be set as boundary condition of the heat-flow model, in order to reproduce the temperature gradients measured at the base of the glacier. It was speculated in section 6.3 that this could be an effect of latent heat consumed by thawing permafrost. An investigation of the importance of latent heat requires the modelling of a very long time-span in order to obtain the appropriate transient response. Starting the model run at steady conditions some 1200 years ago (as in section 6.4) cannot reproduce the effects of permafrost degradation, since a temperature change at the surface penetrates only some 100 m during this period. Therefore starting with a steady state, the surface temperature history for the last 20 000 years was prescribed (Reference Von Rudloff, Oeschger, Messerli and Svilarvon Rudloff, 1980). The vertical heat flux at sea level was set to its initial value (section 6.2) of 70 mW m−2 (Reference Medici and RybachMedici and Rybach, 1995). A moisture content of 3% (volume fraction) throughout the rock was taken as a reasonable value to investigate the principal effects (Reference WegmannWegmann, 1998).
The modelled temperature distribution within the mountain in 1997 is shown in Figure 8. The influence of the southeastern face (right model boundary) on the temperature distribution results in dipping contour lines. Near-vertical contour lines indicate high lateral heat fluxes near the top of the mountain. The time evolution of temperature and vertical heat flux are plotted in Figure 9 for a vertical profile (indicated with an arrow in Fig. 8). A kink in the 1997 temperature profile is visible in Figure 9a at the calculated permafrost base. The vertical heat flux within the mountain diminishes from 70 mW m−2 at sea level to 20 mW m−2 in the permafrost zone above 2900 m a.s.l. (Fig. 9b). This is due to the thawing permafrost base which consumes a large fraction of the geothermal heat flux. The effect of the mountain topography alone can be inferred from Figure 9d which shows model results obtained for dry rock. Due to the absence of the phase transition, the minimum heat fluxes occur at a higher altitude of 3700 m a.s.l. Above this altitude, both temperature and heat-flux profiles are similar and mainly affected by the mountain topography and the applied boundary conditions. Based on the measurements, it is impossible to decide on the importance of the latent-heat effects. In any case, the low vertical heat flux is the result of the paleoclimatic evolution.
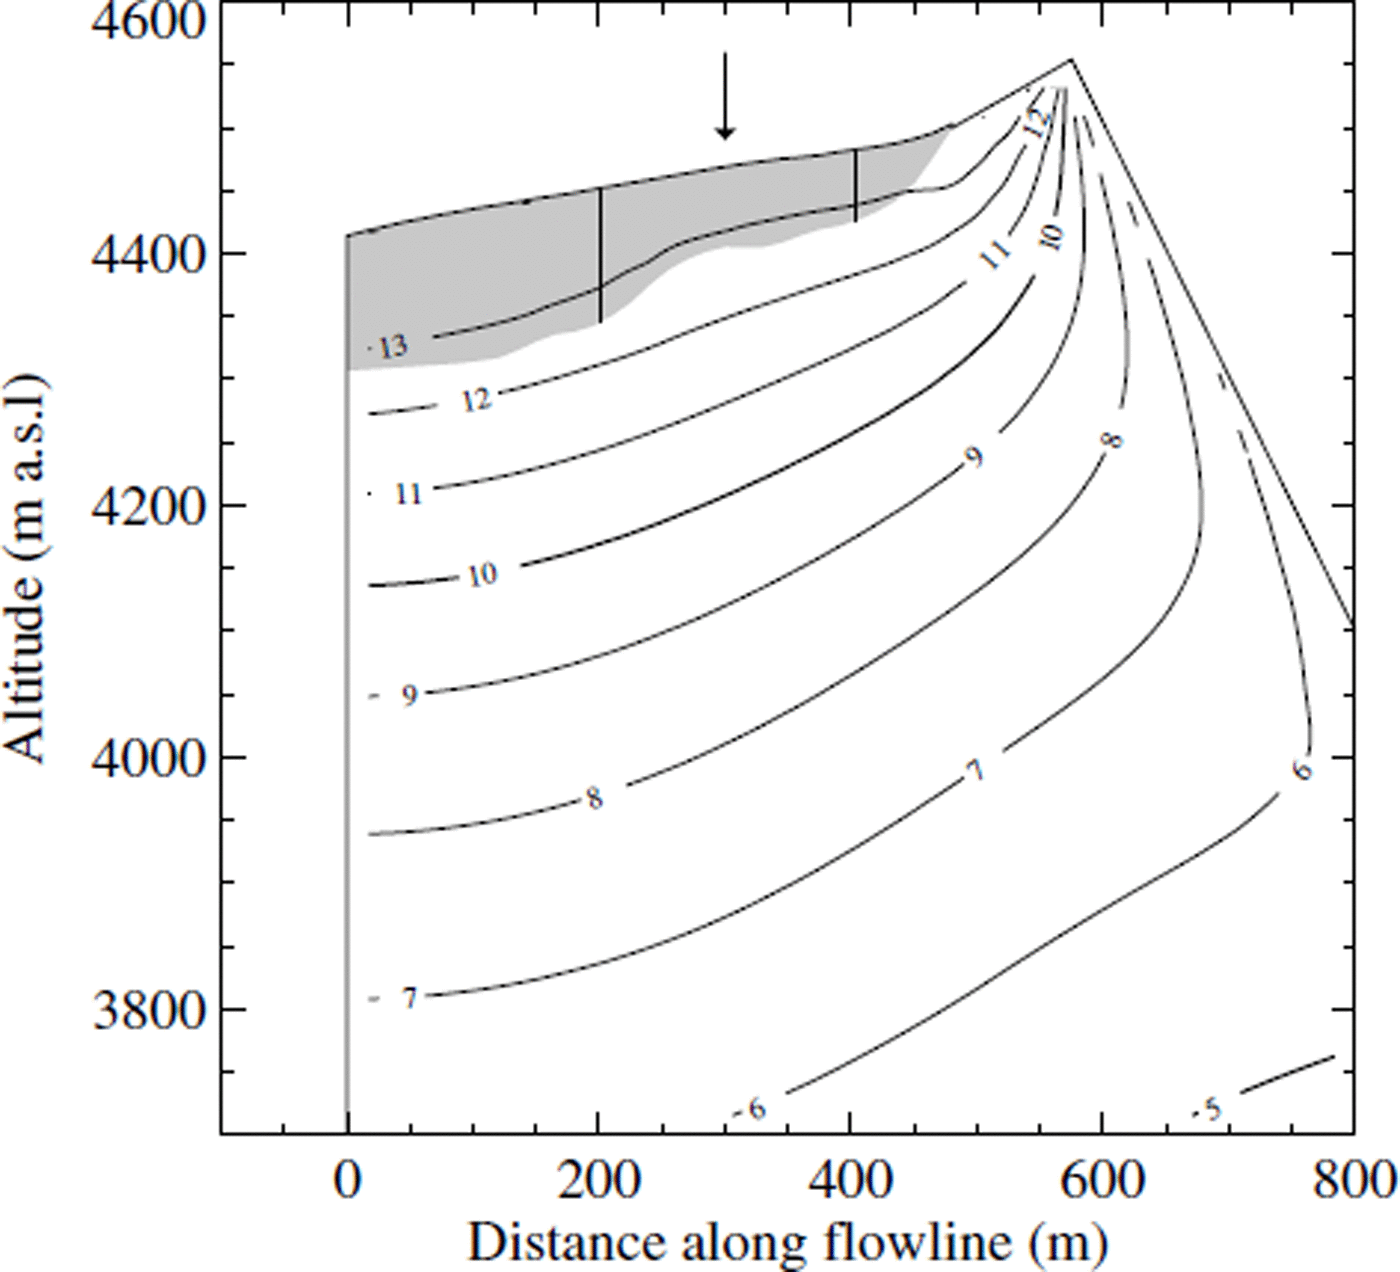
Fig. 8. Contour lines of modelled temperatures in 1997 from the transient model including the effects of latent heat. The glacier geometry is indicated by a shaded area. The arrow indicates the location of the profiles plotted in Figure 9.
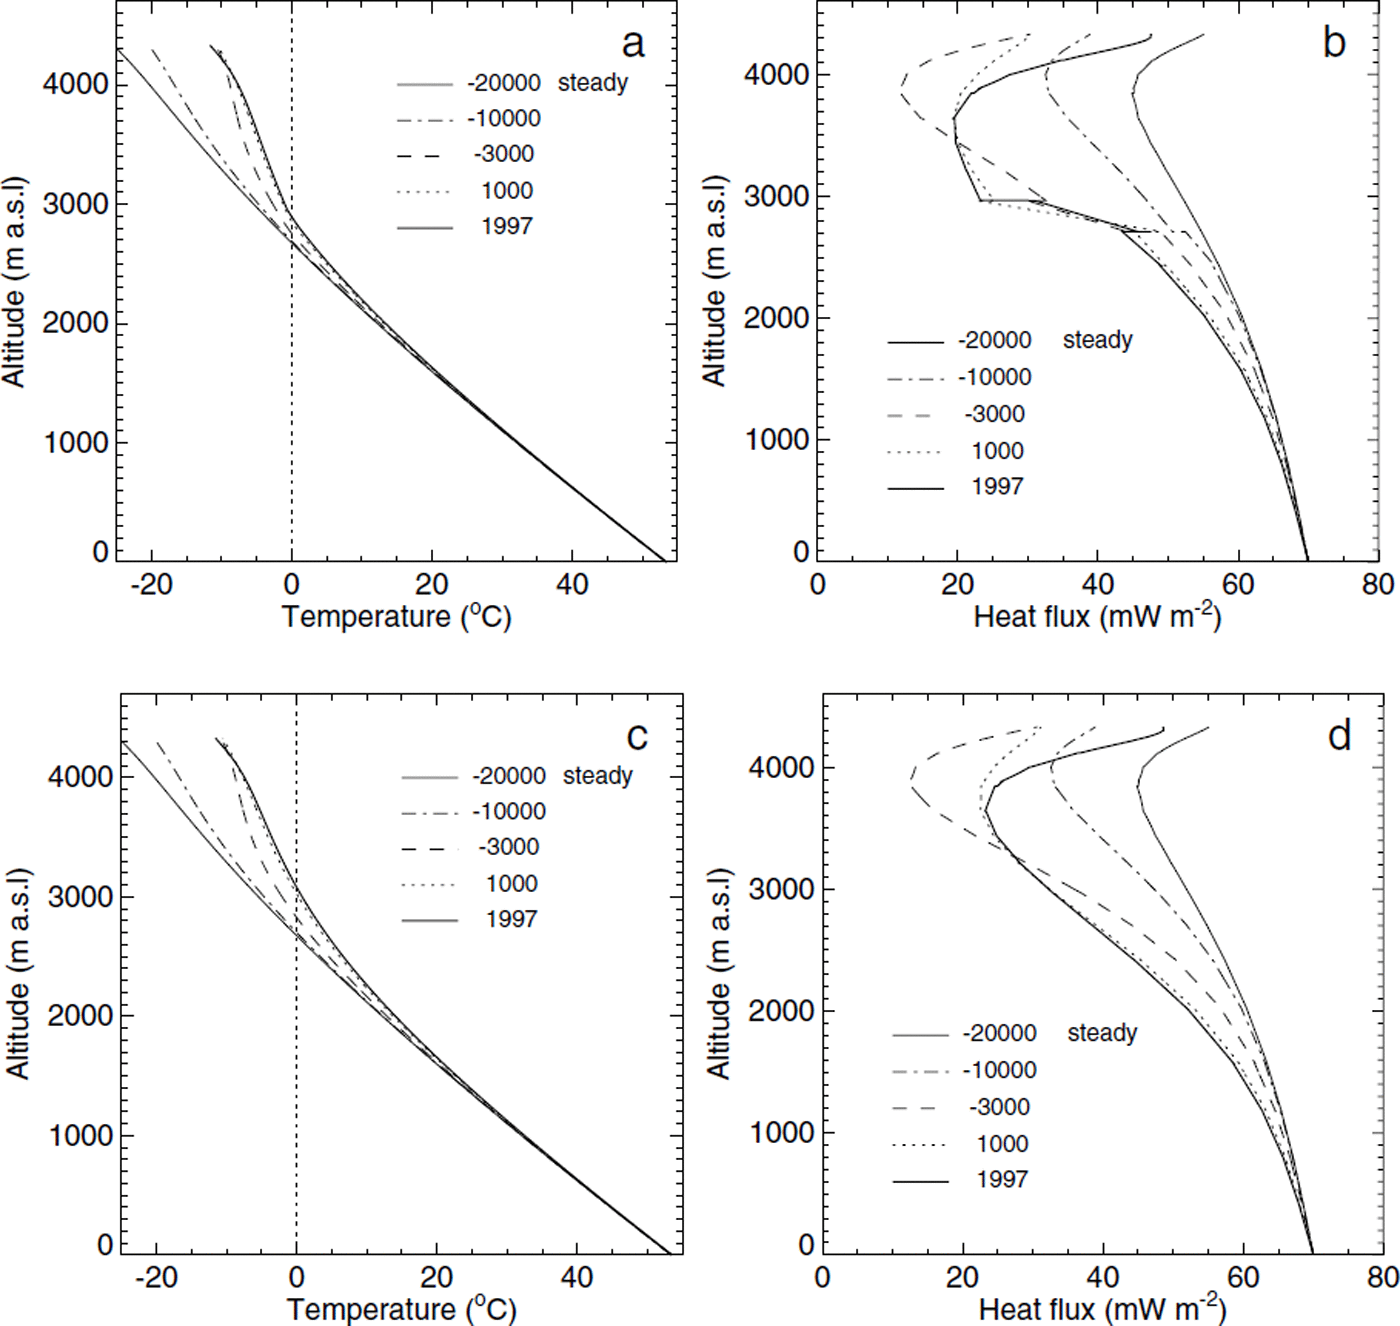
Fig. 9. Profiles of temperature and heat flux taken at the horizontal coordinate 300 m (indicated with an arrow in Fig 8). (a) Modelled temperatures from the transient model including the effects of latent heat at five different times. (b) The modelled vertical heat flux strongly decreases at an altitude of 2900 m due to a thawing permafrost base. (c, d) Modelled temperature and vertical heat flux for dry rock (without phase transition).
6.6. Discussion of model results
The transient heat-flow model is capable of reproducing measured temperature profiles and warming rates in two boreholes on Colle Gnifetti. It has been shown that the measured temperature profiles cannot be obtained with the assumption of a steady state (except perhaps for a strange variation of prescribed surface temperatures). Both borehole temperature profiles exhibit the warming trend observed at the Grand St Bernard meteorological station. This is mainly caused by the exceptionally high temperatures prevailing since 1980 (Fig. 6). A comparison of the modelled temperature profiles in Figure 7 shows that they were close to a steady-state profile in 1982. This was also the conclusion of a modelling study (Reference Haeberli and FunkHaeberli and Funk, 1991) in which the temperatures measured in 1983 in borehole B82-1 were interpreted. The bend in the profile evolved only in the last decade and could not be observed before.
In Figure 10 the time evolution of modelled englacial temperatures at four depths is shown. An important result for the interpretation of the ice cores is that the firn temperatures never exceeded −11°C in the past. Temperature gradients were “normal” (i.e. the surface always exhibits the coldest temperatures) during most of the history. Even at warming rates of 1°C per century the borehole temperature profiles show no inversion. Only for extremely fast and large temperature increases is a slight inversion observed in borehole B95-2 in 1865 and 1950. The strongest warming occurred during the last 15 years, with a surface temperature increase of 1.3°C. Consequently the inversion of the temperature profile encountered in Figure 7 is a very recent effect and is likely to fade away in the near future if the warming trend ceases.
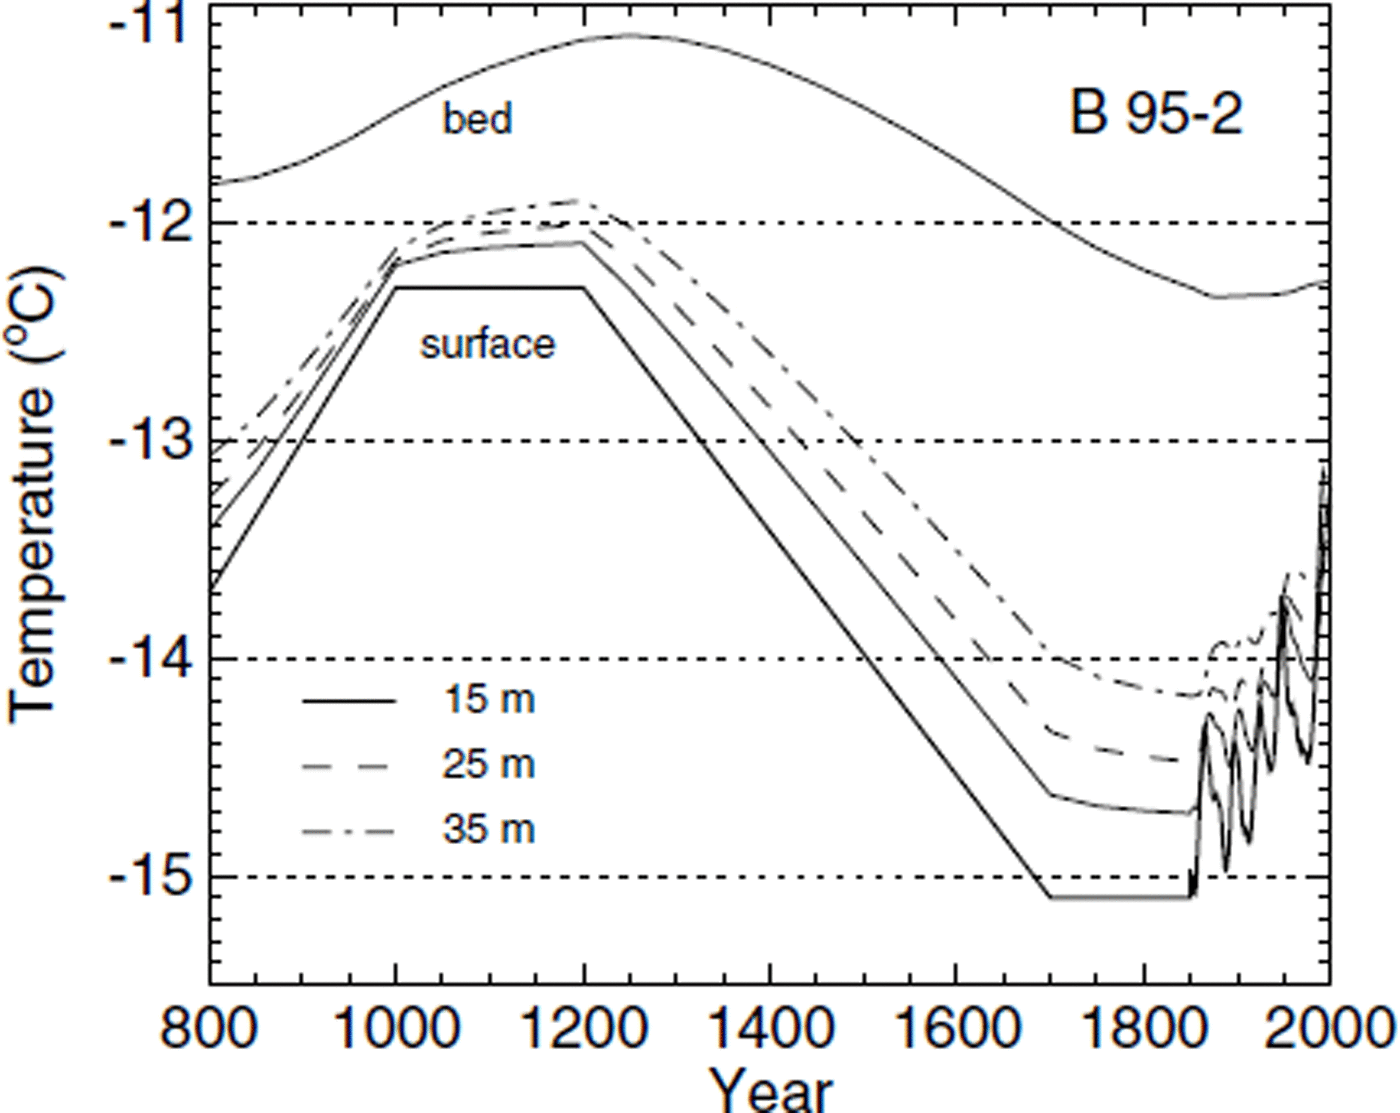
Fig. 10. Englacial temperatures in borehole B95-2 at depths of 15, 25 and 35 m from the transient model. The thick solid line indicates the prescribed surface temperature history (labeled “surface”). The temperature at the base of the borehole is indicated with the uppermost solid line (labeled “bed”).
6.7. Future evolution
Given the large variability of englacial temperatures within such small high-altitude glaciers and the ongoing climate warming, the future evolution of the firn temperatures is of high interest. With increasing firn temperatures, the suitability of Colle Gnifetti as a climate archive could become questionable, since diffusion of chemical species and surface melt events will increase. Two simple scenarios for the next 50 years are discussed to obtain an estimate of the firn temperatures, with special attention to the change in basal boundary conditions.
The temperature profiles shown in Figure 11 were obtained under the assumption of constant surface temperatures during the next 50 years. The bend towards warmer temperatures near the surface fades out after some 30 years, and both profiles tend to a steady state. A considerable basal warming of nearly 0.35°C is predicted for borehole B95-1, and a basal warming of 0.2°C for B95-2. Forcing the surface with a 1°C warming in the next 50 years, englacial temperatures would increase at a similar rate (Fig. 12). The temperature minimum moves downwards in borehole B95-2 because of the strong vertical advection. The basal warming during the next 50 years is predicted to be 0.5° and 0.3°C, respectively.
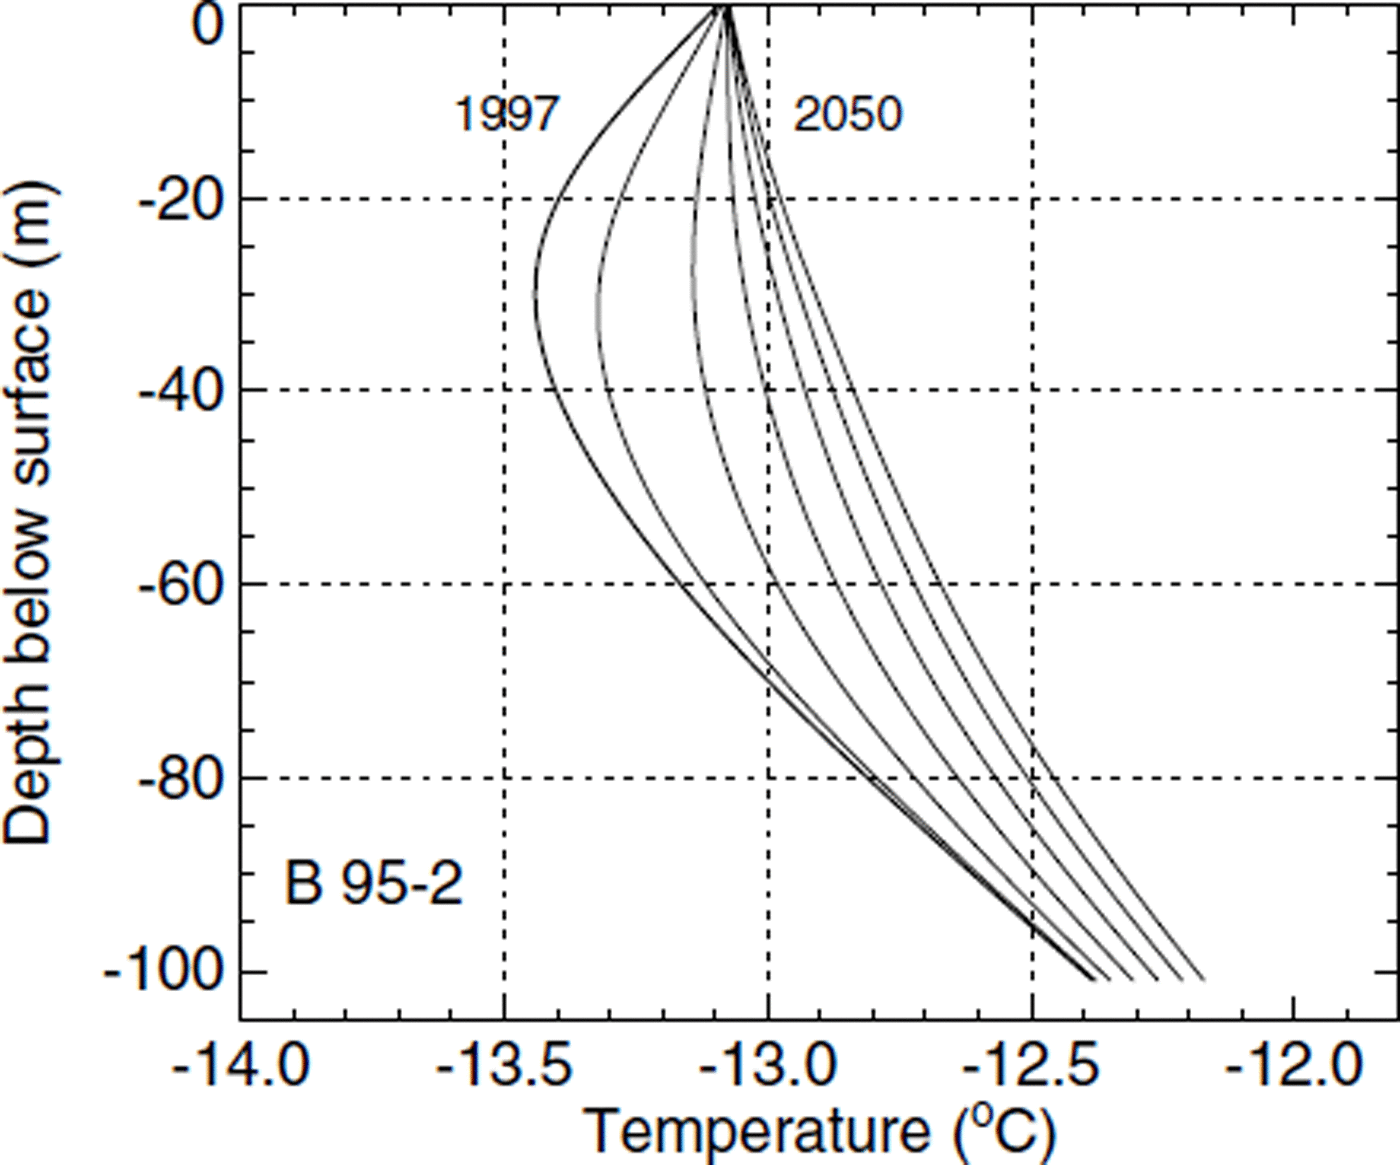
Fig. 11. Modelled future temperature profiles in borehole B95-2 under the assumption of constant surface temperatures during the next 50 years. Thin lines show the modelled temperatures after time increments of 10 years, the leftmost refers to the year 2000 and the thick line is the 1997 state (same curve as in Fig 7). The temperature inversion in borehole B95-2 fades out after some 30 years, and considerable basal warming takes place.
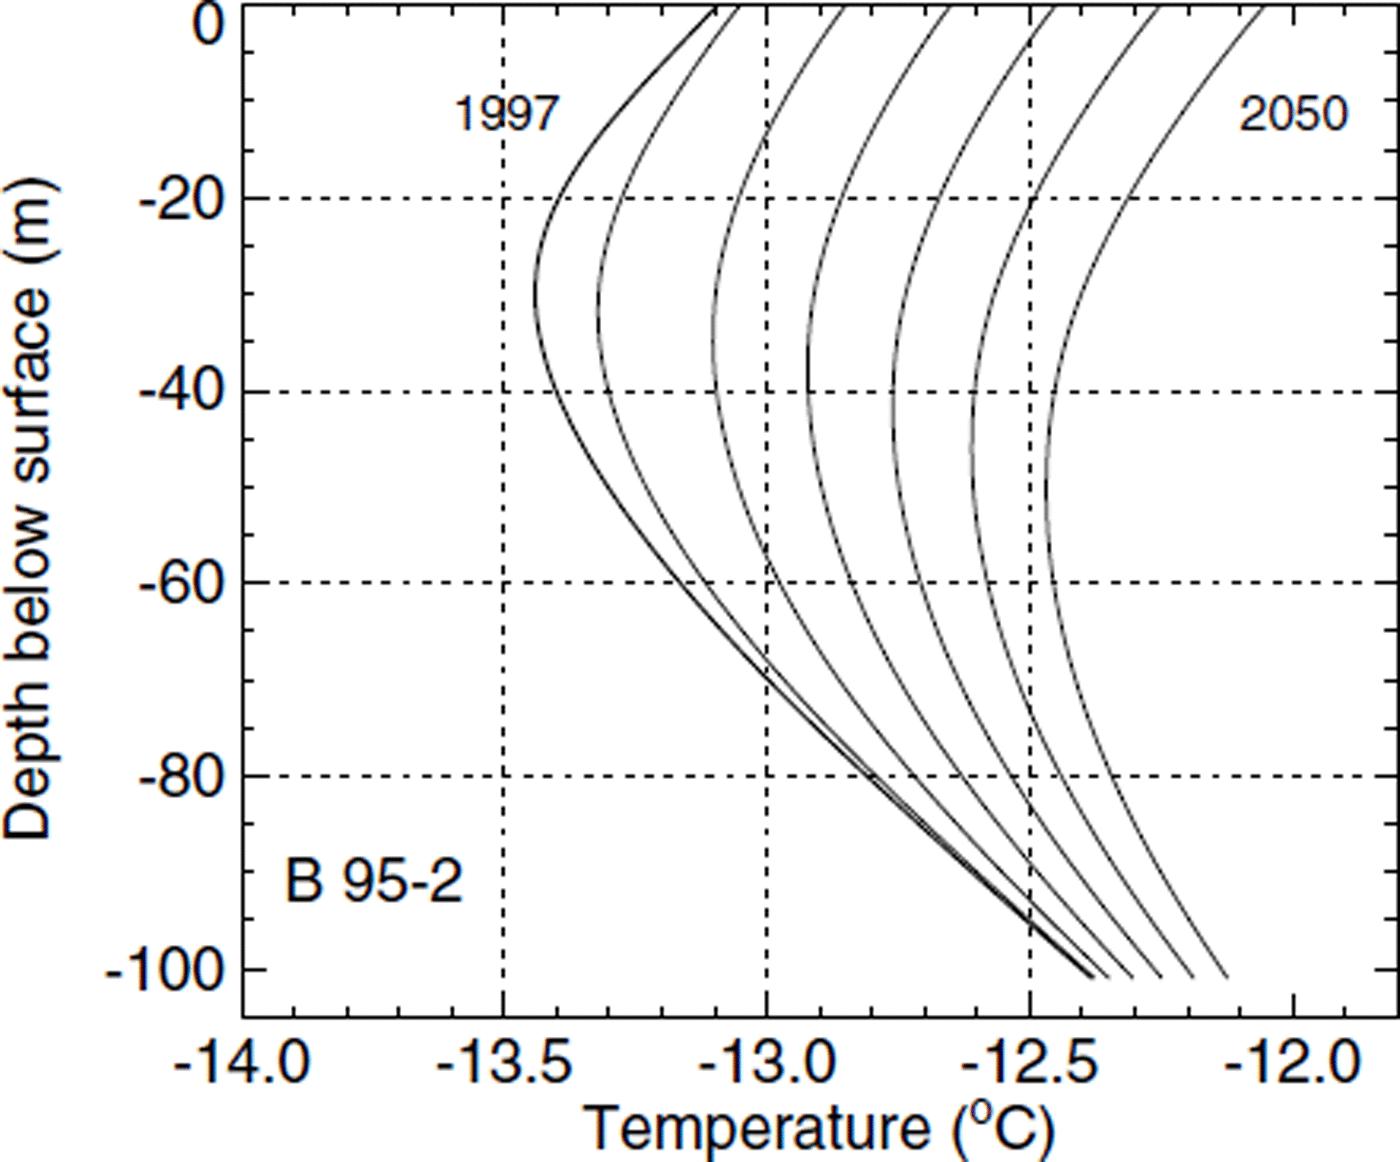
Fig. 12. Modelled future temperature profiles in borehole B95-2 undera linearsurface temperature increase of 1°C during the next 50 years. The lines show the modelled temperatures after time increments of 10 years; the thick line is the same as in Figure 7
The expected change of basal temperatures will only marginally affect the flow behaviour of Colle Gnifetti, since the glacier will still be frozen to the bedrock. However, the above results hint at an important influence on glaciers with basal temperatures close to the melting point.
7. Conclusions
In this paper we demonstrated the application of combined numerical models of glacier flow and heat flow to interpret borehole temperature measurements from Colle Gnifetti. The models include the ice advection, possible phase transitions at the permafrost base within the mountain as well as the firn compressibility. The following conclusions can be drawn concerning thermal conditions of cold, high-altitude glaciers:
The shape of steady temperature profiles depends critically on accumulation, ice advection, the density profile and the spatial distribution of surface temperatures. So important is this influence that curvature of a steady-state temperature profile can be convex or concave.
Observed differences of basal temperature gradients are caused by the mountain topography, i.e. nearby rock walls.
Marked bends observed in temperature profiles can be explained with air-temperature variations recorded at a nearby meteorological station. Such a close correlation between surface firn temperature and air temperature is presumably only possible at cold temperatures (−13°C).
Heat fluxes at the glacier base are different from the average heat fluxes at great depths, as a result of the mountain topography as well as the long-term climate history.
Freezing and thawing of moisture within the bedrock strongly affects the heat fluxes.
Basal temperatures are expected to change considerably in the near future.
A continuation of the ongoing warming trend will raise firn temperatures substantially in the next few decades. This will alter the flow pattern of glaciers with temperatures close to the melting point, especially as parts of the glacier bed become temperate. Glaciers terminating in ice cliffs are likely to enhance their ice-avalanche activity. In some cases, the stability of whole parts of such glaciers may be affected, resulting in huge ice avalanches.
Detailed studies of surface energy-exchange processes are necessary to provide accurate boundary conditions for the heat-flow model. Results of the ongoing European Commission project ALPCLIM will contribute to this knowledge and provide more detailed information on the surface temperature distribution on Colle Gnifetti. In the same context, a systematic monitoring of englacial temperatures will improve our knowledge on the ongoing temperature changes of cold glaciers in the Alps.
Acknowledgements
The fieldwork, under sometimes adverse conditions, was supported by M. Wegmann, U. H. Fischer, L. Keck, E. Kuriger and R. Zergenyi. We appreciate the collaboration of the group of D. Wagenbach (University of Heidelberg). Many thanks are due J. Luthiger and C. Senn for carefully manufacturing the mechanical and electronic parts of the equipment. The helpful comments of J. Meyssonnier, S. Suter and an anonymous referee improved the clarity of the presentation. This project was funded by ETH research grant No. 0-20-982-95.
Appendix: Thermal Properties of Firn
Specific heat capacity
The specific heat capacity of firn and ice (neglecting the heat capacity of the interstitial air) is dependent on (absolute) temperature T (Reference PatersonPaterson, 1994)
Thermal conductivity
The dependency on absolute temperature T of the thermal conductivity of ice k ice is expressed as an Arrhenius relation (Reference PatersonPaterson, 1994)
It is assumed in this study that the thermal conductivity of firn shows the same temperature dependence, which is taken into account with a multiplicative factor in the equations below.
The thermal conductivity is also strongly dependent on density ρ (Reference Von Rudloff, Oeschger, Messerli and SvilarVan Dusen, 1929; Reference SchwerdtfegerSchwerdtfeger, 1963; as cited in Reference PatersonPaterson, 1994), namely

where ρ is in kg m−3 Values of the dependency of thermal conductivity on relative firn density D = ρ/ρ ice were collected by Reference MellorMellor (1977) and fitted by Reference Schwander, Sowers, Barnola, Blunier, Fuchs and MalaizeSchwander and others (1997):
with the temperature-dependent conductivity of ice given in Equation (A2) and with ρ in kg m−3 Still another parameterization has been given by Reference Sturm, Holmgren, König and MorrisSturm and others (1997):
All parameterizations of the thermal conductivity are shown in Figure 13. The values given by Reference SchwerdtfegerSchwerdtfeger (1963) are an upper limit, and the formulas of Reference Von Rudloff, Oeschger, Messerli and SvilarVan Dusen (1929) and Reference Sturm, Holmgren, König and MorrisSturm and others (1997) are at the lower limit. In the numerical models presented in this study, the average of the conductivities given in Equations (A3) and (A4) has been used.
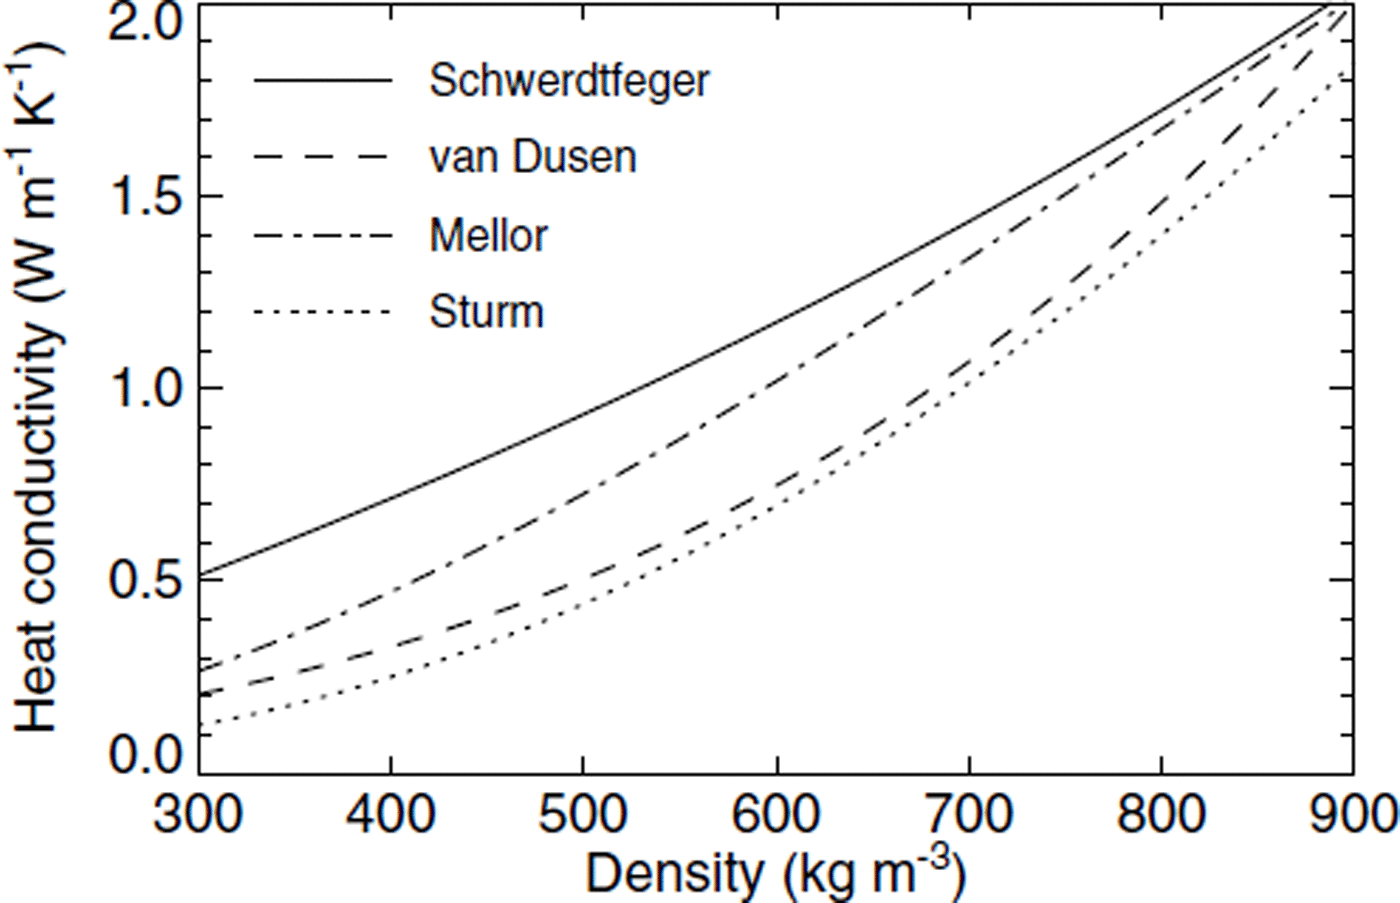
Fig. 13. The density dependence of the heat conductivity in firn as parameterized by several authors.


