Introduction
For several decades visual stratigraphy has provided information on the depositional and evolutionary histories captured in ice cores (e.g. Reference BensonBenson, 1962; Reference GowGow, 1965; Reference LangwayLang-way, 1967). The brightness, texture, bubbling and color seen in these cores reflect timescales from individual storms to major climate shifts, processes from sastrugi migration to glacial flow and changes in ice structure from firn to brittle ice to ductile ice. The interpretation of these phenomena through visual stratigraphy is a critical component to the accurate dating of ice cores. In the dry-snow zone of Greenland, mass loss from intense summer sunshine may create a clear visual signal due to depth hoar (Reference Alley, Saltzman, Cuffey and FitzpatrickAlley and others, 1990; Reference Shuman and AlleyShuman and Alley, 1993; Reference Shuman, Alley and AnandakrishnanShuman and others, 1993, Reference Shuman1997). However, studies like that by Reference Kreutz, Mayewski, Twickler and WhitlowKreutz and others (1996) have indicated some difficulty with visual stratigraphy in the Antarctic where there is less snowfall and dust accumulation. In this paper, we test the ability of automated digital image-processing techniques to count annual layers in a shallow ice core retrieved by the West Antarctic Ice Sheet (WAIS) Divide project (http://www.waisdivide.unh.edu; 79.47° S, 112.09° W).
Reference Hawley, Waddington, Alley and TaylorHawley and others (2003) dated 50 m of ice at Siple Dome, Antarctica (81.64° S, 148.77° W) by sending a camera with light-emitting diode (LED) illumination down the drilling borehole. Image brightness was filtered digitally and a manual interpretation of annual layers in the brightness data agreed to within 10% of independent interpretations that used electrical conductivity measurements and standard visual stratigraphy on a core taken from the borehole. Digital imaging systems have also been used for stratigraphic analysis in laboratory settings. Separate efforts by Reference SvenssonSvensson and others (2005) and Reference Takata, Iizuka, Hondoh, Fujita, Fujii and ShojiTakata and others (2004) describe systems that collected images by traversing core sections with a carriage that provided lighting from below with a digital line-scan camera above. Both groups of investigators produced images that were far superior to earlier photographic approaches which had problems with image parallax and lighting uniformity. In this paper, we test a digital imaging system (Reference McGwireMcGwire and others, 2008) that was developed for the US National Ice Core Laboratory (NICL). The NICL imaging system is integrated with the NICL core-processing database and provides end-to-end support for scanning the cores, calibrating image products, image archiving and analytical image processing. In contrast to the aforementioned approaches, the NICL line-scan imaging system transits the core past the lighting and optics, uses side lighting, and collects image data with 14-bit radiometric resolution. In addition, the NICL system is configured to scan archive core sections that have just one side cut and polished with the rounded exterior as-cut, whereas ice sections imaged by Reference SvenssonSvensson and others (2005) and Reference Takata, Iizuka, Hondoh, Fujita, Fujii and ShojiTakata and others (2004) were microtomed slabs that were finished on all sides. Use of the archive section reduces substantially the amount of time required for physical processing, as well as possible damage associated with the additional handling. The NICL system is also capable of precise fore–aft viewing during the scan to capture fine layer features that are not perpendicular to the camera mount.
The image-processing software that was integrated with the NICL imaging system was adapted from the ImageJ software package that was developed for the US National Institutes of Health (http://rsb.info.nih.gov/ij/). This modified software is called IceImageJ. It includes specific capabilities for dealing with ice-core imagery, such as tools for masking fractured ice out of analyses and properly compensating for the inclination of ice layers in analytical functions (Reference McGwireMcGwire and others, 2008).
Reference SvenssonSvensson and others (2005) provided well-illustrated examples for visual stratigraphy of ice from 1330–3085 m depth that was drilled by the North Greenland Icecore Project (NorthGRIP; 75.10° N, 42.33° W) (Reference Dahl-JensenDahl-Jensen and others, 2002), as well as a technique for obtaining information on annual layer thicknesses at varying depths. Their method identified bright layers in the ice by thresholding the image brightness gradient, progressively thinning proximate layers up to a user-specified tolerance, calculating the power spectrum for remaining layers, and relating the peak frequency of the power spectrum to a spatial scale. In order to overcome problems in selecting which layers were thinned out of the analysis, they randomized the thinning selection and used the sum of power spectrums from 20 iterations. Parameters were calibrated against a δ18O-based model (ss09sea; Reference JohnsenJohnsen and others, 2001). While the results showed good general correspondence to the δ18O measurements, no quantitative information was provided on the variance of optical estimates relative to the isotope record or the amount of overall disagreement.
Reference Takata, Iizuka, Hondoh, Fujita, Fujii and ShojiTakata and others (2004) presented digital image-based methods for identifying annual cycles in ice cores from the Dome Fuji ice core drilled in the Antarctic (77.32° S, 39.70° E). While Reference SvenssonSvensson and others (2005) presented a continuous record of 1755 m, Reference Takata, Iizuka, Hondoh, Fujita, Fujii and ShojiTakata and others (2004) tested only three 50 cm-long sections of ice taken from different depths. An accumulation-flow model by Reference Johnsen, Dansgaard, Bard and BroeckerJohnsen and Dansgaard (1992) was used to estimate expected layer thickness, and image frequencies that did not match this scale were removed by filtering with the fast Fourier transform (FFT). Resulting peaks in image brightness were identified as annual layers if they matched user-specified criteria regarding their spacing and magnitude. No quantitative comparison to other dating techniques was provided.
Methods
This study used largely automated analyses of optical image data to record annual layers for the top 113 m of firn and ice from the WDC05Q core that was collected by the WAIS Divide project in December 2005 and processed at NICL in August 2006. A preliminary visual examination of the images showed that brighter regions of the core generally corresponded with the estimated positions of the Antarctic early winter (June–July), as determined from electrical conductivity measurements (ECM) and continuous highdepth-resolution glaciochemical measurements (Banta and others, in press). However, these images also captured a high degree of intra-seasonal variation in image brightness that made the annual cycles difficult to interpret. Methods were developed to (1) filter out intra-seasonal variation, (2) model the change in annual layer thickness with depth and (3) identify individual annual cycles. The results of this optical analysis were compared with an independent glaciochemical interpretation of the WDC05Q core. Details on the configuration of the NICL optical scanning system and the software that was developed for image acquisition and processing are provided in Reference McGwireMcGwire and others (2008). At the time of writing, the dating methods described herein have not been integrated into the software for that system.
Image acquisition and processing
Images collected for the WDC05Q core were acquired during the core-processing line at NICL in the summer of 2006. The ice-core sections were 9.5 cm in diameter and approximately 1 m long. Sections were scanned at a spatial resolution of approximately 0.06 mm. The image data used here were standard 1.0 mm resolution products that were generated automatically from raw images using the NICL system. As part of the automated processing to standard data products, a ‘bad ice’ mask was generated for each image which screened out fractured ice and background from subsequent processing. The default mask identified regions that were anomalously bright and not aligned perpendicular to the core axis like typical ice layers (Reference McGwireMcGwire and others, 2008). The default ice mask was examined visually for each image and edited manually.
While the NICL scanning system provides constant lighting geometry for sections of the ice core, the rough-out curvature on the back of the core section causes variations in image brightness. In addition, there are drop-offs in lighting at the ends of each core section due to reduced scattering into the field of view from adjacent regions. Routines in the IceImageJ software corrected these effects by subtracting mean brightness changes perpendicular to the axis of the core and by Fourier filtering and trend removal at each end of the sections (Reference McGwireMcGwire and others, 2008). Figure 1a–c show the result of these brightness corrections being applied to the image of section 20 of the WDC05Q ice core from 20.695 to 19.650 m depth.
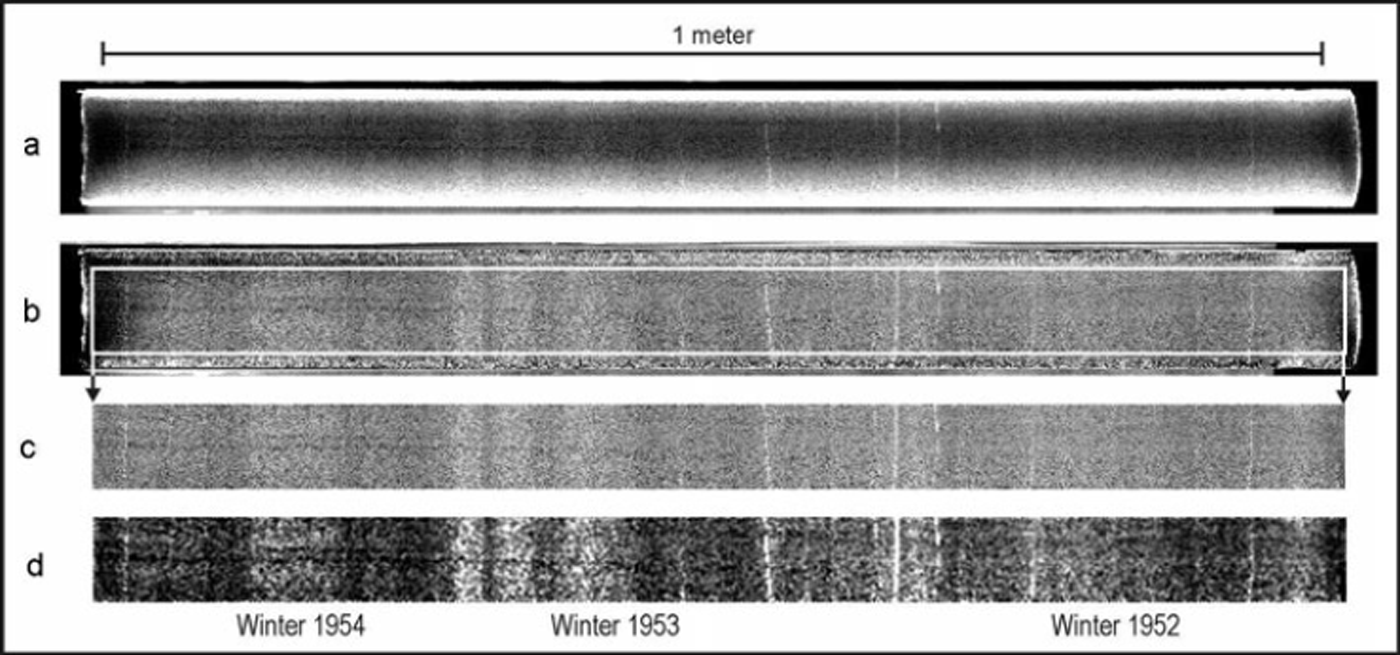
Fig. 1. Image of section 20 (19.650–20.695 m) of the WDC05Q core: (a) original; (b) core curvature correction; (c) correction for section ends; and (d) smoothed and contrast-enhanced to emphasize variation. Seasonal positions are estimated from glaciochemical analysis.
As seen in Figure 1, there was layering in the ice due to changing bubble density, crust formation and other factors that depended on the conditions of deposition and ice evolution. The approximate locations of winter seasons indicated in Figure 1 are drawn from the glaciochemical analysis described below. Based on expected annual layer thickness, it was clear that many visible layers in the ice were associated with intra-seasonal conditions. There was not a clear one-to-one correspondence between the characteristics of individual layers and the season. This situation with the WDC05Q core contrasts with prior examples from Greenland, where a simpler relationship between season and ice brightness was observed (Reference AlleyAlley, 1988; Reference AlleyAlley and others, 1993, Reference Alley1997; Reference GowGow and others, 1997). Because the images capture intra-seasonal events, it was necessary to smooth the brightness variations to generate cycles of image brightness that corresponded to annual variations.
In order to reduce the volume of data for analysis, a low-pass windowed sinc filter was applied to smooth the 1.0 mm images to a 0.5 cm resolution, and the average image brightness was extracted for each 0.5 cm interval down the length of the core. In contrast to previous work by Reference SvenssonSvensson and others (2005), the ‘bad ice’ masks were used to remove bright, fractured areas of ice from the filtering and averaging of ice brightness. Low-pass filtering used the sinc function, which has been described as optimal for that purpose (Reference MoikMoik, 1980; Reference SmithSmith, 2002). Sample weights for the sinc function are equal to the sine of the distance from the central position divided by that distance (i.e. sin(x)/x). The ideal sinc function extends infinitely, so a Blackman window (Reference SmithSmith, 2002) was used to truncate the filter and properly taper response at the tails. The width of the windowed sinc filter was measured using full width at half-maximum (FWHM), which is the distance across the filter kernel where response drops to 50% of maximum.
Brightness values were normalized by subtracting the mean and dividing by the standard deviation of the entire core to provide some degree of comparability of the parameter values with future efforts. Though the WDC05Q core was just over 129 m long, a strong lighting artifact appeared to arise from a problem with an accidental repositioning of the fiber-optic illumination for sections below 113 m. Unfortunately this resulted in complex lighting artifacts that would be difficult to model, so the portion of the core below 113 m was removed from this analysis.
Modeling annual layer thickness
One complexity with filtering the ice-core images was that the thickness of annual layers decreased with depth due to the density gradient. Additional thinning from the vertical strain rate associated with ice flow is small over the depth range considered here (Reference Johnsen, Dansgaard, Bard and BroeckerJohnsen and Dansgaard, 1992). The effect of density on annual layer thickness could be handled by either using measurements of ice density to transform ice-core depths to their water equivalent, or by smoothly varying the width of the low-pass filter as depth changed. The latter approach was selected for this study as being representative of analyses that could be derived solely from optical information.
In this shallow-ice example, density-related changes in annual layer thickness were modeled using a power relationship that decreased to a constant beyond a given depth (c), so:
where W is the expected annual layer thickness and X = min(c, snow depth).
The three parameters of this relationship (a, b, c) were developed directly from the profile of image-brightness values as follows. Nyquist sampling theory states that the minimum sampling frequency must be at least twice that of the phenomenon to be measured (Reference Jenkins and WattsJenkins and Watts, 1968). The pattern of brightness to be isolated alternated between bright and dark each year, so assuming a similar rate of accumulation for bright and dark regions, the maximum low-pass filter width should be less than 25% of the expected annual thickness. However, given the high degree of intra-seasonal variability, as filter widths become smaller more intra-seasonal features would be confused as annual signals. We made use of this trade-off to parameterize the relationship between depth and annual thickness. Iterative parameter optimization was performed to select appropriate estimates of a, b and c using the multi-objective complex (MOCOM) global optimization method (Reference Yapo, Gupta and SorooshianYapo and others, 1998). MOCOM combines the benefits of a controlled random search, competitive evolution, Pareto ranking and a multi-objective downhill simplex search. MOCOM assigns randomized sets of parameter values to a number of simplexes. The parameter values for each simplex are adjusted through a number of iterations so that the simplex moves ‘downhill’ relative to user-defined objective functions. Since the user defines more than one objective function for MOCOM, instead of migrating to a single solution, the simplexes move towards a boundary that represents the trade-offs between the different objective functions. For example, there could be cases where reducing the root-mean-square (rms) error of a model may increase prediction bias. The boundary representing the optimal trade-off between objectives is referred to as the Pareto-optimal curve. Using the MOCOM algorithm:
random combinations of a, b and c were selected,
brightness data were smoothed with a variable low-pass filter the FWHM of which was 25% of the expected annual thickness at a given depth (based on the current draw of a, b and c),
brightness peaks that remained after smoothing were counted, and
the MOCOM algorithm migrated the parameters to values that maximized variance of the smoothed brightness values (objective function 1) for a given number of peaks in brightness (objective function 2).
With this method that we refer to as optimized variance maximization (OVM), the resulting Pareto-optimal curve was expected to identify a range of parameter values where the depth/thickness relationship best matched the annual variation in image brightness. If the depth/thickness relationship of a given parameter set underestimated the thickness of annual cycles, the width of the low-pass filter would be smaller and variance would rise due to the increasing influence of intra-seasonal variability. If the width of annual brightness cycles was overestimated by a parameter set, over-smoothing would suppress variance by compressing the overall range of values. For parameter sets where the depth/thickness relationship was close to the actual pattern in the data, the brightness cycles would be expected to come through the low-pass filter with relatively similar levels of variability, with just a few of the smaller peaks being affected. In other words, increased smoothing reduces noise, but too much smoothing reduces overall contrast in a manner similar to blurred vision. Since OVM used the number of brightness peaks as one of the objective functions for MOCOM, parameter sets on the Pareto curve that were in the desired transition zone between too little and too much smoothing would also provide an estimate of the total number of years in the dataset.
Identifying annual layers
In addition to estimating the overall relationship between depth and annual thickness of ice layers with OVM, three methods were tested for extracting individual annual layers. All three used the OVM depth/thickness relationship to make the width of a low-pass filter vary by depth. The first simple method applied a windowed sinc filter with a FWHM of one-fourth the OVM estimated annual thickness at a given depth. Remaining peaks in the smoothed image brightness were identified by fitting a second-order polynomial to a neighborhood around each data value and searching for zero crossings in the first derivatives. Polynomial fitting ensured that the selected brightness peaks were sufficiently broad in scale and the neighborhood for the polynomial was one-half the low-pass FWHM.
The second method for identifying annual brightness cycles detrended the polynomial neighborhood prior to fitting. This allowed detection of residual inflections in the smoothed brightness curve associated with years that had below-average snowfall where the distinct peak had actually been lost. However, detrending would also risk including strong intra-seasonal features from years with above-average accumulations. While the second method does allow detection of both peaks and positive inflections in the smoothed brightness, the FWHM of the low-pass filter and the size of the neighborhood used for polynomial fitting do limit the possible proximity of annual features. While we kept the polynomial neighborhood described in the first method, the neighborhood could be optimized if it provided a beneficial trade-off between detections of annual and intra-seasonal features.
Finally, in shallow cores there may be features such as deposits from volcanic eruptions that could be used to provide calibration points. The third method extended the detrended approach by using MOCOM to select an optimal proportion of the expected annual thickness for the low-pass FWHM. The chemical interpretation for the WAIS Divide core shows sulfur content increasing dramatically from 1815 through 1816 as a result of the Tambora (Indonesia) eruption. This well-defined chemical peak for 1816 was selected as a single calibration point, and the chemical interpretation placed the Antarctic winter for that year at an approximate depth of 59.38 m. Two objective functions were used in MOCOM to calibrate to this event: (1) the absolute difference in annual counts from the known number of years since the eruption; and (2) the rms difference of image-based annual thicknesses from that predicted by OVM. This combination of objectives ensured that the distribution of annual layer thicknesses was maintained when arriving at a solution that best matched the known number of annual cycles. Otherwise, a filter width might be chosen that mixed annual and seasonal signals to simply arrive at the target number of years.
Comparison with an independent chemical interpretation
The image-based methods were assessed by comparing results to a high-depth-resolution glaciochemical interpretation of annual layers in the ice. In this method, called ‘continuous flow analysis with trace elements’ (adapted from Reference McConnell, Lamorey, Lambert and TaylorMcConnell and others, 2002), a ∼3 cm × ∼3 cm sample of the ice core is melted and analyzed continuously along the core. Meltwater from the innermost ∼10% of the sample is pumped to two high-resolution inductively coupled plasma mass spectrometers for real-time measurements of a range of elements including sodium (Na) and sulfur (S). Na is an indicator for sea salt which is deposited at WAIS Divide primarily during winter and early spring storms (Reference KaspariKaspari and others, 2004). Sea-water abundance ratios are used to determine non-sea-salt sulfur (nssS) from the Na and S measurements. The nssS is mainly from marine biogenic and volcanic emissions, with the former reaching a maximum in summer (Reference KaspariKaspari and others, 2004). Therefore, the strongly seasonal ratio of nssS to Na concentration in snow at WAIS Divide was used to identify annual layers in the ice core, with the minimum in the ratio occurring in mid-winter and the maximum in mid-summer. Detailed comparisons in nssS concentrations at WAIS Divide and the very high-snowfall ice-core site at Law Dome (adapted from Reference Palmer, van Ommen, Curran, Morgan, Souney and MayewskiPalmer and others, 2001) were used to corroborate the annual layer identification in the WDC05Q ice core (Banta and others, in press). Uncertainty in the dating is estimated to be approximately ±1 year, declining to approximately ±0.2 years at depths corresponding to major well-known volcanic eruptions.
The over/under-prediction of annual brightness cycles relative to the chemical interpretation was calculated as a ratio of image to chemical counts for the full 113 m. Each annual cycle derived from the image brightness data was matched by depth to the closest annual feature in the chemical interpretation. This identified where gaps or duplication occurred relative to the chronology of the chemical interpretation. Percent agreement between the two datasets was calculated by dividing the number of singly matched proximate interpretations by the total number of matched and unmatched annual features from either dataset.
Results and Discussion
The Pareto-optimal curve of the OVM method showed a shoulder relating to the range of parameter values where the depth/thickness relationship best matched the annual pattern of variation in image brightness (Fig. 2). The inflection point of this shoulder feature was calculated using the second derivative of a third-order polynomial fit. The inflection point corresponded to 394 brightness cycles, while the total number of annual counts from the chemical interpretation was 414. This 4.7% underestimation might have occurred because smoothing out the smallest brightness peaks for years with low snow accumulations may have had a negligible effect on overall variance. Alternately, the MOCOM solutions were primarily responding to the effect of the overall density gradient on average layer thickness, and the disagreement may represent inherent uncertainty from annual variability rather than a systematic prediction bias. To confirm the interpretation of the OVM curve in Figure 2, the OVM method was tested after randomizing values in the optical dataset, and the resulting Pareto-optimal curve plotted as a straight line with no inflection at all (not shown).
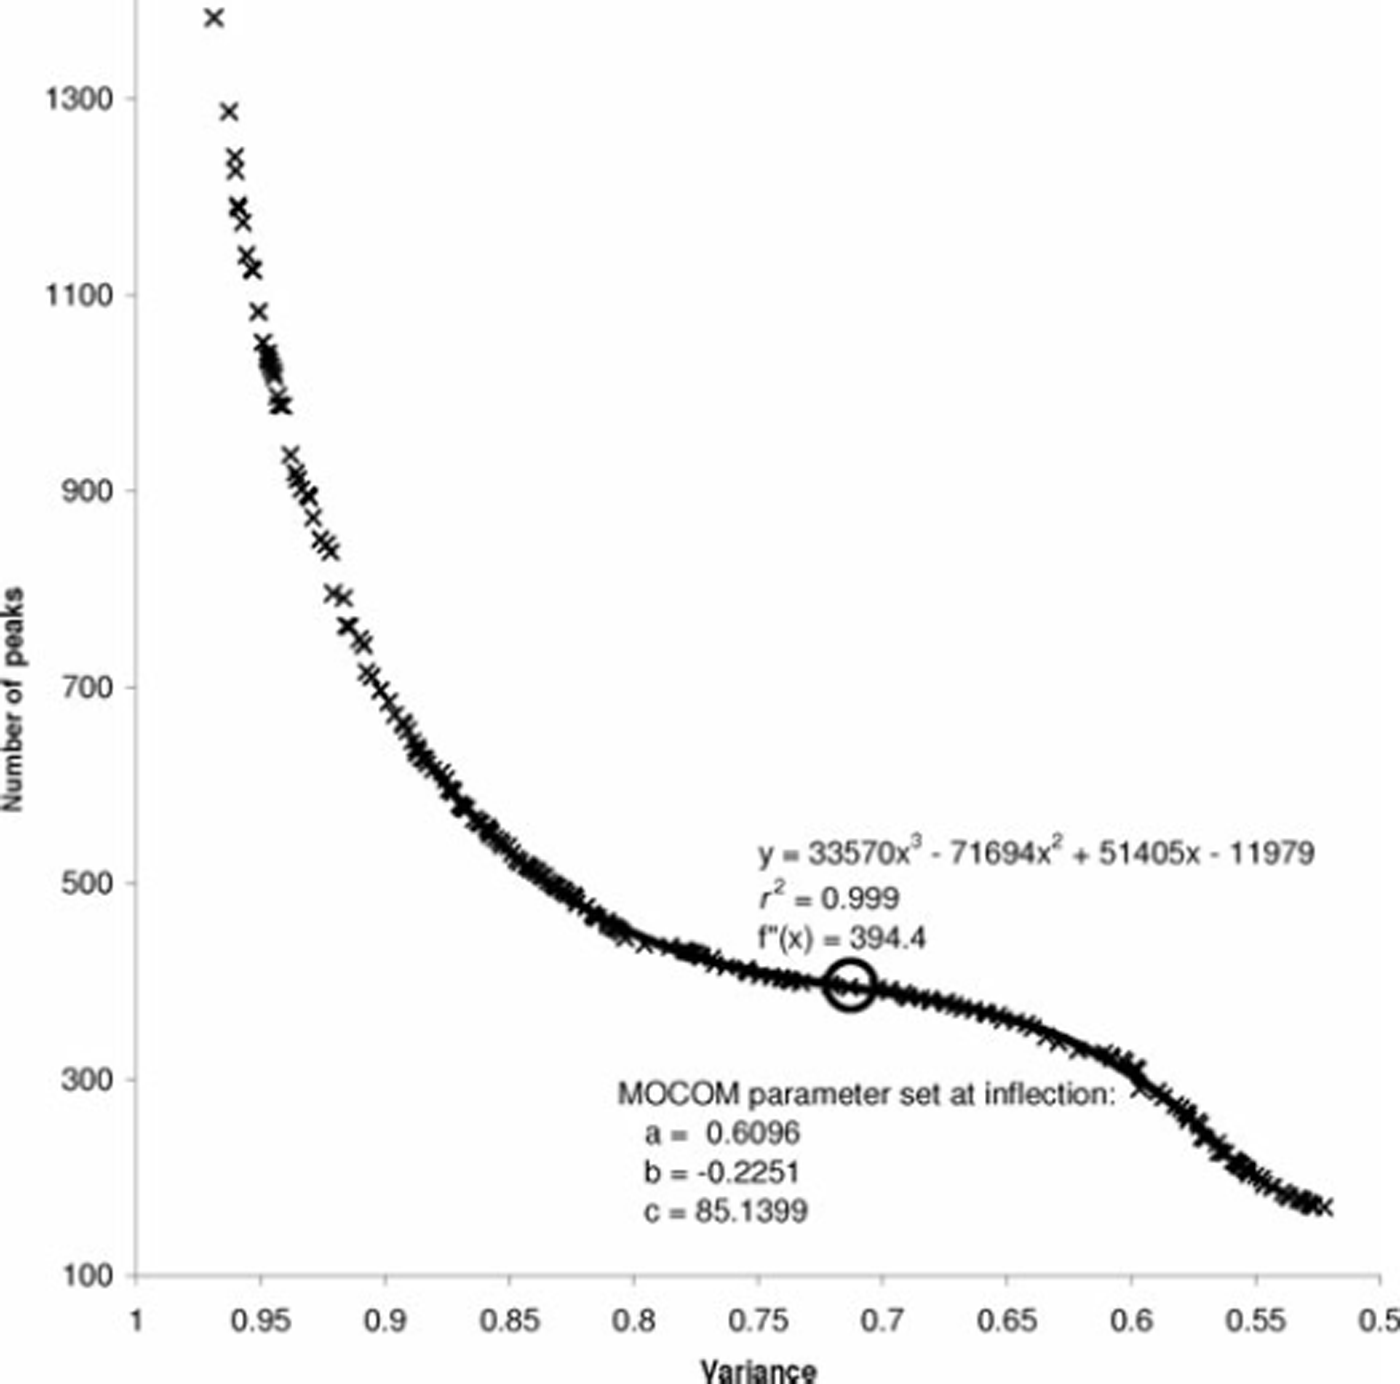
Fig. 2. Pareto-optimal curve for maximizing image variance for a given number of cycles based on a low-pass filter with FWHM of one-quarter the modeled depth/thickness relationship. The fitted third-order polynomial is shown as a solid line. The calculated inflection point for the fitted polynomial is circled.
The MOCOM parameter set closest to the calculated inflection point was selected for use in the rest of this analysis (Fig. 2). Figure 3 shows annual layer thicknesses derived independently from the chemical interpretation (points marked by X), along with the relationship between depth and expected annual thickness for the selected OVM parameter set (solid line). For comparison, the dashed line in Figure 3 shows a direct statistical fit of the chemical interpretation based on the same power relationship that was used in OVM. The OVM method shows a very good fit to the thicknesses of the chemical interpretation. However, it appears the variance maximization may bias the thickness estimates towards slightly lower values to provide the least smoothing that would still create a given number of annual cycles. The relationship in Figure 3 increases exponentially towards zero, so when using this relationship to establish the low-pass FWHM for subsequent layer-counting methods, annual thickness was truncated at a maximum of 0.55 m.
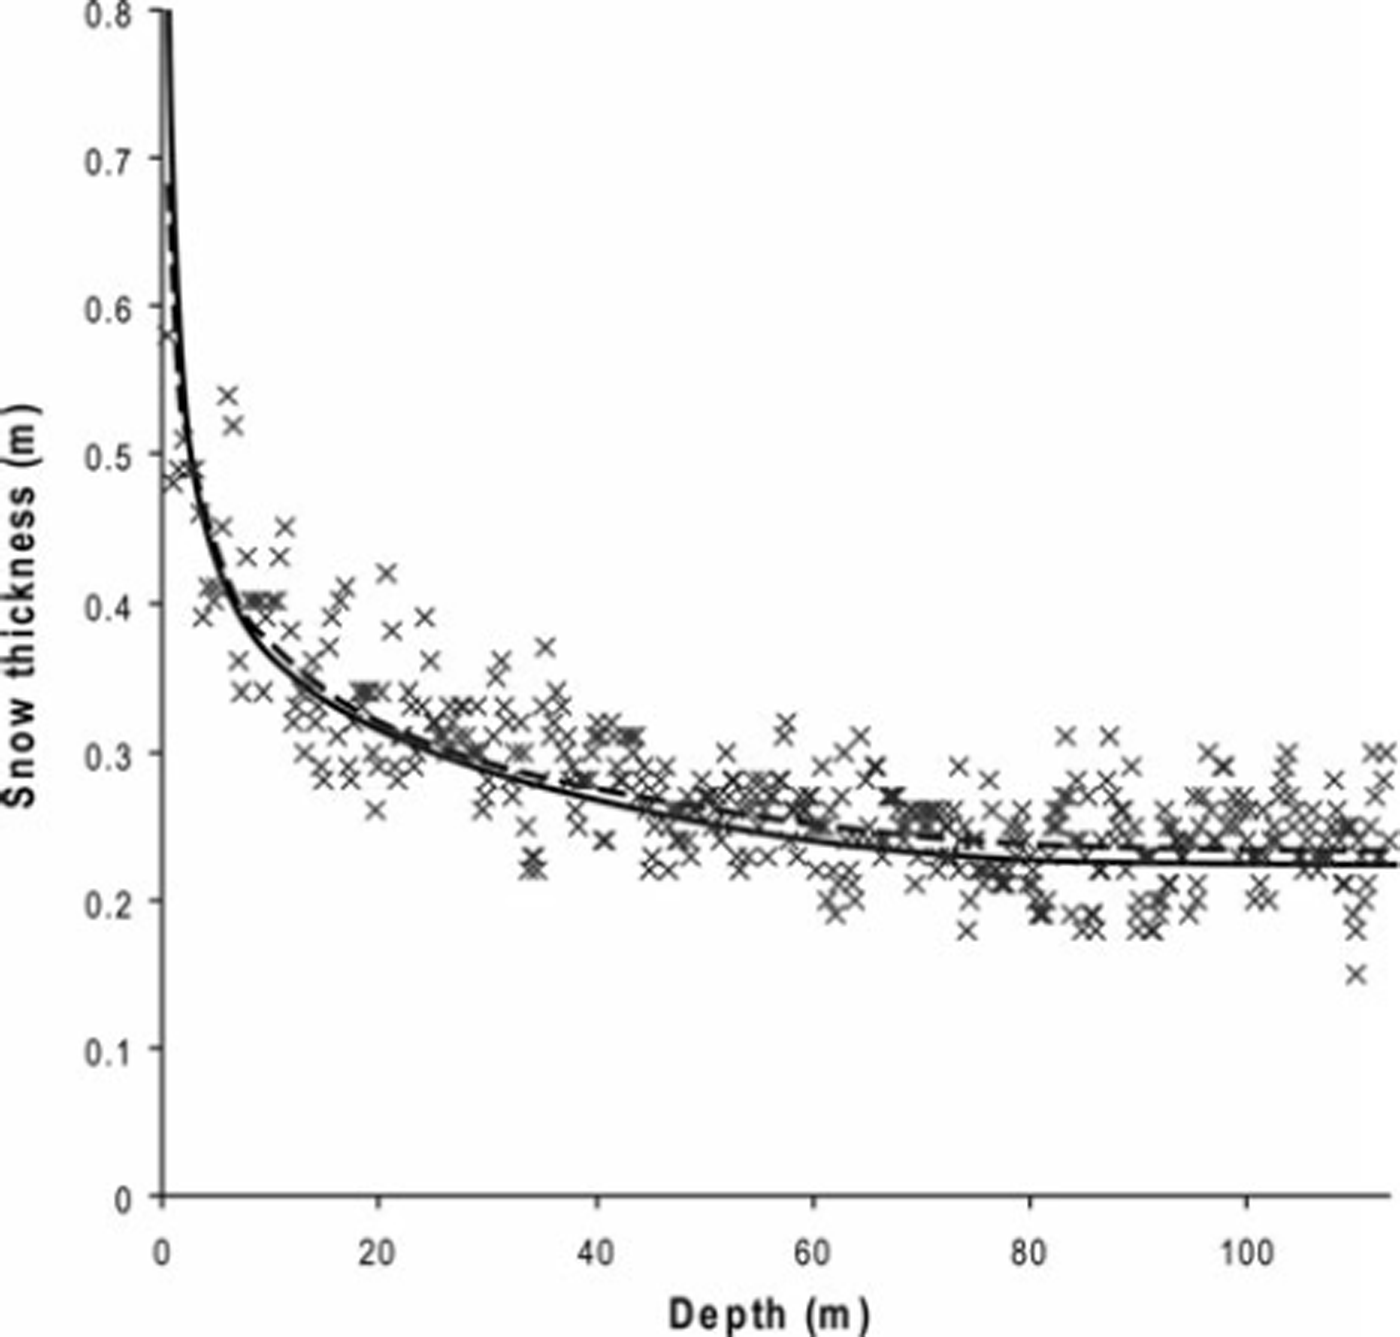
Fig. 3. Annual layer thicknesses from the chemical interpretation (X) and the OVM depth/thickness relationship (solid line). A direct statistical fit to the chemical data using the same power relationship is shown with a dashed line.
Because the OVM method was derived solely from image variance, it did not require manual interpretation of the brightness data or any prior classification of layer features. It also avoided problems that standard FFT analysis would have in trying to identify proper frequency peaks in a non-stationary dataset (Reference SmithSmith, 2002). Wavelet analysis is capable of resolving this type of depth/frequency dependence, though OVM may provide a more straightforward characterization if a reasonable parametric relationship can be posited a priori.
Figure 4 compares the results of the simple and detrended image-based layer-counting methods to the chemical interpretation of the WDC05Q core. The simple method that was based solely on filtered brightness peaks systematically underestimated the number of annual cycles relative to the chemical interpretation. This result predictably mimicked the underestimation of the inflection point of the Pareto-optimal curve in Figure 2 and was most likely due to peaks for years with low snowfall being smoothed out by a low-pass filter the width of which was one-quarter the expected annual thickness. However, the 3.9% underestimation from counting individual brightness peaks (Table 1) was smaller than the underestimation by the OVM inflection point. The simple method had 94.0% agreement with the chemical interpretation when matching proximate annual features.
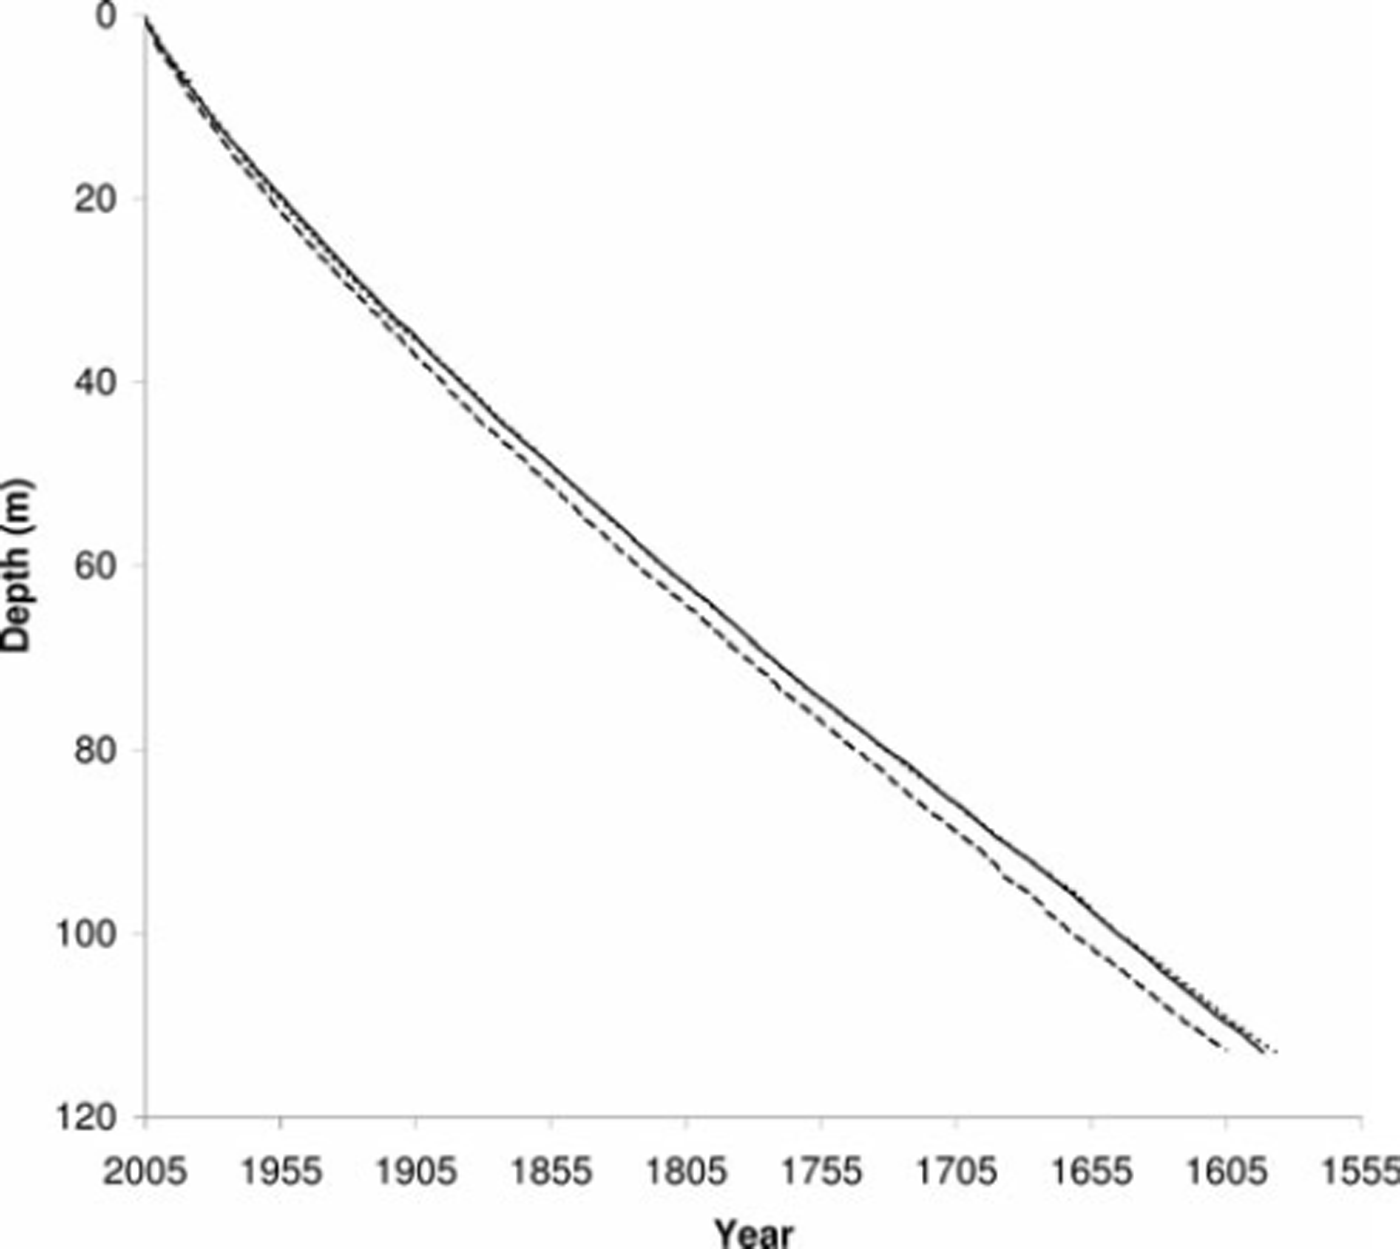
Fig. 4. Comparison of simple (dashed line) and detrended (dotted line) detection of annual peaks in image brightness with the chemical interpretation (solid line).
Table 1. Comparison of image-based results with glaciochemical interpretation

In Figure 4 the detrended method (dotted line) that was also able to detect positive curve inflections between brightness peaks almost overlaps the glaciochemical interpretation (solid line). The detrended method had <1% overestimation relative to the independent glaciochemical interpretation (Table 1), and the independent methods indicated similar annual features 95.8% of the time.
Figure 5 shows that the Pareto-optimal curve developed by MOCOM converged to just three points when calibrating the image-based method to the Tambora eruption. The target number of annual brightness cycles could be made to match the depth for Tambora if the FWHM of the depth-varying low-pass filter was 0.2488 times the expected annual thickness from the previously selected OVM parameters (instead of the 0.25 multiplier used thus far). The presence of two alternate solutions shows that the match to the proper number of years was not optimal with respect to the OVM model of annual thicknesses (Fig. 5). However, the total difference in rms between solutions relative to OVM was 0.3% of the expected annual thickness, indicating that the solution that matched Tambora’s age exactly was not obtained through any wholesale shifts between annual and intra-seasonal variability. Since the Tambora eruption was a known event with a clear chemical signature in the ice, there would be little justification for selecting the alternative MOCOM solutions that had a slightly better fit to the OVM depth/thickness estimates.
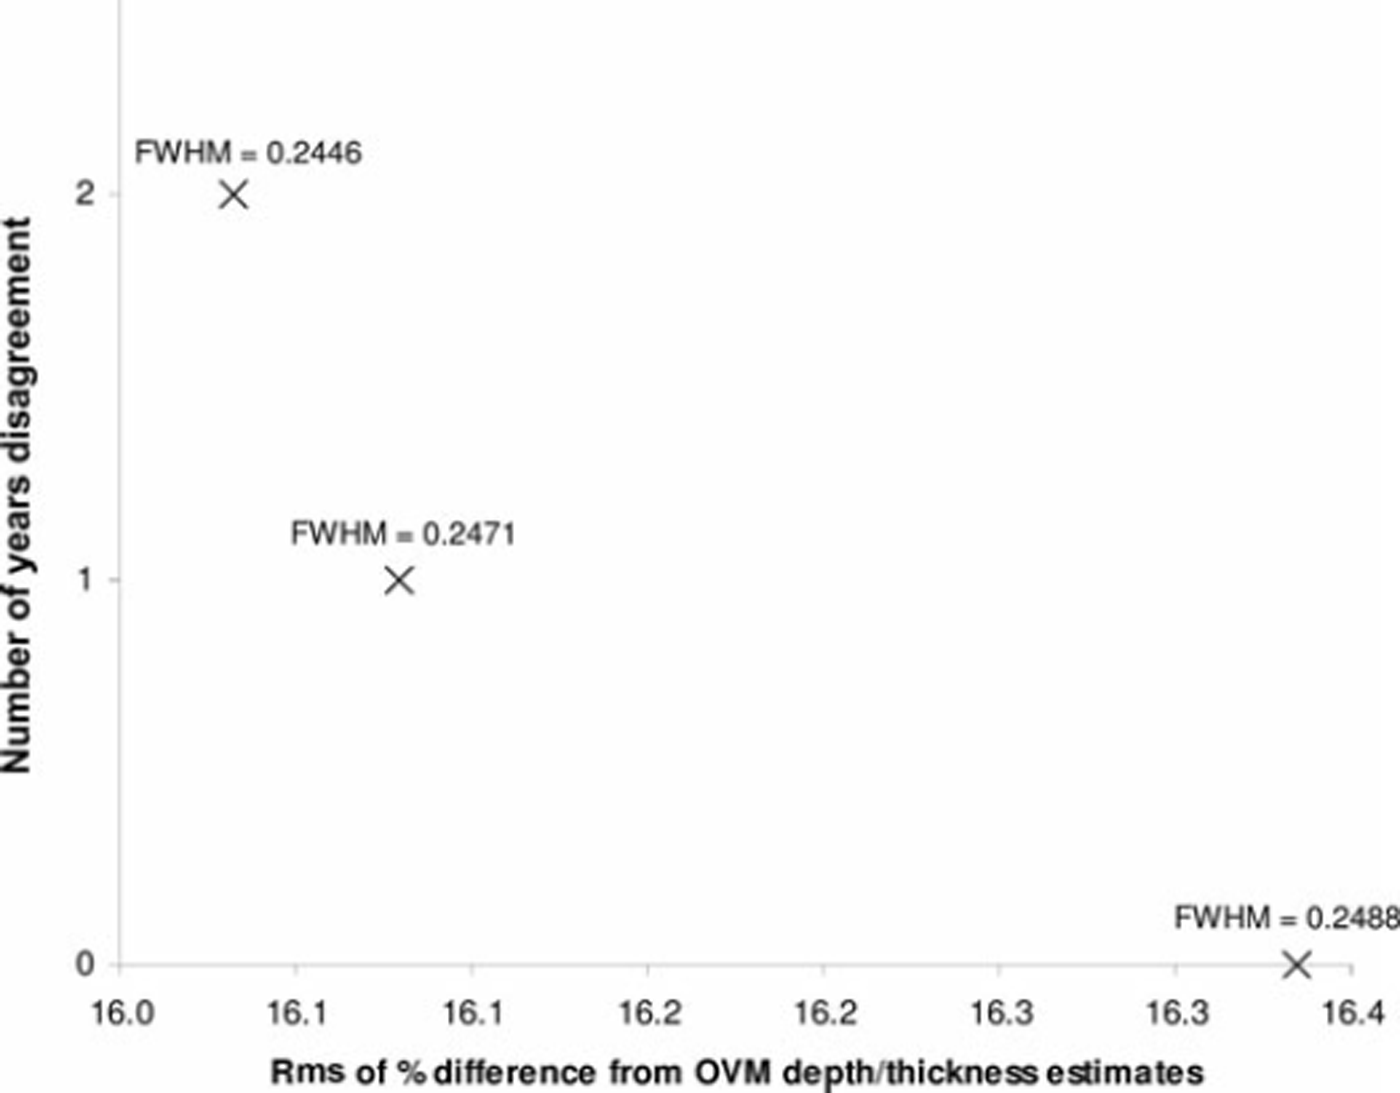
Fig. 5. Pareto-optimal solutions when calibrating to the Tambora eruption with the MOCOM method showing possible trade-offs between matching the exact date (y axis) and having annual thicknesses match the OVM depth/thickness relationship (x axis). The calibrated FWHM for low-pass filtering is shown for each Pareto-optimal solution.
Figure 6 compares the results of the calibrated method to the chemical interpretation. Before calibration, the de-trended method was just one annual cycle short of hitting the Tambora eruption, and the very slightly narrower FWHM of the calibrated method kept a small brightness peak prior to the 1816 eruption from being smoothed out. However, the narrower FWHM also resulted in slightly higher count for the entire 113 m, pushing the total age a little further from the chemical interpretation (+1.21%; Table 1). The proportion of matched proximate annual features between the image and chemical interpretations increased slightly (96%), so the added cycles were generally positioned on features that agreed with the chemical interpretation.
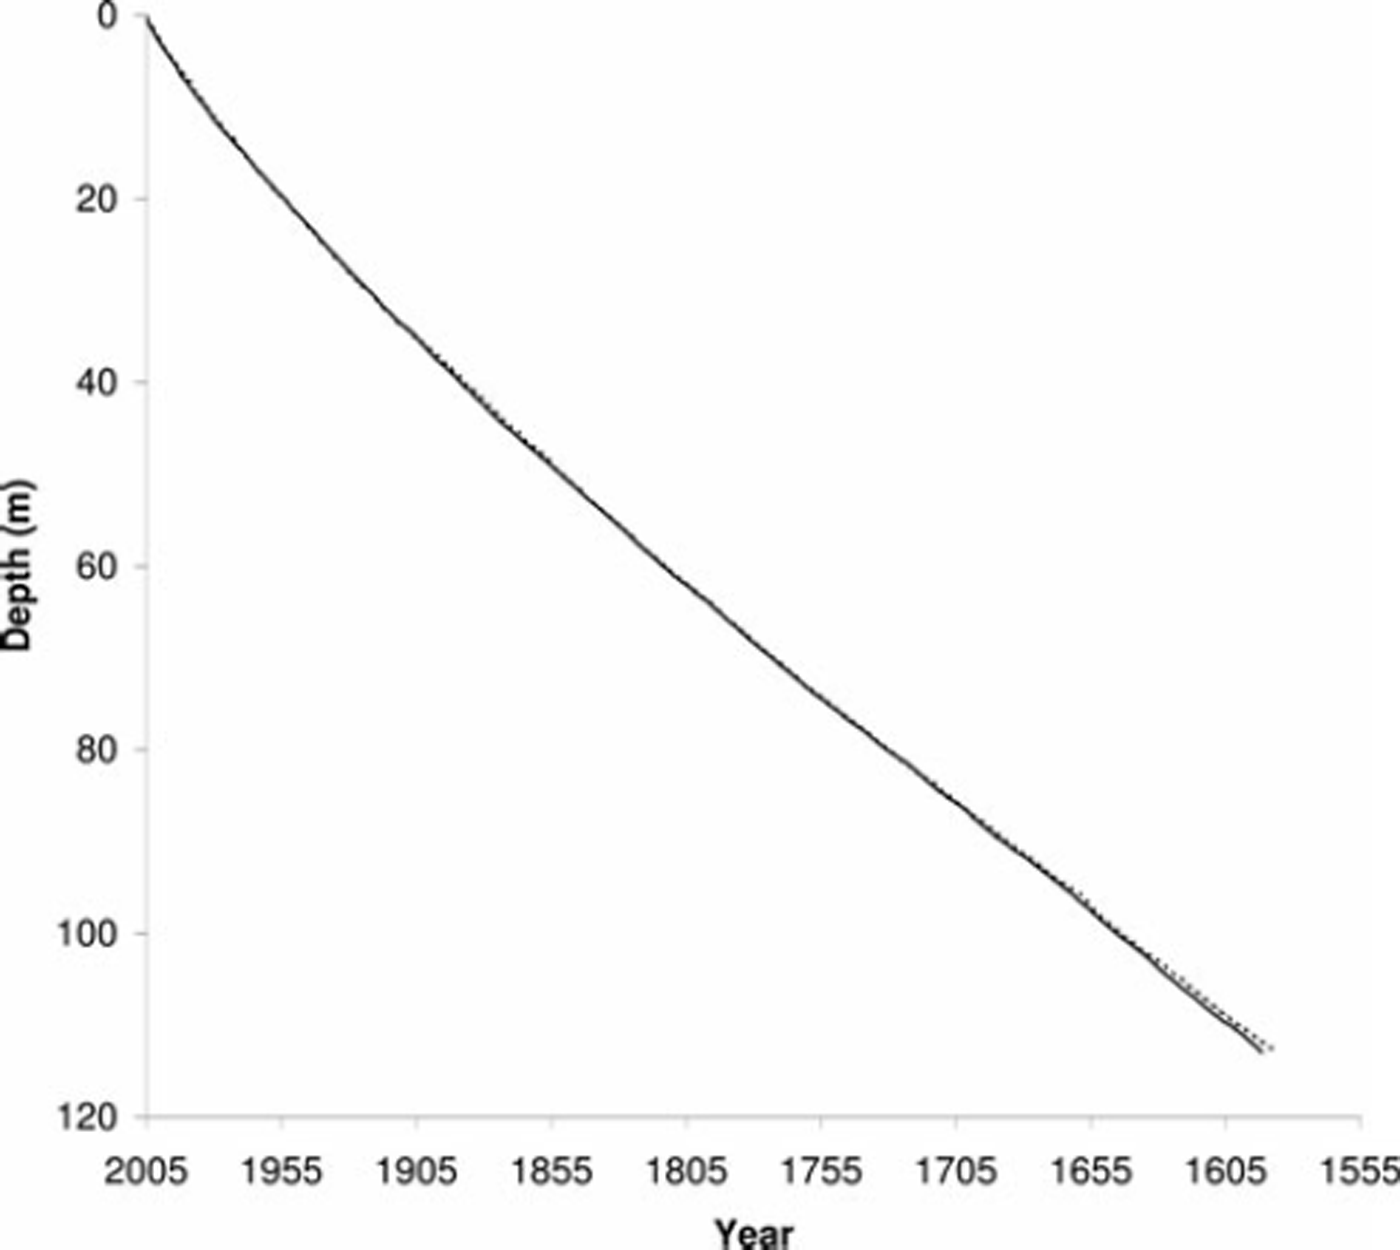
Fig. 6. Comparison of calibrated age–depth relationship based on detection of annual peaks in image brightness (dotted line) with the chemical interpretation (solid line).
Histograms representing the distribution of annual layer thicknesses from each of the methods are presented in Figure 7. The histograms show how the first simple method of selecting peaks resulted in fewer narrow annual layers. The most frequent values for annual thickness showed very close agreement between the chemical interpretation and both the detrended and the calibrated image-based methods. However, the distributions of annual thicknesses around the histogram peak were a little more variable for the image-based methods. It is not known to what degree this increased variability may be attributed to differences in the physical processes affecting ice brightness versus chemical composition, or to differences in the interpretation techniques.
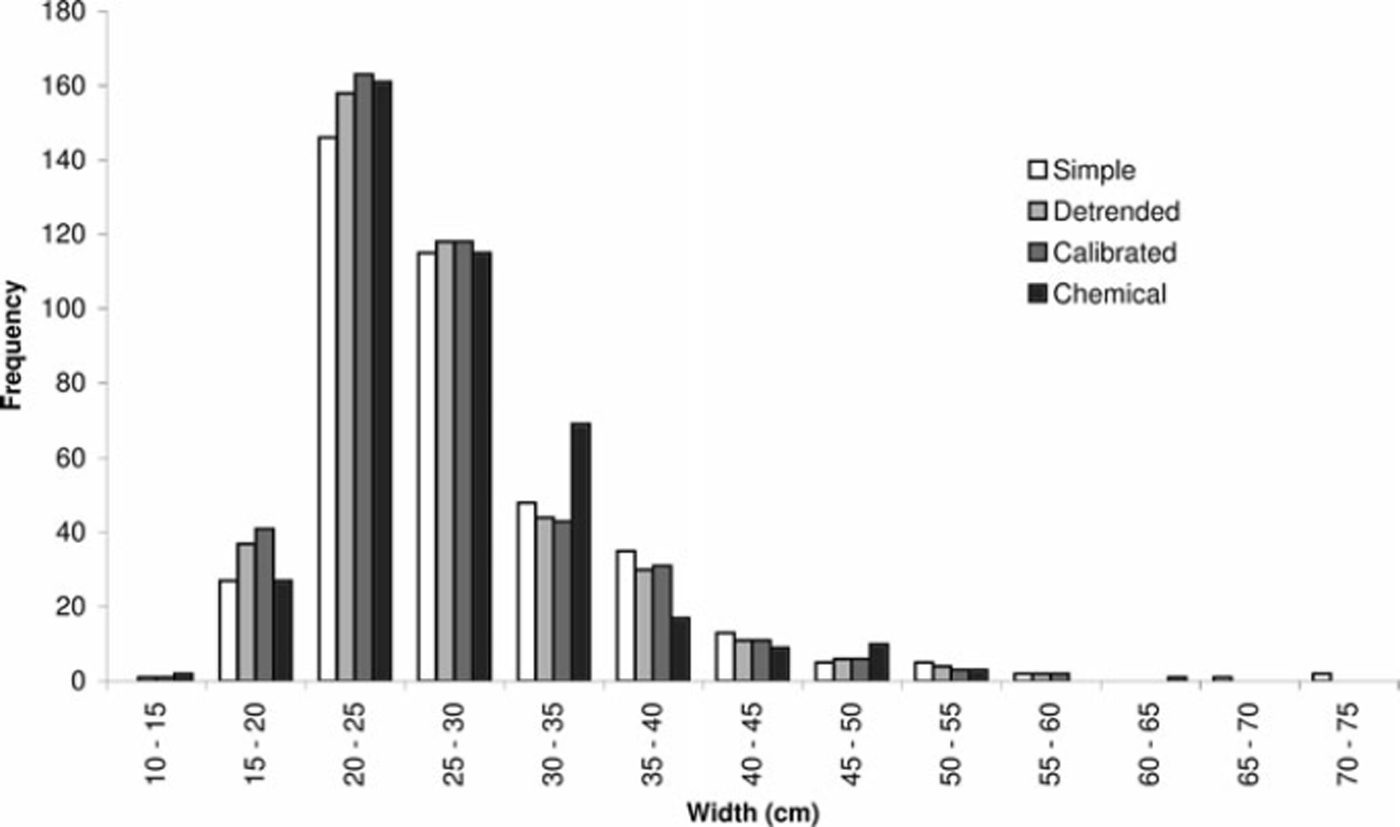
Fig. 7. Histogram of annual layer thicknesses resulting from the three techniques (simple: white; detrended: light gray; calibrated: dark gray; chemical interpretation: black).
Conclusion
This study demonstrated the ability of imagery from the NICL scanning system to identify annual cycles in shallow firn and ice retrieved from the WAIS Divide ice-core drilling project. It is notable that very good results were achieved, even though images were acquired of rough-out archive sections of the core with just one side cut and polished. Use of the archival slabs required far less processing and handling of the ice than prior efforts by Reference SvenssonSvensson and others (2005) and Reference Takata, Iizuka, Hondoh, Fujita, Fujii and ShojiTakata and others (2004). However, the archival cut may present more challenges in clearer deep ice, as the high degree of scattering in the firn helped to obscure artifacts from the cut.
Despite a high degree of intra-seasonal variation in ice brightness, the OVM method for modeling expected layer thickness demonstrated good agreement with the independent high-depth-resolution glaciochemical interpretation of the ice core. The detrended method for identifying annual layers without any direct calibration agreed to within 1% of the total number of years assigned by the chemical interpretation. For any annual cycle in the chemical interpretation, the detrended method provided a single proximate annual feature 95.8% of the time. It was also shown that the MOCOM method could modify the low-pass filter width to hit a target calibration date. In fact, the detrended method missed the Tambora eruption by only 1 year, so the test of the calibration method was not particularly challenging. One remarkable aspect of these results is that there was no use of direct human interpretation of the brightness cycles. The process of generating the dataset was automated to a large degree, and the dating method was entirely data-driven.
The method described here depended on characterizing a relationship between expected annual thickness and depth. While a simple power relationship was able to adequately characterize the varying density of this shallow core, application to deeper cores would likely require fitting to an accumulation/flow model. Discontinuities in climate regimes or errors in the accumulation/flow model would likely cause problems. It may be possible to develop measures of local image variance that would flag when image cycles diverge significantly from the model, or an adaptive technique might accommodate such situations. However, deeper ice would be expected to have fundamentally different light-scattering properties and it is unknown if this method would hold up at all. This is especially true in the Antarctic where accumulation rates and dust concentrations are low and deep ice is very clear. Despite these limitations, the strong agreement of this method with a well-defined glaciochemical interpretation provides confidence that automated optical dating can provide good results in shallow firn of the Antarctic.
Acknowledgements
This work was funded by grant OPP-0637004 of the US National Science Foundation (NSF) Office of Polar Programs (OPP) and relied on efforts and data collected by NSF OPP awards 0230149, 0440447, 0440817, 0440819, 0538427 and 0539578. The hardware system for optical imaging was constructed by G. Hargreaves of the US National Ice Core Laboratory. Special thanks to the US Geological Survey (USGS) personnel and interns of NICL in supporting this effort, including T. Hinkley and E. Cravens. Thanks to R. Edwards, T. Cox, A. Ellis and C. Fox for assistance in the Desert Research Institute ultra-trace ice-core laboratory. Thanks to M. Spencer of Pennsylvania State University. Thanks to J. Vrugt for sharing his MATLABTM version of the MOCOM code.


