1. Introduction
Turbulent flows over rough walls occur in many engineering applications and natural phenomena. The engineering challenge is to predict the increased drag due to the roughness for a given surface under operational conditions (Chung et al. Reference Chung, Hutchins, Schultz and Flack2021). In turbulence physics, extensive work has been conducted to elucidate the different phenomena and mechanisms between rough-wall turbulence and the traditional smooth-wall turbulent boundary layer (Raupach, Antonia & Rajagopalan Reference Raupach, Antonia and Rajagopalan1991; Krogstad, Antonia & Browne Reference Krogstad, Antonia and Browne1992; Jiménez Reference Jiménez2004; Volino, Schultz & Flack Reference Volino, Schultz and Flack2009; Hong, Katz & Schultz Reference Hong, Katz and Schultz2011; Mejia-Alvarez & Christensen Reference Mejia-Alvarez and Christensen2013; Squire et al. Reference Squire, Morrill-Winter, Hutchins, Schultz, Klewicki and Marusic2016). For instance, the existence of roughness can obviously modify the well-known near-wall dynamics of smooth-wall flow because of the effects of local surface conditions. Qualitatively, such effects generally include substantial modifications of the wall drag (viscous and pressure drag components) and the intensity of the turbulent velocity fluctuations and other physical quantities compared with the flow over a smooth wall. Nevertheless, the effect of roughness upon a turbulence structure is not well understood, particularly in the near-wall flows and outer-layer flows.
1.1. Outer-layer similarity
In studies of rough-wall turbulence, the existence of outer-layer similarity is a pivotal condition because the downward shift of the mean velocity profile is often associated with an increase in drag. Townsend (Reference Townsend1976) proposed a similarity hypothesis that the turbulent flow in the outer region is independent of the wall roughness and viscosity. Raupach et al. (Reference Raupach, Antonia and Rajagopalan1991) further extended this hypothesis – specifically, that the influence of roughness is mainly limited to the roughness sublayer, which only determines the wall friction velocity, the virtual origin offset, the flow within the roughness sublayer and the boundary layer thickness. The statistical characteristics of turbulence and flow structures in the outer region are not affected by wall roughness. Here, the roughness sublayer is defined as the region above the roughness, where turbulent motions are directly influenced by the roughness length scales and are generally considered to be within the wall-normal position approximately two to five times the roughness height from the surface. The definitions of different roughness forms differ somewhat (Busse, Thakkar & Sandham Reference Busse, Thakkar and Sandham2017; Forooghi et al. Reference Forooghi, Stroh, Schlatter and Frohnapfel2018; Yuan & Jouybari Reference Yuan and Jouybari2018).
Throughout the years, verification of the outer-layer similarity hypothesis has been controversial. For example, the results of experimental studies of rough-wall boundary layers (Krogstad et al. Reference Krogstad, Antonia and Browne1992; Tachie, Bergstrom & Balachandar Reference Tachie, Bergstrom and Balachandar2000; Volino et al. Reference Volino, Schultz and Flack2009) and the results of numerical simulations of turbulent channel flow (Leonardi et al. Reference Leonardi, Orlandi, Smalley, Djenidi and Antonia2003; Bhaganagar, Kim & Coleman Reference Bhaganagar, Kim and Coleman2004) and a turbulent boundary layer (Lee & Sung Reference Lee and Sung2007; Lee, Sung & Krogstad Reference Lee, Sung and Krogstad2011) all indicated substantial roughness effects in the outer region. On the contrary, various reports support the outer-layer similarity (Raupach & Shaw Reference Raupach and Shaw1982; Schultz & Flack Reference Schultz and Flack2007; Hong et al. Reference Hong, Katz and Schultz2011; Yuan & Piomelli Reference Yuan and Piomelli2014a; Squire et al. Reference Squire, Morrill-Winter, Hutchins, Schultz, Klewicki and Marusic2016; Chan et al. Reference Chan, MacDonald, Chung, Hutchins and Ooi2018). Jiménez (Reference Jiménez2004) stated that the conflicting views regarding the similarity hypothesis might be caused by the effect of the relative roughness on the flow and suggested that the ratio of the boundary layer thickness to the roughness height $\delta /k$ should be greater than 40 for the outer-layer similarity to be observed. Lee et al. (Reference Lee, Sung and Krogstad2011) summarized that the wall similarity and its necessary conditions might not be universal for the given flow types (Bakken et al. Reference Bakken, Krogstad, Ashrafian and Andersson2005; Flack, Schultz & Shapiro Reference Flack, Schultz and Shapiro2005) and that the wall similarity appears to be related to other factors (e.g. dimensions of roughness and geometric shape). Recently, Chan et al. (Reference Chan, MacDonald, Chung, Hutchins and Ooi2018) noted that the ratio between roughness streamwise and spanwise spacings and the boundary layer thickness are also important factors that can affect the outer-layer similarity.
Overall, the conditions under which the outer-layer similarity is applicable in rough-wall turbulence remain unclear. In addition, roughness effects on coherent structures of different flow layers are poorly understood. In the actual turbulent flow fields, strong nonlinear interscale interactions occur and become stronger with increasing Reynolds number. In particular, the discovery of the inner–outer-layer interactions between different scale motions (Mathis, Hutchins & Marusic Reference Mathis, Hutchins and Marusic2009; Marusic, Mathis & Hutchins Reference Marusic, Mathis and Hutchins2010; Talluru et al. Reference Talluru, Baidya, Hutchins and Marusic2014; Hwang et al. Reference Hwang, Lee, Sung and Zaki2016; Squire et al. Reference Squire, Morrill-Winter, Hutchins, Schultz, Klewicki and Marusic2016) further confirms that the large-scale and very-large-scale structures of an outer region can affect the near-wall turbulence. All of these findings challenge the outer-layer similarity theory of rough-wall turbulence. Whether and how the roughness changes the interactions between coherent structures with different scales are the starting points of the present paper.
1.2. Energy transfer
Many physical processes in wall turbulence are accompanied by energy transfer, and the wall roughness can affect the coherent structures and momentum transfer. The scale and spatial characteristics of the energy transfer process can differ appreciably from those in canonical wall-bounded turbulent flows. Therefore, the influence of roughness on outer-region flow can be explained by the energy transfer mechanism between the inner and outer regions.
Spectral analysis based on the two-point correlation function (Lumley Reference Lumley1964; Lee & Moser Reference Lee and Moser2015, Reference Lee and Moser2019; Mizuno Reference Mizuno2016; Cho, Hwang & Choi Reference Cho, Hwang and Choi2018) and the analysis of the structure function in physical space (Hill Reference Hill2002; Marati, Casciola & Piva Reference Marati, Casciola and Piva2004; Cimarelli, De Angelis & Casciola Reference Cimarelli, De Angelis and Casciola2013; Cimarelli et al. Reference Cimarelli, De Angelis, Jimenez and Casciola2016; Gatti et al. Reference Gatti, Chiarini, Cimarelli and Quadrio2020) are both effective tools to study the energy transfer in wall-bounded turbulent flows. The main idea in the former case is to investigate the production, diffusion and dissipation of turbulent kinetic energy and energy redistribution among the velocity components via the transport equation of the two-point velocity correlation (Lee & Moser Reference Lee and Moser2015; Mizuno Reference Mizuno2016). The description in the spectral space can provide the characteristics of energy transfer among different length scales in the streamwise and spanwise directions and among different flow regions in the wall-normal direction. Some important multiscale behaviours of turbulent flows can then be observed, such as the classical energy cascade from large to small scales and the inverse energy cascade from small to large scales. In the latter case, the second-order structure function of velocity fluctuations is equivalent to the kinetic energy of eddies with length scale $r$ in physical space; in addition, the transfer path of the scale energy, i.e. the amount of energy contained at certain scales as dictated by the second-order structure function, or scale-energy flux in the space composed of wall-parallel scales and wall-normal distance can be investigated by the generalized Kolmogorov equation (Marati et al. Reference Marati, Casciola and Piva2004; Cimarelli et al. Reference Cimarelli, De Angelis and Casciola2013, Reference Cimarelli, De Angelis, Jimenez and Casciola2016). The scale-energy path can supply the interscale energy transfer involving the wall-normal scale information, which cannot be realized in the spectral analysis because of wall-normal inhomogeneity.
As previously reviewed, considerable efforts have been devoted to understanding the energy transfer in classical smooth-wall turbulence, whereas few studies on the energy transfer process in the framework of rough-wall turbulence have been reported. For instance, Yuan & Piomelli (Reference Yuan and Piomelli2014b) investigated the energy transfer process between turbulent kinetic energy and roughness-induced wake kinetic energy within the roughness sublayer using the single-point Reynolds stress transport equation. However, their study lacked an analysis of the interscale energy transfer along different directions. More recently, the energy transfer of turbulent motions in the presence of surface waves was investigated through spectral analysis using the two-point correlation transport equation. Zhang, Huang & Xu (Reference Zhang, Huang and Xu2019) concluded that the wave-induced production provides additional input for the large-scale energy at low wave ages but plays the opposite role at high wave ages. Wang et al. (Reference Wang, Zhang, Hao, Huang, Shen, Xu and Zhang2020) found that surface waves carry a new energy source at the dominant wavelength scale in the near-surface region, which is mainly due to the contribution of the neighbouring streamwise turbulent motions, and those at the harmonic wavelength scales contribute the most. This paper enriches this research in rough-wall turbulence, providing a new perspective for gaining further insight into the outer-layer similarity failure.
The aim of the present work is to explore the effects of roughness on the outer-layer similarity of turbulence statistics and large-scale structures, and to investigate the turbulent energy transfer process. The roughness Reynolds number $k^{+}$ and the ratio of the roughness height to the half-channel height $k / \delta$ are systematically varied. Direct numerical simulations (DNSs) were performed for a fully developed turbulent channel flow with three-dimensional sinusoidal roughness. A triple decomposition was adopted to extract the mean, wave-induced and turbulent components of the flow field. The turbulent statistics for rough-wall cases, including the mean velocity profiles and velocity defects, stress profiles, energy spectra and instantaneous flow fields, were then examined and the results were compared with those for the smooth-wall cases. In addition, spectral analysis of the two-point correlation transport equation and the scale-energy path display of the generalized Kolmogorov equation were performed to reveal the underlying mechanism by which roughness affects the overlying turbulent flow at different length scales and vertical positions. The paper is organized as follows: the problem formulation and numerical method are briefly introduced in § 2. Roughness effects on turbulence statistics and large-scale structures, along with detailed analyses of the turbulent energy transfer process, are discussed in § 3. Finally, conclusions are drawn in § 4.
2. Problem formulation
The problem considered here is a fully developed turbulent channel flow over rough walls. The rough surface consists of three-dimensional sinusoidal roughness elements according to
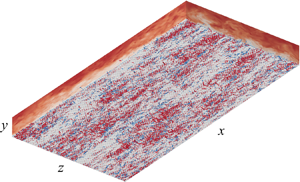
where $\eta _{d}$ is the rough surface elevation, $k$ is the semi-amplitude and $\lambda$ is the wavelength of the roughness elements. A schematic of the computational domain and coordinate system is shown in figure 1. We adopt a Cartesian frame fixed in the physical space, with $x$, $y$ and $z$ denoting the streamwise, vertical and spanwise coordinates, respectively. The corresponding velocity components in the three directions are $u$, $v$ and $w$, respectively. The flow is driven by a mean pressure gradient that is dynamically adjusted to maintain a strictly constant flow rate over time. The governing equations for the turbulent flow are the dimensionless incompressible Navier–Stokes equations and the continuity equation
where ${{u}_{i}}( i=1,2,3 )=( u,v,w )$ are the velocity components in the three directions ${x_{i}}( i=1,2,3 )=( x,y,z )$, $p$ is the pressure and $Re_b$ is the bulk Reynolds number. The governing equations are non-dimensionalized using the bulk velocity $U_b$, fluid density $\rho$, half-channel height $\delta$ and the kinematic viscosity $\nu$ as the characteristic quantities. The governing equations (2.2) and (2.3) are transformed into the computational domain by introducing an algebraic mapping
where $\xi _{1}$, $\xi _{2}$, $\xi _{3}$ and $\tau$ are the space and time coordinates in the computational domain. Periodic boundary conditions are imposed on the streamwise and spanwise directions, and the walls of the channel are no slip. For spatial discretization, we use a pseudo-spectral method along the transformed horizontal coordinates. In the transformed vertical direction, a second-order finite difference method is used on a staggered grid. The third-order time-splitting method is adopted for time advancement. Further details of the numerical method can be found in Ge, Xu & Cui (Reference Ge, Xu and Cui2010).
The flow and roughness parameters for all of the rough cases simulated are summarized in Table 1. The superscript ‘$+$’ denotes physical quantities normalized by the friction velocity $u_\tau$ and the wall viscous length scale $\delta _\nu$ ($\delta _\nu =\nu / u_\tau$). In the present study, two groups of numerical cases were simulated: (i) group A, in which the friction Reynolds number $Re_\tau$ is varied while $k^+$ is kept constant; (ii) group B, in which $Re_\tau$ is varied while $k/ \delta$ is kept constant. For group A, as the roughness elements have the same viscous scale, the physical geometrical size of the roughness element relative to the half-channel height reduces with increasing Reynolds number. For group B, all cases have the same physical geometrical size, and the viscous scale increases proportionally with the friction Reynolds number. For comparison, the simulation of full-channel flow over a smooth wall at the corresponding Reynolds numbers were also carried out. The dimensions of the computational domain are ${{L}_{x}}\times {{L}_{y}}\times {{L}_{z}}=2{\rm \pi} \delta \times 2\delta \times {\rm \pi}\delta$, and the corresponding grid number increases with the Reynolds number. The grid points in the streamwise and spanwise directions are uniform, and follow a cosine distribution in the vertical direction. Note that the grid resolution needs to meet the DNS requirements and ensure the smooth recognition of the roughness elements.
3. Results and discussion
3.1. Mean velocity profiles
In §§ 3.1 and 3.2, we mainly investigate the roughness effects on turbulence statistics. The effect of roughness elements on wall resistance is directly reflected in the variation of the mean velocity profile. Figure 2 shows the mean streamwise velocity profiles and velocity defects in semi-logarithmic coordinates. The mean velocity profiles are computed by ensemble average, including temporal and spatial averages. Different from the intrinsic and superficial averages on the Cartesian grid (Nikora et al. Reference Nikora, McEwan, McLean, Coleman, Pokrajac and Walters2007), the spatial average here is performed along the $\xi _{1}$ and $\xi _{3}$ directions in the curvilinear coordinate system, at each layer of grid corresponding to the mean vertical distance from the rough surface ($\bar {y}$). Regarding the selection of the virtual origin, Chan et al. (Reference Chan, MacDonald, Chung, Hutchins and Ooi2015) tested various methods and obtained the most consistently reliable estimation of the virtual origin by collapsing the total stress profile outside the roughness layer. According to their results, the zero-plane displacement is approximately equal to the mean height of rough surface. Therefore, $y=0$ is employed as the virtual origin of the bottom wall for the present rough-wall cases. The velocity profiles still satisfy the logarithmic law in the presence of the roughness elements; however, a downward shift arises with respect to the results for the smooth wall, which is known as the Hama roughness function (Hama Reference Hama1954) and is represented by $\Delta U^{+}$. The logarithmic law for the rough wall can be expressed as
where the subscript $r$ indicates the rough-wall case, $\kappa \approx 0.40$ is the von Kármán constant, $C \approx 5.3$ is the offset constant and $\Delta U^{+}$ reflects the increase in wall friction drag, which is closely related to practical applications. All the mean velocity profiles with different rough conditions follow a logarithmic variation beyond a certain normal position. Therefore, from the perspective of first-order statistics, the hypothesis of outer-layer similarity (Townsend Reference Townsend1976) is still retained for rough-wall flows. For group A, the mean velocity profiles basically coincide, appearing to be independent of the Reynolds number. However, for group B, the mean velocity profiles are shifted downward with increasing the Reynolds number; that is, $\Delta U^{+}$ is a function of the viscous-scaled roughness height $k^+$ and is independent of the friction Reynolds number, consistent with the conclusion of Zhang, Huang & Xu (Reference Zhang, Huang and Xu2020). Note that the current rough-wall cases keep the other roughness parameters unchanged, except $k^+$. In fact, the previous studies have reported that the roughness function is also closely related to different roughness parameters, e.g. the roughness steepness (Napoli, Armenio & De Marchis Reference Napoli, Armenio and De Marchis2008; Ma et al. Reference Ma, Xu, Sung and Huang2020), anisotropy (Busse & Jelly Reference Busse and Jelly2020) and skewness (Flack, Schultz & Barros Reference Flack, Schultz and Barros2020). By plotting the velocity defect in figure 2(c,d), we observe that the profiles for groups A and B are self-similar in the outer layer. In addition, a good collapse is also observed in the inner layer for group B except at $Re_\tau =180$, which differs from the results for group A. This phenomenon indicates that $k/\delta$ plays a more important role in determining the velocity defect; that is, the same physical model of roughness elements will show the velocity defect profile collapse as the Reynolds number increases.
3.2. Profiles of dispersive and Reynolds stresses
In a rough-wall turbulent flow, we must consider the effect of rough spatial geometry on turbulence statistics. To this end, a triple decomposition method can be applied to decompose the instantaneous velocity into three components (Reynolds & Hussain Reference Reynolds and Hussain1972)
where $\bar {u}_{i}$ denotes the time and $\xi _{2}$-plane average, $\langle u_{i}\rangle$ denotes the phase-averaged component and $\tilde {u}_{i}$ and $u_{i}^{\prime }$ denote the wave-induced and turbulent fluctuations, respectively. Accordingly, the second-order velocity correlation can be decomposed into the mean, dispersive and Reynolds stresses as follows:
Figure 3 shows the profiles of the Reynolds stresses against the wall-normal height normalized by the half-channel height $\bar {y}/ \delta$ for group A. As shown in figure 3(a), the roughness elements elevate the inner peak location where the near-wall cycle occupies, compared with the smooth-wall results. The inner peak intensity of the streamwise Reynolds stress decreases, indicating that the typical coherent structures near the wall are disrupted by roughness and that the turbulent fluctuations are weakened. Even so, the Reynolds number effect still exists and the inner peak intensity increases with increasing Reynolds number. Different from the streamwise component, the spanwise Reynolds stress is larger than the smooth-wall results, especially in the near-wall region, whereas the vertical Reynolds stress and Reynolds shear stress are marginally affected by roughness. The peak locations of these three components are basically unchanged as compared with those of the smooth-wall case. A good collapse in the outer region of the flow is not obtained for the streamwise Reynolds stress profiles, especially for $Re_\tau =1080$. In this region, the profiles demonstrate a shoulder lifting phenomenon. The streamwise Reynolds stress increases with the presence of roughness and the outer-layer similarity fails. In the current context, the term ‘outer region’ is used to denote where the rough-wall turbulence statistics collapse well to the smooth-wall cases, such as the Reynolds stresses and the energy spectra. However, for the vertical and spanwise Reynolds stresses and Reynolds shear stress, remarkable collapses are still observed in the outer region ($\bar {y}/ \delta >0.4$) at all the Reynolds numbers considered here.
Similarly, figure 4 shows the profiles of the Reynolds stresses against $\bar {y}/ \delta$ for group B. As seen in figure 4(a), the inner peak intensity of the streamwise Reynolds stress decreases with increasing $k^+$, which indicates that a larger roughness viscous scale causes more significant suppression of the inner-layer turbulence and results in weakened turbulent fluctuations. The peak locations are invariant with the Reynolds number except at $Re_\tau =180$, unlike those of group A. In the outer region, the profiles collapse with the smooth-wall case at higher vertical positions ($\bar {y}/ \delta >0.7$), supporting the Townsend's outer-layer similarity hypothesis. For the vertical and spanwise Reynolds stresses, the peaks exhibit an extrapolation tendency with increasing Reynolds numbers and an obvious bimodal phenomenon is observed at higher Reynolds numbers. The difference is that the first peak of spanwise Reynolds stress appears below the roughness height and the value tends to the second peak value; by contrast, the two peak locations of vertical Reynolds stress are above the roughness crest and the first peak value is obviously larger than the second one at $Re_\tau =1080$. For the Reynolds shear stress, the peak location is pushed to higher vertical positions; however, the intensity increases slightly with increasing Reynolds number. Some negative regions occur at $\bar {y}^{+}<10$, and this phenomenon becomes more obvious with increasing $k^+$. This result is mainly related to the backflow within the roughness elements. In the outer region, the vertical and spanwise Reynolds stresses and the Reynolds shear stress profiles of both the smooth-wall and rough-wall cases are self-similar. The initial locations for the profile collapse are slightly different.
The dispersive stresses profiles for groups A and B are plotted in figure 5. For the smooth-wall cases, the dispersive stresses are zero. For the rough-wall cases, the intensity of the streamwise dispersive stress is clearly substantial, even greater than the intensity of its turbulent counterpart. By contrast, the intensities of the dispersive stresses of other components are obviously weaker than those of the corresponding Reynolds stresses. For group A, the profiles are independent of the Reynolds number, except the locations that are closely related to $k/\delta$. This indicates that the dispersive stresses are mainly affected by the roughness height $k^+$, similar to the mean velocity profiles. Coincidentally, Zhang et al. (Reference Zhang, Huang and Xu2020) found that the roughness-induced velocity fluctuations and pressure fluctuations both show Reynolds number independence if the roughness element has the same $k^+$. In addition, the dispersive stresses are dominant within the roughness sublayer but decrease rapidly to zero above the crest of roughness element. The vertical and spanwise dispersive stresses achieve their peak values below the roughness crest, and the peak location of streamwise stress is slightly higher ($\bar {y}/ \delta \approx k/\delta$). The dispersive shear stress is negative in the inner-layer region and exhibits two weak peaks. For group B, the dispersive stresses profiles show an inward shift as the Reynolds number increases, although $k/ \delta$ remains the same. Above the roughness crest, the profiles decrease drastically to zero. The maximum values of the streamwise dispersive stress and shear stress do not show a monotonic variation, whereas the maximum values of the vertical and spanwise components increase substantially with increasing $k^+$.
To further compare the effect of $k^+$ on the turbulence statistics in the inner and outer regions at the same Reynolds number, we added some rough cases in figure 6 with rearrangement. The variation of the streamwise Reynolds stress in the outer region by increasing $k^+$ is non-monotonic at $Re_\tau =720$; first increasing and then decreasing. Turbulent fluctuations are enhanced in the outer region for the cases of $k^+= 10$ and 13.33, whereas a good collapse between the smooth- and rough-wall profiles is observed for the cases of $k^+= 6.67$ and 40. Unlike $Re_\tau =720$, the streamwise Reynolds stress in the outer region monotonically decreases with increasing $k^+$ at $Re_\tau =1080$. The effect of roughness on the outer-layer similarity may be induced by different mechanisms for small and large $k^+$, if $k/ \delta$ is small but $Re_\tau$ is high.
In addition, a quantitative evaluation of the collapse degree of the velocity defect and streamwise Reynolds stress profiles can be made by introducing the deviation factor as in Squire et al. (Reference Squire, Morrill-Winter, Hutchins, Schultz, Klewicki and Marusic2016). The deviation factor is obtained by calculating the maximum relative deviations in the height range $\bar {y}/\delta =0.5 \sim 1.0$. For the streamwise velocity defect profiles (figure 2c,d), the deviation factor is 0.11 $\%$ for $k^+=10$ and 0.35 $\%$ for $k^+=60$ at $Re_\tau =1080$, indicating that the hypothesis of outer-layer similarity holds for both the small- and large-scale roughness elements with respect to the first-order statistics. For the streamwise Reynolds stress profiles (figure 6), the deviation factor is 2.7 $\%$ for $k^+=6.67$ and 3.2 $\%$ for $k^+=40$ at $Re_\tau =720$, and 8.21 $\%$ for $k^+=10$ and 4.43 $\%$ for $k^+=60$ at $Re_\tau =1080$. A value of 5 $\%$ as suggested by Squire et al. (Reference Squire, Morrill-Winter, Hutchins, Schultz, Klewicki and Marusic2016) is a reasonable criterion, such that the outer-layer similarity is applied for both the small- and large-scale roughness elements at $Re_\tau =720$ and for $k^+=60$ at $Re_\tau =1080$, but not for $k^+=10$ at $Re_\tau =1080$.
The previous analysis indicates that the outer-layer similarity is closely related to the roughness parameters, especially when obvious scale separation occurs at high Reynolds numbers. Although $k^+=10$ corresponds to a smaller $k/ \delta$, the outer-layer similarity of streamwise Reynolds stress is lost, which is inconsistent with the conclusion of Jiménez (Reference Jiménez2004). As reviewed by Chung et al. (Reference Chung, Hutchins, Schultz and Flack2021), a single scale $k/ \delta$ is insufficient to fully describe the influence of roughness topography on turbulent flows. Several previous studies on rough-wall turbulence have shown that the outer-layer similarity failure might be caused by the enhancement of scale interaction between the inner and outer regions (Hong et al. Reference Hong, Katz and Schultz2011; Yuan & Piomelli Reference Yuan and Piomelli2014b). For instance, Hong et al. (Reference Hong, Katz and Schultz2011) observed that the roughness-scale eddies are generated near the surface and are then advected rapidly away from the wall by large-scale structures that populate the outer layer in the experiments involving rough boundary layers. Consequently, the outer-region turbulent motions are enhanced. However, this explanation is presently speculative; we will further analyse the specific reason by examining the energy transfer process between different spatial locations and different scales in the following sections.
3.3. Large-scale flow structures
This section mainly describes the effects of roughness on the large-scale structures of the outer region. We begin by examining the energy distribution at different length scales and vertical locations. One-dimensional pre-multiplied streamwise and spanwise energy spectra of streamwise velocity turbulent fluctuation are plotted in figure 7 for two rough-wall cases ($k^+=10$ and 60), together with the smooth-wall case at $Re_\tau =1080$. For the smooth-wall case, two peaks are observed in the spanwise energy spectra of the streamwise velocity fluctuation that correspond to the inner/outer scale separation in high Reynolds number wall turbulence. The inner peak is located at the scale around $\lambda _z^{+}\approx 130$, which corresponds to the spacing of near-wall low-speed streaks. The outer peak is located at the scale around $\lambda _z^{+}\approx 1120$, which represents the turbulent large-scale motions in the outer region. For the rough-wall results, the main wavenumber and its harmonics caused by roughness periodicity still exist in the streamwise energy spectra but obviously no longer exist in the spanwise energy spectra. The effect of roughness on the energy spectra is mainly concentrated below the height of the roughness elements as compared with the smooth-wall case, which becomes more obvious with increasing roughness height $k^+$. For the inner peak, the roughness elements elevate the peak locations of the streamwise and spanwise energy spectra, which approximately satisfy $y_{p,r}^{+} \approx y_{p,s}^{+}+k^+$, where $y_{p,r}^{+}$ and $y_{p,s}^{+}$ represent the vertical heights of the inner peaks in the rough-wall and smooth-wall cases, respectively. As the roughness height $k^+$ increases, the corresponding peak values are weakened more substantially, consistent with the changes shown in the stress profiles. For the outer peak, the roughness $k^+=10$, $\lambda ^+=71$ enhances the large-scale structures and the spanwise length scale of the peak increases ($\lambda _z^+ \approx 1695$); by contrast, the roughness $k^+=60$, $\lambda ^+=424$ reduces the outer peak in energy and the length scale ($\lambda _z^+ \approx 850$) is smaller than the smooth-wall result ($\lambda _z^+ \approx 1120$). Roughness of different viscous scales might have different effects on the turbulent energy transport between the roughness sublayer and the outer layer. In the spanwise energy spectra, the contours of rough-wall cases become coincident with the smooth-wall result in the outer region. This observation indicates that a much higher vertical height is required for the energy spectra to satisfy the self-similarity in the outer region, as compared with the mean velocity and second-order statistics.
Figure 8 displays the one-dimensional pre-multiplied spanwise energy spectra of vertical velocity and spanwise velocity turbulent fluctuations and shear stress. The selected cases are the same as those in figure 7. For the vertical component, little difference is observed between the rough-wall ($k^+=10$) and smooth-wall cases. By contrast, the energy spectra vary greatly below the roughness height for the case of $k^+=60$ and energy tends to be distributed at larger scales. For the spanwise component, when the roughness height is $k^+=10$, part of the extra energy region is observed in the energy spectra as compared with the smooth-wall results. When $k^+$ increases to 60, two peaks are observed in the spanwise energy spectra; these peaks approximately correspond to the wall-normal heights of 10 and 100, respectively. The bimodal characteristics of the spanwise stress profile (figure 4c) are consistent with this phenomenon. However, for both roughness heights, the rough-wall contours of $k_z E_{v^{\prime }v^{\prime }}^{+}$ and $k_z E_{w^{\prime }w^{\prime }}^{+}$ both collapse to the smooth-wall cases in the outer region. Finally, in the spanwise energy spectra of shear stress, the overall variation trend is similar to the streamwise component. The peak energy in the outer region is increased, and the corresponding spanwise length scale is also increased for the small roughness height ($k^+=10$). On the contrary, the large-scale peak decreases when the roughness height increases.
In addition, the instantaneous flow field in the $y$–$z$ plane at a certain streamwise location is shown in figure 9 to visually describe the large-scale structures. The two rough-wall cases of $k^+= 10$ and 60 at $Re_\tau =1080$ are chosen. We intuitively observe that, as compared with the large roughness ($k^+=60$), the small roughness ($k^+=10$) affects the higher vertical position for both the streamwise turbulent velocity fluctuation and the pressure fluctuation. Although the large roughness induces large pressure drag, the pressure distribution is mainly concentrated near the roughness element and does not affect the outer region. Such difference is caused by the pressure-strain terms and the transport terms of the Reynolds stresses transport equations, which will be discussed in detail in the following section.
Figure 10 displays the instantaneous flow field in the $x$–$z$ plane. Corresponding to the analysis of energy spectra, two vertical locations $\bar {y}/\delta =0.03$ in the inner region and $\bar {y}/\delta =0.3$ in the outer region are chosen. The streaky structures in the near-wall region are substantially disrupted because of the presence of roughness elements, especially for the large roughness height (figure 10b). The intensity of the velocity streaks is obviously diminished, consistent with the decrease of the inner peak of the energy spectra (figure 7). The modulation effects of roughness wavelengths can be discerned clearly for $k^+=10$, as also reflected in the roughness scale of the streamwise energy spectra. The large-scale streamwise elongated low- and high-speed streaks are observed in the outer region, and the large-scale structures at small roughness height are more coherent than the case of $k^+=60$. Two pairs of low- and high-speed streaks are clearly identified for $k^+=10$, and the spanwise spacing is approximately $\lambda _z=L_z/2={\rm \pi} /2$, corresponding to the outer peak of the spanwise energy spectra locating at the scale of $\lambda _z^{+} \approx 1695$. The turbulent coherent structures of the instantaneous flow field are consistent with the spanwise energy spectra.
3.4. Spectral analysis on the transport equation of two-point velocity correlation
To reveal the mechanism by which the roughness affects the outer-layer similarity, we resort to the transport equation of two-point velocity correlation in the curvilinear coordinates and analyse the energy transfer process in the presence of roughness. Derivation of the transport equation and its spectral expression can be found in Wang et al. (Reference Wang, Zhang, Hao, Huang, Shen, Xu and Zhang2020). We here replace the classic Reynolds decomposition with the triple decomposition according to (3.2). The transport equation can be expressed as
where the subscript $r$ represents the quantity at the location with a certain distance in the spanwise direction from the reference point. The terms on the right-hand side correspond to the production, pressure-strain, turbulent transport, pressure transport, viscous transport, dissipation, wave-induced production terms and additional terms related to the effects of boundary deformation on the mean flow, sequentially. The specific expression for each term is provided in Appendix A.
Figure 11 shows the premultiplied one-dimensional spanwise spectra of the production and pressure-strain terms. For the smooth-wall case (figure 11a), the spectrum of the production term of $\overline {u^{\prime }u^{\prime }}$ has two peaks, with the inner peak located at the scale $\lambda _z^{+}\approx 100$ and the indistinct outer peak located at $\lambda _z^{+}\approx 1000$. The intensity and scale of the outer peaks increase for the rough-wall case of $k^+=10$ as compared with the intensity and scale of the outer peaks for smooth-wall turbulence. However, the outer peaks are weakened and their length scale is reduced for the rough-wall case of $k^+=60$. In the spectra of the production term of $\overline {u^{\prime }v^{\prime }}$ (figure 11d), the outer peak almost disappears for both the rough-wall and smooth-wall cases. The production term $P_{11}$ provides the increased large-scale streamwise Reynolds stress (figure 3a) in the outer region, which is obtained from the mean shear flow. In addition, there is no production term in the transport equations of the vertical and spanwise components, which gain energy from the streamwise component via the pressure-strain term. For the smooth-wall case (figure 11b), the pressure-strain term $\varPi _{s,22}$ transfers the energy from $\overline {v^{\prime }v^{\prime }}$ to the other two components within the region $\bar {y}^+<10$; in the region $\bar {y}^+ \geq$10, the energy is reversely transferred to $\overline {v^{\prime }v^{\prime }}$. The large roughness of $k^+=60$ enhances the energy transfer from $\overline {v^{\prime }v^{\prime }}$ below the roughness height, leading to the increase of spanwise velocity fluctuations. This behaviour also explains the bimodal phenomenon of the spanwise energy spectra (figure 8b). In the spectra in figure 11(c), the pressure-strain term $\varPi _{s,33}$ indicates that $\overline {w^{\prime }w^{\prime }}$ mainly gains energy from other components. An additional positive contribution can be observed below the roughness height for the case of $k^+=10$ as compared with the smooth-wall case. This corresponds to the variation of $\overline {w^{\prime }w^{\prime }}$ in the near-wall region in figure 3(c). In the case of $k^+=60$, an obvious difference lies in the increase of the negative contribution region in the vicinity of the roughness crest. At this location, $\overline {w^{\prime }w^{\prime }}$ outputs energy to the other components, which corresponds to a weaker peak than that in the smooth-wall case (figure 4c). The results show that the roughness strengthens the energy transfer via the pressure-strain terms among the three velocity components.
In addition, figure 12 shows the pre-multiplied one-dimensional spanwise spectra of the dissipation terms, which make negative contributions to the Reynolds stresses. For the smooth-wall case, the dissipation terms are concentrated on small scales ($\lambda _z^{+}<100$) in the inner region ($y^{+}\approx 20$). With the increase of wall-normal distance, the dissipation terms decrease. For the case of $k^+=10$, the presence of roughness generates more small-scale eddies, which strengthens the dissipation. On the contrary, a large roughness $k^+=60$ weakens the dissipation significantly. A possible reason for such a difference is that $k^+=10$ corresponds to the transitionally rough regime and the near-wall self-sustaining cycle of turbulence is enhanced, whereas $k^+=60$ is close to the fully rough regime and the near-wall self-sustaining cycle is significantly disrupted (MacDonald et al. Reference MacDonald, Chan, Chung, Hutchins and Ooi2016). For the spanwise component (figure 12c), the dissipation is obviously increased both above and below the roughness crest, as compared with the smooth-wall case. On the other hand, for the vertical and shear stress component (figure 12b,d), the dissipation terms are marginally affected by the roughness. Moreover, the peak locations of the dissipation terms are elevated in the presence of large-scale roughness ($k^+=60$).
Figure 13 shows the premultiplied one-dimensional spanwise spectra of the wave-induced production terms, which represent the energy exchange between the Reynolds stresses and the dispersive stresses. Thus, the variation trend of the spectra of the wave-induced production terms $WP_{ij}$ with respect to the vertical height is closely related to the profiles of the dispersive stresses in figure 5. For the smooth-wall case, $WP_{ij}$ values are zero. The results show that the contributions of the wave-induced production terms are mainly confined to within the roughness sublayer and are concentrated at roughness scales such as $WP_{11,ux}$ in figure 13(a). Although the magnitudes of the wave-induced production terms are smaller than those of the production terms, they provide energy input to roughness scales, showing the roughness-scale peaks in the streamwise energy spectra (figure 7a,c). In addition, $WP_{11,ux}$ and $WP_{12,vx}$ weakly contribute to large scales in the inner region, corresponding to the near-wall large-scale streaky structures (figure 10a,b) because of the modulation effect of roughness. Meanwhile, the intensity and vertical height in the case of $k^+=60$ are obviously greater than those in the case of $k^+=10$, which is consistent with the dispersive stresses profiles. Note that only the dominant terms are presented in figure 13. For example, other two components of $WP_{12}$ are at least one order of magnitude smaller than $WP_{12,vx}$ (not shown here). The aforementioned spectral analysis representing the wave-induced production terms provides an additional mechanism by which energy is gained or lost from the mean flow for the large scales in the inner region, but not in the outer region.
The turbulent transport term can be decomposed into two parts, representing the spatial turbulent transport and interscale turbulent transport, respectively,
For the smooth-wall turbulence, the spatial turbulent transport term is the greatest contributor to the total energy diffusion. Energy is transferred from the buffer region to the inner and outer regions. The presence of small roughness $k^+=10$ weakens energy transfer through spatial turbulent transport (figure 14a), and large roughness $k^+=60$ has almost destroyed this transport mechanism. A similar phenomenon also occurs in the viscous transport term (figure 14d). The contribution from $T_{\nu,11}$ to the total energy transport drastically decreases because of the apparent destruction of the near-wall self-sustaining cycle in the inner region. Moreover, unlike the effect of the spatial turbulent transport, that of the viscous transport is confined to the region of $\bar {y}^+<20$. In addition to the contributions of the turbulent and viscous transport terms, the contribution of pressure transport terms to the total energy diffusion is also shown in figure 14(c). The pressure transport direction is consistent with the viscous term; however, its effect does not reach the near-wall region. The energy gain is substantially enhanced due to the presence of large roughness below the roughness height. By contrast, for $k^+=10$, the pressure transport term increases in the outer region. The spectra of the interscale energy transport term are shown in figure 14(b). A negative peak region is located at $\lambda _z^+ \approx 100$, which corresponds to the typical spanwise scale of low-speed streaks. Energy is transferred to both smaller- and larger-scale motions in the buffer region, representing the well-known energy cascade and inverse energy cascade processes, respectively. However, this inverse phenomenon disappears again in the rough-wall case. An obvious change occurs in the outer region, where the spectra of $T_{t,11}^{xz}$ are significantly stronger at the spanwise scale of $\lambda _z^{+} \approx 1600$. The variations of the pressure transport, the spatial turbulent transport and the interscale turbulent transport terms correspond to the contributions of the production term in figure 11(a) for the two rough-wall cases and the smooth-wall case.
3.5. Scale-energy paths on the generalized Kolmogorov equation
The previously discussed spectral analysis did not include the energy transfer of the vertical scales because of spatial inhomogeneity in the wall-parallel directions. Here, we apply the generalized Kolmogorov equation to investigate the scale dependence of energy transfer in the reduced space of vertical and spanwise scales and the vertical direction. The generalized Kolmogorov equation is an exact budget equation for the second-order structure function tensor, and describes the production, transport and dissipation of the scale energy in the combined physical and scale space. Moreover, the generalized Kolmogorov equation, unlike the above spectral analysis, can properly define the concept of scale in the inhomogeneous wall-normal direction. Hill (Reference Hill2002) first derived the generalized Kolmogorov equation, and Gatti et al. (Reference Gatti, Chiarini, Cimarelli and Quadrio2020) further extended it to the anisotropic case. Here, we rewrite the equation in the curvilinear coordinates as follows:
where $\langle \delta u_{i}^{\prime } \delta u_{j}^{\prime }\rangle$ denotes the second-order structure function, also known as the scale energy; $u_{i}^{\prime }$ represents the turbulent fluctuations after the triple decomposition, which is consistent with the previous sections; $\delta u_{i}^{\prime }$ is the difference in $u_{i}^{\prime }$ between two points identified by their midpoint $\overline {\xi _i}$ and the separation distance $r_{\xi _i}$; $\varphi _{i j, k}$ denotes the fluxes of the scale energy in the space of scales $r_{\xi _k}(k=1,2,3)$; $\psi _{i j, k}$ denotes the fluxes in the space of positions $X_{\xi _k}(k=1,2,3)$; and the right-hand side $\zeta _{i j}$ denotes the source term that describes the net production of the scale energy in space and among scales. See Appendix B for specific expressions of each term.
Figure 15 shows the distributions of scale-energy fluxes in ($r_{\xi _2},r_{\xi _3},X_{\xi _2}$) space for the rough-wall cases $k^+=10$ and 60 and the smooth-wall case at $Re_\tau =1080$. The path lines are coloured according to the magnitude of the flux, here the path lines denote the field lines of the flux vector field ($\phi _{r_{\xi _2}},\phi _{r_{\xi _3}},\phi _{X_{\xi _2}}$). For the smooth-wall turbulence in figure 15(e,f), the overall variation trend is that the scale-energy flux path starts from vicinity of the wall at $r_{\xi _2}=0$ and corresponds in position to the self-sustaining cycle of near-wall turbulence. The spanwise scale $r_{\xi _3}$ and vertical scale $r_{\xi _2}$ both increase together with increasing vertical distance $\overline {\xi _2}$. Above the buffer region, part of energy path leaves the attached-scale plane and exhibits a spiral-like increase; the remainder of the path continues to follow the attached-scale plane but finally ends at small dissipative scales. This trend is consistent with the description of the scale-energy path at $Re_\tau =2000$, as reported by Cimarelli et al. (Reference Cimarelli, De Angelis, Jimenez and Casciola2016), who provided an overall image of the energy transfer of the inner–outer interaction model. The existence of small-scale roughness $k^+=10$ increases the energy flux from the small scale to the large scale, as marked by the red box in figure 15(a). After the spanwise scale and the vertical scale increase to a certain value, this part of increased energy path leaves the attachment scale plane and rises to a higher vertical position. Simultaneously, the spanwise scale decreases (figure 15b), corresponding to the interscale transport spectral analysis. The energy output from the large scales in the outer region increases (figure 14b). However, for the large-scale roughness $k^+=60$ in figure 15(c), the scale-energy source term is weakened by the destruction of the near-wall self-sustaining process; thus, the field line of the scale-energy flux ($\varphi _{r_{\xi _2}},\varphi _{r_{\xi _3}},\varphi _{X_{\xi _2}}$) starting from the near-wall region is substantially reduced as compared with the smooth-wall case. The spanwise length scale of the scale-energy flux is still large when approaching the channel centre (figure 15d), which corresponds to the weakening of the positive energy cascade process. As a consequence, the energy transfer from large scales to small scales might be weakened.
Notably, although the large-scale roughness weakens the inverse turbulent energy cascade in the inner region, the profiles of the Reynolds stresses still satisfy the outer-layer similarity (figure 4a). Cho et al. (Reference Cho, Hwang and Choi2018) confirmed that the dominant energy transfer mechanism in wall turbulence is the classical energy cascade, even if the inverse energy cascade process is interrupted. The turbulence statistics of the outer region are not dramatically affected, consistent with the present findings related to rough-wall turbulence. Compared with its ability to display the energy transfer process in spectral space, the scale-energy path can display the energy transfer process better in physical space among different flow regions and scales. However, it cannot distinguish the specific source of energy flux, such as the pressure effect or viscosity effect; thus, the physical meaning is not clearly revealed as done in the previous section by using the transport equation of the two-point velocity correlation.
As a summary, the energy transport process including the spatial and interscale energy transports is sketched in figure 16. The scale-energy flux starts from the energy source term in the near-surface region and increases the spanwise scale and vertical scale following the attached-scale plane. The production term is very active along this line, and the intensity of the flux increases. The existence of small-scale roughness strengthens the energy transfer from small scales to large scales in this region, corresponding to the variation of the interscale turbulent transport term $T_{t,11}^{xz}$ in figure 14(b) and the energy flux field line in the near-wall region; by contrast, the effect of large-scale roughness is the opposite. As the spanwise scale and vertical scale continue to increase, the wave-induced production term inputs energy to the large-scale structures of the roughness sublayer, corresponding to the increase of the flux field lines ascending to higher vertical positions, whereas large-scale structures of the outer region mainly gain energy from the mean flow by the turbulent production term (figure 11a) and this corresponds to the increase of the flux field lines ascending to higher vertical positions. The wave-induced production term due to large-scale roughness contributes mainly to the roughness sublayer; however, the turbulent production term is weakened in the outer region. When the vertical height $\bar {y}^+$ is greater than 300, the spanwise scale of the scale energy decreases and the vertical scale continues to increase. At this time, part of the energy flux field lines begins to develop upward from the attached-scale plane. This process is also reflected in the spanwise energy spectra of the interscale turbulent transport term $T_{t,11}^{xz}$ in figure 14(b) (i.e. the positive energy cascade process of the spanwise large-scale structures to the small-scale structures). The existence of small-scale roughness greatly enhances this transport process, whereas large-scale roughness weakens the energy output because of the reduced intensity of the large-scale structures in the outer region. At this vertical location, the roughness affects the pressure diffusion term similarly as it affects the interscale transport term (i.e. small-scale roughness enhances the transport of pressure diffusion to the large-scale structures), and the corresponding instantaneous pressure fluctuation increases dramatically in the outer region (figure 9c). As the vertical height continues to increase, the spanwise scale and vertical scale both begin to decrease. Energy is transferred to a higher vertical position through the spatial diffusion term $T_{t,11}^{y}$. All the energy flux field lines leave the attached-scale plane to develop upward. Small-scale roughness strengthens the energy transport of the turbulent spatial diffusion term to the channel centre (figure 14a). The turbulent spatial diffusion weakens when the roughness height increases to $k^+=60$. The ultimate field lines of the scale-energy flux reach the vertically distributed energy sink corresponding to the small dissipative scale. The dissipative effect in the outer region is weakened by the destruction of near-wall self-sustaining cycle in the presence of roughness elements, which causes the flux field lines to exhibit a larger spanwise scale distribution in the channel centre than in the smooth-wall turbulence. The spanwise scale for the smooth-wall case tends to zero at this vertical location. In addition, the energy transfer from the buffer region to the near-wall region through the viscous diffusion term is obviously weakened, especially for the case of large roughness.
4. Conclusions
In the present study, DNSs with a body-conforming grid were performed for turbulent channel flows over three-dimensional sinusoidal rough walls. By systematically varying the roughness Reynolds number $k^{+}$ or the ratio of the roughness height to the half-channel height $k / \delta$, we simulated two groups of cases and compared the results with those for smooth-wall turbulence, where the friction Reynolds numbers $Re_\tau$ were varied from 180 to 1080. A triple decomposition method was adopted to extract the mean, wave-induced and turbulent components of the flow field. First, the outer-layer similarity of the mean streamwise velocity and Reynolds stresses with the vertical height non-dimensionalized by inner and outer scales, respectively, was examined. Second, variations of the large-scale coherent structures in the outer region with the roughness height $k^+$ were studied using the one-dimensional pre-multiplied spanwise spectra of the turbulent streamwise velocity and the instantaneous flow fields. Finally, the turbulent energy transfer process in rough-wall turbulence was revealed by the spectral analysis of the transport equation of the two-point velocity correlation and scale-energy path display of the generalized Kolmogorov equation. The main conclusions and innovations are summarized as follows:
(i) The roughness Reynolds number $k^+$ strongly affects turbulence statistics. The shift of the mean streamwise velocity profile in the logarithmic region increases and the peak intensities of turbulent Reynolds stresses decrease with increasing $k^+$. The dispersive stresses are mainly distributed within the roughness sublayer and rapidly decay to zero above the crest of the roughness elements.
(ii) At an intermediate Reynolds number (${{\it Re}_{\tau }} \approx 1080$), the length scale and intensity of large-scale coherent structures increase for the small roughness ($k^{+}=10$), which leads to failure of the outer-layer similarity in rough-wall turbulence, and decrease for the large roughness ($k^{+}=60$), as compared with the smooth-wall case.
(iii) On the basis of the spectral analysis of the transport equation of the two-point velocity correlation, we attempted to explain the effect of the roughness with different sizes on the outer-layer large-scale coherent structures. The influence of the small and large roughness on the turbulent production terms is similar to that of spanwise energy spectra of the streamwise velocity turbulent fluctuation. The self-sustaining process of large-scale coherent structures in the outer region is maintained by turbulent production terms, which gain energy from the mean flow. The small roughness ($k^+=10$) strengthens this mechanism, reflected as the enhancement of the inter-scale turbulent transport, the spatial turbulent transport and the pressure diffusion, whereas the opposite influence is shown in the large roughness. The wave-induced production terms contribute to the large-scale structures in the inner region but do not influence the outer-layer large-scale structures.
(iv) By displaying the scale-energy transfer path of the generalized Kolmogorov equation, we found that the energy transfer process of the near-wall small scales to the large scales at a higher vertical position is enhanced in the presence of small roughness ($k^{+}=10$), which corresponds to the energy increase of the large-scale coherent structures in the outer region. A damage to the self-sustaining process of the near-wall region is greater for the large roughness ($k^{+}=60$), leading to a weakening of the inverse energy cascade process from the inner region to the outer region. As a result, the intensity and length scale of the large-scale coherent structures in the outer region are both reduced by the large roughness.
Funding
The authors acknowledge funding support from the National Natural Science Foundation of China under grant numbers 12272206 and 92252204, and from the National Research Foundation of Korea under grant number 2019M3C1B7025091.
Declaration of interests
The authors report no conflict of interest.
Appendix A. Two-point correlation transport equation
In the previous study, Wang et al. (Reference Wang, Zhang, Hao, Huang, Shen, Xu and Zhang2020) derived the two-point correlation transport equation in curvilinear coordinates of travelling wavy boundaries; that is, if we write the equation of velocity fluctuations $u_{i}^{\prime }$ at one point ($\xi _1,\xi _2,\xi _3,\tau$), multiply it by the velocity fluctuations $u_{rj}^{\prime }$ at another point ($\xi _1,\xi _2,\xi _3+r_{\xi _3},\tau$) and then add the $\xi _2$-average of this equation to its counterpart with the subscripts exchanged, then the transport equation of two-point correlation can be obtained. Different from their derivation process, we replace the classic Reynolds decomposition with the triple decomposition according to (3.2), i.e.
where the overbar denotes the ensemble average on a curved plane of the boundary-fitted grid and over time. Here, $\phi _{i}$ denotes transformation between the derivatives of numerical space and physical space. The viscous transport and dissipation terms only consider the principal parts here. Furthermore, the turbulent transport term $T_{t, i j}$ can be decomposed into two parts as follows:
For the streamwise velocity fluctuations and the Reynolds shear stress, the wave-induced production terms can be further expressed as
By performing the Fourier transform in the spanwise direction, (A1) becomes
where the spectral expansion of each term is expressed as
where $\hat {E}_{i j}$ is the spectral coefficient and $k_{\xi _{3}}$ is the corresponding spanwise wavenumber. Then the one-dimensional spanwise energy spectrum is defined as
Appendix B. The generalized Kolmogorov equation
In the present work, we write the anisotropic generalized Kolmogorov equations (Gatti et al. Reference Gatti, Chiarini, Cimarelli and Quadrio2020), for the triple decomposition and in curvilinear coordinates. The anisotropic generalized Kolmogorov equations are the exact budget equations for each component of the second-order structure function tensor $\langle \delta u_{i}^{\prime } \delta u_{j}^{\prime }\rangle$ where $\delta u_{i}^{\prime }$ is the difference of the $i$th fluctuating velocity component between two points identified by their midpoint $X_{\xi _i}$ and the separation distance $r_{\xi _i}$. The operator $\langle {\cdot } \rangle$ denotes ensemble averaging, as well as averaging along the homogeneous directions. In curvilinear coordinates, the expressions are as follows:
where the $\ast$ operator is the arithmetic mean of a given quantity between the two points. Here, ${A}_{ij, k}$ and $\bar {A}_{ij}$ denote the additional terms due to coordinate transformation. For the streamwise turbulent velocity fluctuations, the equation can be further expressed as