Hostname: page-component-586b7cd67f-gb8f7 Total loading time: 0 Render date: 2024-11-27T16:40:49.833Z Has data issue: false hasContentIssue false

The minimal flow unit and origin of two-dimensional elasto-inertial turbulence

Published online by Cambridge University Press:  20 November 2024

Hongna Zhang
Affiliation:
State Key Laboratory of Engine, Tianjin University, Tianjin 300350, PR China
Haotian Cheng
Affiliation:
State Key Laboratory of Engine, Tianjin University, Tianjin 300350, PR China
Suming Wang
Affiliation:
State Key Laboratory of Engine, Tianjin University, Tianjin 300350, PR China
Wenhua Zhang*
Affiliation:
State Key Laboratory of Engine, Tianjin University, Tianjin 300350, PR China
Xiaobin Li
Affiliation:
State Key Laboratory of Engine, Tianjin University, Tianjin 300350, PR China
Fengchen Li
Affiliation:
State Key Laboratory of Engine, Tianjin University, Tianjin 300350, PR China
*
Email address for correspondence: [email protected]

Abstract

The research on elasto-inertial turbulence (EIT), a new type of turbulent flow, has reached the stage of identifying the minimal flow unit (MFU). On this issue, direct numerical simulations of FENE-P fluid flow in two-dimensional channels with variable sizes are conducted in this study. We demonstrate with the increase of channel length that the simulated flow experiences several different flow patterns, and there exists an MFU for EIT to be self-sustained. At Weissenberg number ($Wi$) higher than the one required to excite EIT, when the channel length is relatively small, a steady arrowhead regime (SAR) flow structure and a laminar-like friction coefficient is achieved. However, as the channel length increases, the flow can fully develop into EIT characterized with high flow drag. Close to the size of the MFU, the simulated flow behaves intermittently between the SAR state with low drag and EIT state with high drag. The flow falling back to ‘laminar flow’ is caused by the insufficient channel size below the MFU. Furthermore, we give the relationship between the value of the MFU and the effective $Wi$, and explain its physical reasons. Moreover, the intermittent flow regime obtained based on the MFU gives us an opportunity to look into the origin and exciting process of EIT. Through capturing the onset process of EIT, we observed that EIT originates from the sheet-like extension structure located near the wall, which is maybe related to the wall mode rather than the centre mode. The fracture and regeneration of this sheet-like structure is the key mechanism for the self-sustaining of EIT.

Type
JFM Papers
Copyright
© The Author(s), 2024. Published by Cambridge University Press

1. Introduction

Viscoelastic fluids widely exist in nature, and their unique rheological properties give rise to different flow behaviours comparing with Newtonian fluids, such as the drag-reducing turbulence (DRT) (Toms Reference Toms1949; White & Mungal Reference White and Mungal2008; Li et al. Reference Li, Yu, Wei and Kawaguchi2012) at a moderate or high Reynolds number ($Re$), and elastic turbulence (ET) (Groisman & Steinberg Reference Groisman and Steinberg2000Reference Groisman and Steinberg2004; Steinberg Reference Steinberg2021) at an extremely low $Re$. The recent discovery of a new type of turbulent state (elasto-inertial turbulence, EIT) by Samanta et al. (Reference Samanta, Dubief, Holzner, Schafer, Morozov, Wagner and Hof2013) opened up new avenues for viscoelastic turbulence. Unlike Newtonian inertial turbulence (IT) and ET, EIT arises from the combined effects of nonlinear elasticity and flow inertia. Its distinctive characteristics are trains of spanwise cylindrical vortex structures of alternating sign around sheets of high polymer extension (Dubief, Terrapon & Julio Reference Dubief, Terrapon and Julio2013; Choueiri, Lopez & Hof Reference Choueiri, Lopez and Hof2018; Shekar et al. Reference Shekar, McMullen, Wang, McKeon and Graham2019). The understanding of EIT has provided valuable insights into the maximum drag reduction state of DRT as well as the early turbulence of viscoelastic fluids (Dubief, Terrapon & Hof Reference Dubief, Terrapon and Hof2023).

The origin and self-sustaining mechanisms of EIT are hot topics, with the investigations focusing on whether it originates from wall-mode (Tollmien–Schlichting (TS) mode) or centre-mode instability, as well as arising from a subcritical or supercritical transition (Sánchez et al. Reference Sánchez, Jovanović, Kumar, Morozov, Shankar, Subramanian and Wilson2022; Dubief et al. Reference Dubief, Terrapon and Hof2023). Here, the wall mode and centre mode are characterized as propagating at a phase speed close to the critical-layer velocity near the channel wall, and the base state maximum velocity at the channel centre, respectively. On the one hand, through linear stability analysis, Garg et al. (Reference Garg, Chaudhary, Khalid, Shankar and Subramanian2018) and Khalid et al. (Reference Khalid, Chaudhary, Garg, Shankar and Subramanian2021) discovered the linear instability of centre mode under high $Wi$ in pipe and channel flow, respectively. The existence of centre-mode instability can provide a dynamic origin of EIT Beneitez et al. (Reference Beneitez, Page, Dubief and Kerswell2024). Weakly nonlinear analysis by Wan, Sun & Zhang (Reference Wan, Sun and Zhang2021) indicated that the transition to EIT is subcritical at low polymer concentrations, and supercritical at high polymer concentrations. Numerical simulations revealed that the subcritical nonlinear evolution of the centre mode can induce saturated ‘arrowhead’ travelling waves (Page, Dubief & Kerswell Reference Page, Dubief and Kerswell2020), which exhibits the arrowhead structure (the landmark of centre mode) and can become a stable attractor for EIT dynamics at sufficiently large $Wi$. Four coexistent attractors – e.g. steady arrowhead regime (SAR) and chaotic arrowhead regime – were identified by Dubief et al. (Reference Dubief, Page, Kerswell, Terrapon and Steinberg2022) and Beneitez et al. (Reference Beneitez, Page, Dubief and Kerswell2024), supporting the idea of linear instability. In the experiments of viscoelastic pipe flow (Choueiri et al. Reference Choueiri, Lopez, Varshney, Sankar and Hof2021), similar arrowhead structures of centre mode were observed at low $Re$, suggesting the significance of centre-mode instability in the origin of EIT. On the other hand, some researchers argued that the mechanism of EIT induced by the wall-mode instability is closely related to the excitation of TS waves. The Graham group proposed the critical layer theory and the nonlinear routine to EIT induced by TS mode (wall mode) in plane Poiseuille flow for low $Wi$ (Shekar et al. Reference Shekar, McMullen, Wang, McKeon and Graham2019Reference Shekar, McMullen, McKeon and Graham2020Reference Shekar, McMullen, McKeon and Graham2021). They found two kinds of TS attractors linked to EIT: a viscoelastic nonlinear TS attractor (VNTSA) and a Newtonian TS attractor. At moderate $Re$, although similar to the stable Newtonian TS mode, a VNTSA can be connected to two-dimensional (2-D) EIT through an unstable solution branch (Shekar et al. Reference Shekar, McMullen, McKeon and Graham2020). At high $Re$, the unstable Newtonian TS attractor can evolve continuously into an EIT state as $Wi$ increases (Shekar et al. Reference Shekar, McMullen, McKeon and Graham2021). Therefore, they argued that the wall mode (or TS mode) and critical layer play a key role in the onset process of EIT. A similar viewpoint is also obtained by Beneitez et al. (Reference Beneitez, Page, Dubief and Kerswell2024), who pointed out that the chaotic dynamics of EIT is a wall-focused phenomenon.

So far, researches on the origin and mechanism of EIT have yielded many insightful findings, but the picture is still incomplete and numerous questions remain open. Direct numerical simulations (DNS) can shed crucial light on these questions. However, the numerical criterion that is well-documented for Newtonian IT has not yet been established for EIT. The well-known high Weissenberg number problem (HWNP) has long bottlenecks in the simulations of high-$Wi$ viscoelastic fluid flows, especially EIT and ET. Although great efforts have been made in dealing with the HWNP over the past two decades, it has not been completely solved (Alves, Oliveira & Pinho Reference Alves, Oliveira and Pinho2021). Many of the numerical studies on EIT adopt some artificial diffusion to alleviate the hyperbolicity of the constitutive model at high $Wi$, which is often considered as one of the main causes of the HWNP. The addition of an artificial diffusion term can stabilize the numerical simulations of high-$Wi$ viscoelastic fluid flows in a way, but at the cost of numerical accuracy. Moreover, recently it was demonstrated that the presence of non-zero diffusivity of the polymer stress can change the flow stability of Oldroyd-B and FENE-P fluid by inducing a new mechanism of linear instability, i.e. polymer diffusive instability (PDI) (Beneitez, Page & Kerswell Reference Beneitez, Page and Kerswell2023); this can also lead to a self-sustaining chaotic state, and the inertia can enhance its prevalence comparing with the cases in the inertialess limit (Couchman et al. Reference Couchman, Beneitez, Page and Kerswell2024). These important findings indicate that in numerical simulations, PDI could also be a possible trigger of ET and EIT for Oldroyd-B and FENE-P fluids, which, however, is non-physical. Therefore, avoiding the PDI by suitable numerical methods is also a necessity to establish the numerical criterion for EIT as well as ET.

In addition to the numerical methods, the size of the computational domain is also a key factor to excite and sustain turbulence, which also lacks of systematic investigation for EIT. The improper choice of computational domain sometimes leads to a different picture of dominant dynamics. For example, as reported in Dubief et al. (Reference Dubief, Page, Kerswell, Terrapon and Steinberg2022), the simulated flow states are related to the computational domain, and an increase in the streamwise length can change the SAR state to the EIT state under the same parameters. Zhu & Xi (Reference Zhu and Xi2021) obtained slightly higher friction factors after enlarging the computational domain, explained as spatial intermittency and correlation on longer length scales. In our previous studies on EIT of Oldroyd-B fluids (Zhang et al. Reference Zhang, Zhang, Wang, Li, Yu and Li2022), we found that a longer channel is required to excite EIT as $Wi$ increases. Therefore, a standard numerical criterion for DNS of EIT after solving the HWNP is a prior and plays a crucial role in drawing a complete picture of EIT dynamics.

To establish this criterion, it is worth emphasizing the importance of finding the minimal flow unit (MFU) that can ensure the occurrence and continuous self-sustenance of turbulence (Jiménez & Moin Reference Jiménez and Moin1991). In numerical simulations of turbulence, it is commonly required to ensure that the computational domain is sufficiently long to allow for adequate turbulence development, and that the streamwise correlation reaches zero within half of the domain length (Dubief et al. Reference Dubief, Terrapon and Hof2023). The statistical results based on the MFU agree with those obtained from significantly larger flow units. The use of the MFU provides reliable guidance for selecting the computational domain size in numerical simulations, ensuring that the results contain complete and accurate physical information while reducing the computational cost associated with large domains. It has played an important role in understanding the self-sustaining mechanisms of turbulent structures therein, and has remained widely employed in studies related to Newtonian wall-bounded turbulence (Yin, Huang & Xu Reference Yin, Huang and Xu2018). However, few studies are conducted on the MFU of viscoelastic turbulence, particularly EIT. Xi & Graham (Reference Xi and Graham2010) explored the MFU for DRT in three-dimensional channel flow. Later, Graham (Reference Graham2014) mentioned that the Newtonian fluid MFU cannot sustain turbulence at high $Wi$. Like Newtonian IT, the MFU is also a necessity to further promote the understanding of EIT, including the self-sustaining process of coherent structures, exact coherent structures, and so on.

Against the above backdrop, this paper aims to find the size of MFU that is able to sustain EIT, thereby discussing its origin. To this end, a comprehensive investigation on the computational domain effects on the flow characteristics in a wide range of parameters is required, based on reliable numerical methods. In our recent work, we identified the improper interpolation of the tensor field when solving the constitutive equations as the main cause of the HWNP (Zhang et al. Reference Zhang, Zhang, Wang, Li, Ma, Li and Li2023). Instead of component-based interpolation, we proposed a tensor-based interpolation method for the conformation tensor field, and have demonstrated the effectiveness of the tensor-based interpolation method in resolving the challenges of the HWNP with no need for an artificial diffusion term. This efficient and stable numerical method offers us the ability to access the numerical criterion of EIT today. Moreover, the 2-D nature of EIT demonstrated by Sid, Terrapon & Dubief (Reference Sid, Terrapon and Dubief2018) implies that the MFU of EIT in a channel is determined mainly by the streamwise length of the computational domain. Therefore, we conduct a series of numerical simulations on 2-D plane Poiseuille flow to find the MFU suitable for EIT, and thereby explore its origin. The remaining sections are organized as follows. Section 2 introduces the governing equations of viscoelastic fluid flow, numerical methods and conditions. Section 3 discusses the computational domain effects on flow characteristics and explores the origin of EIT based on its MFU. Section 4 gives the conclusions.

2. Numerical methodology

2.1. Governing equations

This study focuses on the 2-D plane Poiseuille flows of FENE-P fluid under a constant flow rate. Channel walls are assumed to be no-slip, and the periodic boundary condition is applied in the streamwise direction. The channel half-height $h$, the bulk mean velocity $u_b$, $h/u_b$, and $\rho u_b^2$ are chosen as the reference length, velocity, time and pressure, respectively. Here, $\rho$ is the fluid density, and $u_b = ({1}/{2h})\int _0^{2h} \bar {u}(y)\,{{\rm d}y}$, with $\bar {u}(y)$ the locally averaged velocity in the streamwise direction, and an overline indicates an ensemble-averaged variable. Then the dimensionless governing equations of FENE-P fluid flow in the form of the conformation tensor $\boldsymbol {c}$ are as follows:

(2.1)$$\begin{gather} \boldsymbol{\nabla}\boldsymbol{\cdot}\boldsymbol{u} = 0, \end{gather}$$
(2.2)$$\begin{gather}\frac{\partial \boldsymbol{u}}{{\partial t }} + \boldsymbol{u} \boldsymbol{\cdot} \boldsymbol{\nabla} \boldsymbol{u} =- {\boldsymbol{\nabla} p}+ \frac{\beta}{Re}\,{\nabla^2 \boldsymbol{u}} +\boldsymbol{\nabla} \boldsymbol{\cdot} \boldsymbol{\tau}_p , \end{gather}$$
(2.3)$$\begin{gather}\boldsymbol{\tau}_p =\frac{{1-\beta}}{{{Re\,Wi}}}\,[\, f(r)\,\boldsymbol{c} - \boldsymbol{I}], \end{gather}$$
(2.4)$$\begin{gather}\frac{\partial \boldsymbol{c}}{{\partial t }}+(\boldsymbol{u} \boldsymbol{\cdot}\boldsymbol{\nabla}) \boldsymbol{c}-\boldsymbol{c} \boldsymbol{\cdot} (\boldsymbol{\nabla} \boldsymbol{u})- (\boldsymbol{\nabla} \boldsymbol{u})^{\rm T} \boldsymbol{\cdot} \boldsymbol{c}=-\frac{f(r)\,\boldsymbol{c} - \boldsymbol{I}}{Wi}, \end{gather}$$

where $\boldsymbol {u}$ is the velocity vector, with $(u, v)$ denoting the streamwise ($x$) and normal ($\kern 1.5pt y$) direction velocity components. Here, $\boldsymbol {c}$ is the conformation tensor representing the average of the end-to-end vector of the polymer molecules taken over all the molecules, $p$ is the pressure field, $\boldsymbol {\tau }_p$ is the additional elastic stress tensor, $\beta = \eta _s/\eta _0$ with $\eta _0$ the solution dynamic viscosity and $\eta _s$ the solvent contribution to the viscosity, ${Re} = \rho u_bh/\eta _s$ is the bulk mean Reynolds number, and ${Wi} = \lambda u_b/h$ is the Weissenberg number based on the relaxation time $\lambda$ of the viscoelastic fluid. The Peterlin function $f(r)$ is defined as

(2.5)\begin{equation} f(r) = (L^2 - 2)/(L^2 - r^2), \end{equation}

where $r^2= {\rm tr}(\boldsymbol {c})$ is the trace of the conformation tensor $\boldsymbol {c}$, and $L$ is the maximum extension length of FENE-P fluid.

2.2. Numerical schemes

The governing equations are solved based on the finite difference method using a DNS code developed in our previous work. The numerical code adopts a time-splitting method to solve the governing equations under a constant flow rate, which is conducted by the following four steps: (1) update the configuration tensor and calculate the elastic stress field by (2.3); (2) perform partial time marching of the velocity field containing convection, diffusion and elastic stress terms in (2.2) to obtain the first intermediate velocity field; (3) derive the pressure Poisson equation by substituting the first intermediate velocity field variable into (2.1), and solve it to obtain the second intermediate velocity with pressure terms; (4) maintain a constant flow rate by imposing an appropriate average pressure gradient on the second intermediate velocity. The above process solves the pressure field implicitly, and the time marching of other terms is solved by a second-order Adams–Bashforth scheme. More numerical details and validation can be found in Zhang et al. (Reference Zhang, Zhang, Wang, Li, Yu and Li2022Reference Zhang, Zhang, Wang, Li, Ma, Li and Li2023).

It is worth highlighting our algorithm for handling the HWNP. The origin of the HWNP is closely related to the loss of the conformation tensor symmetric positive definite (SPD) property (Alves et al. Reference Alves, Oliveira and Pinho2021). Recently, we found that the improper interpolation methods of the conformation tensor are the main reason for losing its SPD property. Correspondingly, we proposed a tensor-based interpolation that is physically motivated (Zhang et al. Reference Zhang, Zhang, Wang, Li, Ma, Li and Li2023), instead of a component-based one to deal with the HWNP. The key to this method is to interpolate the eigenvalues and orientation of the conformation tensor $\boldsymbol {c}$ rather than its components. Comparing with traditional component-based methods, the accuracy of the conformation tensor invariants as well as its SPD property can be guaranteed at high $Wi$ without adding any artificial diffusion. The application procedures are as follows.

  1. (i) Decompose the conformation tensor field $\boldsymbol {c}$ as

    (2.6)$$\begin{gather} \boldsymbol{c} = \boldsymbol{R} \boldsymbol{\varLambda} \boldsymbol{R}, \end{gather}$$
    (2.7)$$\begin{gather}\boldsymbol{\varLambda} = \begin{bmatrix} \varLambda_1 & 0 & 0 \\ 0 & \varLambda_2 & 0 \\ 0 & 0 & \varLambda_3 \\ \end{bmatrix}, \end{gather}$$
    (2.8) $$\begin{gather}\boldsymbol{R} = \begin{bmatrix} \cos\theta \cos\varphi & \begin{array}{@{}c@{}}\sin\psi \sin\theta \cos\varphi\\ -\cos\psi \sin\varphi \end{array} &\begin{array}{@{}c@{}} \cos\psi \sin\theta \cos\varphi\\ +\sin\psi \sin\varphi \end{array}\\ \cos\theta \cos\varphi & \begin{array}{@{}c@{}}\sin\psi \sin\theta \sin\varphi\\ +\cos\psi \cos\varphi\end{array} & \begin{array}{@{}c@{}}\cos\psi \sin\theta \sin\varphi\\ -\sin\psi \cos\varphi \end{array}\\ -\sin\theta & \sin\psi \cos\theta & \cos\psi \cos\theta \end{bmatrix} , \end{gather}$$
    where $\psi$, $\theta$ and $\varphi$ are Euler angles relative to the Cartesian coordinate system.
  2. (ii) Given the known conformation tensor field $\boldsymbol {c}$, obtain the rotation matrix $\boldsymbol {R}$ and the diagonal matrix $\boldsymbol {\varLambda }$ by (2.5), and calculate the Eulerian angles and eigenvalues at the grid nodes.

  3. (iii) Obtain the Eulerian angles ($\psi _{i+1/2}$, $\theta _{i+1/2}$, $\varphi _{i+1/2}$) and eigenvalues ($\varLambda _{1, i+1/2}$, $\varLambda _{2,i+1/2}$, $\varLambda _{3,i+1/2}$) at the grid interface through various interpolation schemes.

  4. (iv) Calculate the diagonal matrix $\boldsymbol {\varLambda }_{i+1/2}$ and rotation matrix $\boldsymbol {R}_{i+1/2}$ at the grid interface by (2.7) and (2.8).

  5. (v) Reconstruct the conformation tensor $\boldsymbol {c}_{i+1/2}$ at the grid interface by (2.6).

Moreover, to further improve the numerical accuracy, the above method can be combined with the high-order total variation diminishing schemes, such as the weighted essentially non-oscillatory (WENO) scheme used in this study. Taking the second-order WENO scheme (Shu Reference Shu and Quarteroni1998) as an example, the flux $H_{i+1/2}$ on the interface $i+1/2$ can be calculated as

(2.9)\begin{equation} {H_{i+1/2} = u_{i+1/2}\,f_{i+1/2},\quad f_{i+1/2} = q_1 \times P_1 +q_2 \times P_2}, \end{equation}

where $f_{i+1/2}$ is the interpolated variable on the interface $(i+1/2)$ for $\varLambda _{i,i+1/2}$ and $\theta _{i,i+1/2}$, $P_1$ and $P_2$ are the results based on the second-order central and upwind interpolation templates, i.e. $P_1 = 1.5f_C-0.5f_U$ and $P_2=0.5f_C+0.5f_D$, and $q_1$ and $q_2$ are the smoothing factor of the two templates, i.e. $q_1 = 0.25/(10^{-6}+(f_U-f_C)^2)$ and $q_2 = 0.75/(10^{-6}+(f_U-f_C)^2)$. The subscripts $U$, $C$ and $D$ are the variables at the neighbour upstream, central and downstream nodes, respectively.

2.3. Numerical conditions

A series of simulations of the EIT state are conducted in a 2-D channel with varying dimensionless channel length $SX$, where $SX = 5n$, with $n = 0.5$, 1.0, 1.6, 2.0 and 4.0, respectively. In the existing studies (e.g. Dubief et al. Reference Dubief, Page, Kerswell, Terrapon and Steinberg2022; Beneitez et al. Reference Beneitez, Page, Dubief and Kerswell2024), a dimensionless channel length $SX$ of 2${\rm \pi}$ is frequently used, but there is no discussion on whether it can satisfy the MFU criterion. A wide range of $Wi$ is covered, from 10 to 800, while keeping ${Re} = 2000$, $\beta = 0.9$ and $L^2 = 10\,000$. Linear stability analysis for FENE-P channel flow at the same condition indicates that centre mode instability occurs when $Wi$ exceeds 150. However, despite the linear stability analysis predicting linear stability, DNS conducted by Shekar et al. (Reference Shekar, McMullen, McKeon and Graham2020Reference Shekar, McMullen, McKeon and Graham2021) demonstrate that EIT can indeed be excited at ${Wi} \geq 10$. Here, due to the use of different characteristic velocities to define $Wi$, the case ${Wi}=10$ in our study corresponds to $Wi =15$ in Shekar et al. (Reference Shekar, McMullen, McKeon and Graham2020).

During the simulation, the grid is set to be non-uniform in the normal direction, and uniform in the streamwise direction. The grid in the normal direction is much denser near the wall and distributed as

(2.10)\begin{equation} {y_j = \frac{1}{a}\tanh\left(\frac{1}{2}\,\delta_j \ln\left(\dfrac{1+a}{1-a}\right)\right)}, \end{equation}

where $y_j$ is the location of the $j$th grid node, and $\delta _j=-1+2j/{N_y}$, with $N_y$ the total grid number in the normal direction. After grid independence validation, the grid resolution is set to be $256n \times 304$, and the detailed validation is shown in the Appendix. The time step $\delta t$ is set to be $5\times 10^{-4}h/u_b$ or even smaller to achieve stable simulations. All the following simulations maintain for a sufficiently long duration to ensure statistical convergence and stability.

3. Results and analysis

3.1. Computational domain effects on flow states

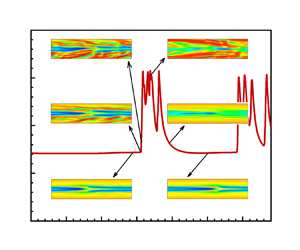
First, the effects of the computational domain on flow states are evaluated through the statistical property, specifically the flow drag. Figure 1 illustrates the temporally averaged and instantaneous drag coefficient ($C_f$) of viscoelastic flows over a wide range of $Wi$ obtained by different channel lengths. The two insets display the temporal evolution of the spatially averaged drag coefficient at two representative $Wi$ values, 40 and 100. Therein, the symbols a–e in inset 2 are the typical moments of different channel length simulation cases, where a and b represent the low-drag states obtained by $SX=5$ and 8, and c, d and e represent the high-drag states obtained by $SX=8$, 10 and 20, respectively. It is evident that the choice of computational domain plays a crucial role in determining the numerically achieved flow states, particularly for cases of large $Wi$ (e.g. above 40). When longer channels (e.g. $SX=10$ and 20) are employed, the temporal evolution of $C_f$ and flow structures demonstrate continuous occurrence of EIT, reaching a self-sustained state at $Wi > 10$. In these cases, the statistical drag coefficients converge as the channel length increases from $SX=10$ to $SX=20$. This indicates that a computation domain with $SX > 10$ is sufficient to capture the EIT state of FENE-P fluid for all presently considered $Wi$ at $Re = 2000$, $\beta =0.9$ and $L^2 = 10\,000$.

Figure 1. Temporally averaged and instantaneous $C_f$ of viscoelastic fluid flow at different $Wi$ obtained by different computational domains. The two insets are the instantaneous $C_f$ at two typical $Wi$, 40 and 100, respectively. The red open and closed circles represent the temporally averaged $C_f$ for different stable stages at $SX=8$ under the same $Wi$ value; LD indicates low-drag, and HD indicates high-drag. The dashed line corresponds to $C_f$ in the laminar regime of FENE-P fluid at different $Wi$.

For the shorter channel lengths, such as $SX=5$ and 8, the numerical results align with those of the longer channels at lower $Wi$ (e.g. ${Wi} < 40$ for $SX=5$, and $Wi < 60$ for $SX=8$). However, as $Wi$ is increased further, the flow alternates between a turbulent state with fluctuating high drag and a laminar-like state with stable low drag across a wide range of parameters. It is notable that the stable low-drag state (e.g. SAR state) discussed in this paper is not a turbulent state, different from active and hibernating turbulence proposed by Graham groups (Xi & Graham Reference Xi and Graham2011; Xi & Bai Reference Xi and Bai2016). Consequently, the statistical $C_f$ decreases significantly, approaching levels seen in laminar flow (e.g. ${Wi} > 60$). In figure 1, red open and closed circles distinguish the drag coefficients of these two states at the same $Wi$. Interestingly, the averaged $C_f$ in the high-drag state follows the scaling of EIT obtained from the longer channels, while the averaged $C_f$ in the low-drag state approaches laminar flow. Through evaluating the detailed flow field, it is discovered that the low-drag state in these cases corresponds to the SAR state identified by Dubief et al. (Reference Dubief, Page, Kerswell, Terrapon and Steinberg2022), as illustrated in figure 4(c) later. Moreover, in the cases with $SX=8$, both states exist intermittently for a certain duration (as shown in inset 2 of figure 1), while for $SX=5$, the high-drag state immediately transitions to the low-drag state with increase of $Wi$. This suggests that the high-drag state cannot sustain continuously in a short channel, and a long channel is required to capture the EIT state.

It is worth noting that the intermittent flow state observed in the case with $SX=8$ bears resemblance to the intermittent maintenance of laminar and turbulent states reported by Shekar et al. (Reference Shekar, McMullen, McKeon and Graham2021). The influence of the computational domain on flow states mimics the effects of $Wi$. Here, the channel length $SX=8$ is close to the critical length or the MFU to excite a continuous EIT state at ${Wi} > 60$. What is more, these findings obtained by changing the channel length at fixed $L^2$ also show great similarity to the effects of $L^2$ obtained by Dubief et al. (Reference Dubief, Page, Kerswell, Terrapon and Steinberg2022) at fixed channel length. Therein, they discovered that drag increase rises with increasing $Wi$ under small $L^2$ conditions, then reaches a maximum value and subsequently decreases to zero (laminar flow) under large $L^2$ conditions. According to the above results, the effect observed in Dubief et al. (Reference Dubief, Page, Kerswell, Terrapon and Steinberg2022) can be explained as: large $L^2$ implies the existence of longer characteristic structures in EIT, which cannot be captured adequately by the shorter channel length. In other words, the decrease of drag increase or $C_f$ with increasing $Wi$ is caused by the insufficient channel length used in numerical simulations.

In our previous work, it was demonstrated that the nonlinear extension of the FENE-P model can affect the nature of the maximum drag reduction state, and the effective elasticity of FENE-P fluid related to $L^2$ is proposed to describe the coupling effect of nonlinear extension and local shear instead of $Wi$ (Wang et al. Reference Wang, Zhang, Wang, Li, Zhang and Li2021). Similarly, $Wi_r$ is defined to characterize the average effective elastic effect on the flow as

(3.1)\begin{equation} {{Wi}_r = \int_0^2 \overline{{\frac{Wi}{f(r)}\, \frac{\partial u}{\partial y}}}\,{{\rm d}y}.} \end{equation}

An interesting observation is that if we take into account the nonlinear extension effect of the FENE-P model, then the scaling of $C_f$ with effective elasticity becomes simpler. Figure 2 shows the relations of ${Wi}_r$ with $Wi$ and $C_f$, respectively. As is shown, ${Wi}_r$ exhibits a behaviour similar to $C_f$ in figure 1, and a linear function between $C_f$ and ${Wi}_r$ can be observed as shown in figure 2(b): $C_f \propto Wi_r$. This indicates that ${Wi}_r$ is more suitable to describe the elastic effect in EIT, and the drag of EIT depends linearly on the effective elastic effect. Moreover, by evaluating this linear function, we can obtain an approximate scaling of $C_f$ as $C_f \approx 2.5(1-\beta )({Wi}_r-10)/{Re}+ 9/{Re} \approx 8.42 \times 10^{-5}\times {Wi}_r + 0.0022$. The first term is related with the drag induced by EIT, and the second term is the drag of Newtonian laminar flow. This linear function agrees very well with the numerical data in the currently investigated parameter range of $Wi$ ($10 \leq Wi \leq 200$, or $13 \lesssim Wi_r \lesssim 40$). It is certain that the scaling still needs further validation based on a large amount of numerical simulations under various conditions of varying ${Re}$ and $\beta$ in future work.

Figure 2. Relations of ${Wi}_r$ with (a) $Wi$ and (b) $C_f$.

3.2. The MFU of EIT

According to the obtained drag coefficients and flow fields, figure 3 presents a phase diagram summarizing various viscoelastic flow states obtained from different computational domain sizes in a wide range of $Wi$ (${Wi} > 10$). The flow states depicted in the diagram are stable ones that can be sustained for sufficient periods. In figure 3, we supplement several cases of $SX = 2.5$ and 2${\rm \pi}$ near the critical line to obtain the corresponding critical $SX$ that can ensure stable EIT. Moreover, to have an intuitive image, the typical structures of different flow states are presented by the snapshots of polymer extension in figure 4. As mentioned above, the cases at all $Wi$ considered in this paper are capable of reaching EIT if the channel is long enough. However, it is observed that with the increase of the channel length, the flow can experience several typical states, such as the SSW state with steady sheets near the wall, the SW-EIT state with EIT occurring near a single wall, the SAR state with steady arrowhead structure and EIT state. Except for EIT, these states may also be the solutions of governing equations or the attractors of FENE-P fluid channel flow, which are somehow unstable or appear only in a narrow parameter space.

Figure 3. Phase diagram of flow states at different $Wi$ obtained by different computational domains. Here, SSW means steady sheets near the wall; SW-EIT means EIT occurrence near a single wall; ‘$+$’ indicates the alternative occurrence of different states.

Figure 4. Features of different flow states: (a) SSW and (b) SW-EIT obtained at ${Wi}=30$, $SX= 2.5$; (c) SAR and (d) EIT obtained at ${Wi}=100$, $SX= 8$.

Moreover, the phase diagram illustrated figure 3 allows us to identify the MFU required to produce the EIT state for different $Wi$. It is evident from the diagram that the size of the MFU increases with $Wi$ and saturates when $Wi$ exceeds a critical value (e.g. 60). Given the case of $Wi$ above the critical value to excite EIT, if the computational domain is slightly shorter than the size of the MFU, then a switching phenomenon of EIT and SAR appears. Otherwise, EIT cannot be excited, and only SAR structures appear if the computational domain is too short. For example, when ${Wi}< 40$, a flow unit with size $SX> 5$ can achieve a self-sustained EIT state. However, for ${Wi} > 40$, a flow unit with $SX=5$ is no longer able to sustain the EIT state, and instead exhibits a coexistence of SAR and EIT, or even a pure SAR state. Further increasing $Wi$ above 60, a flow unit with $SX=8$ also loses its ability to sustain the EIT state, and shows a coexistence of SAR and EIT. Notably, the flow unit with $SX=10$ is sufficient to sustain EIT states for $Wi$ ranging from 10 to 200 or even larger $Wi$, indicating a saturation of the effective elastic effect of FENE-P fluid at high $Wi$. Collecting the critical $SX$ for different $Wi$, we give an approximate size of MFU required to sustain the EIT state in numerical simulations as $SX > f({Wi})$ for the parameters investigated in this study. This criterion can also be expressed as $SX >{(0.65\,{Wi}_r -10.66)}$ in terms of $Wi_r$. Therefore, an appropriate size of the flow unit satisfying this criterion is suggested for the numerical simulation of EIT.

The above results clearly demonstrate the existence of an MFU for EIT to be self-sustained. This naturally raises the following questions. Why is a long channel required to produce EIT? What determines the MFU of EIT in numerical simulations? Answering these questions can give more insights into the origin and self-sustaining mechanism of EIT. Through evaluating the flow fields, it is observed the evolution process of sheet-like structures of polymer extension plays a crucial role in the generation and self-sustaining of EIT (see supplementary movies available at https://doi.org/10.1017/jfm.2024.977), which is in line with the findings in Shekar et al. (Reference Shekar, McMullen, McKeon and Graham2021). Therefore, we postulate that proper channel length to capture the evolution process of these structures is essential to sustain the EIT state. To test this hypothesis, we focus on the numerical results of cases obtained from a sufficiently large computational domain, $SX=20$. Figure 5(a) illustrates the spectral characteristics of the conformation tensor component $c_{xx}$ at different $Wi$. A peak in the low wavenumber can be observed near the wall at various $Wi$, corresponding to the number of the sheet-like structures in the channel of $SX=20$. For example, when $Wi = 10$, the peak value $k_p = 7$ indicates that the characteristic length of the sheet-like extension structures or the spacing between two sheets is $SX/k_p \approx 3$. Additionally, figure 5(b) summarizes the relationship between the characteristic length of the sheets and $Wi$, which exhibits a consistent pattern with the critical MFU determined in figure 3. Based on these observations, we argue that the size of the MFU required for EIT is determined by the characteristic scale of the sheet-like structures.

Figure 5. (a) Spectra of the conformation tensor component $c_{xx}$ at $y\approx 0.25$ at $SX=20$ and different $Wi$, where the solid dots with different colours represent the peaks of the spectra. (b) Characteristic scales $L_s$ of the $c_{xx}$ and the critical computational domain at different $Wi$, where $L_s = 20/k_{p}$, and $k_{p}$ is the peak wavenumber obtained from $E_{c_{xx}}(k)$. The stars and triangles represent the same flow patterns mentioned in figure 3, and the error bars represent ${\pm }10\,\%$.

3.3. Dynamics of different flow states

Based on the above results, this subsection explores the dynamics of different flow states. Figure 6 draws the dynamical and structural evolution of typical flow cases. Here, $C_f$ and $\tau _{xx}$ characterize the energy dissipation and the energy stored in the polymers of channel flow, respectively. For the cases at $SX=20$, it can be seen from the phase diagram that there are elliptical envelopes during the dynamical evolution of EIT, and the principal axes of the elliptical envelopes almost overlap under these conditions, which implies that the selected physical quantity can well describe the dynamics of EIT. For the channels with $SX=8$, the envelope of dynamical evolution also has overlapping principal axes under low $Wi$ conditions (${Wi} < 40$). However, at high $Wi$, the flow shuttles back and forth between SAR and EIT. Starting from SAR, at first, $C_f$ shows only a small increase, while $\tau _{xx}$ is significantly enhanced; subsequently, $C_f$ shows a rapid increase and falls back to the EIT envelope line, while $\tau _{xx}$ is no longer significantly increased; finally, the flow falls back to SAR from the envelope line along the principal axis, and repeats the above process. Figure 6(b) focuses on the channel flows at ${Wi}=100$. As $SX$ increases, the flow undergoes the evolution process of pure SAR, intermittent flow regime between SAR and EIT, and fully developed EIT, respectively. The flow envelopes almost coincide under the conditions $SX=10$ and $SX=20$. This clearly demonstrates that the flow states obtained by insufficient channel length follow different dynamics from EIT.

Figure 6. Dynamical and structural evolution cycles of $C_f$ with $\tau _{xx}$ (a) for different $Wi$ at $SX = 8$ and $20$, (b) for different $SX$ at ${Wi} =100$ (the insets present the snapshots of streamwise extension fields $c_{xx}$ for different $SX$, corresponding to the moments a–e in inset 2 of figure 1).

The above phenomenon can also be confirmed from the perspective of the stress balance, budgets of turbulent kinetic energy and elastic energy. The stress balance equation is obtained by the ensemble averaging of the momentum transport equation (2.2) as

(3.2)\begin{equation} {\underbrace{-\overline{u^{\prime}\nu^{\prime}}}_{\overline{\tau_{R}}}+ \underbrace{\frac{1-\beta}{{Re\,Wi}}\,(f(r)\,\overline{c_{xy}}-1)}_{\overline{\tau_{E}}}+ \underbrace{\frac{\beta}{Re}\,\frac{{\rm d}\bar{u}}{{\rm d}y}}_{{\tau_{V}}}=- \underbrace{\frac{{\rm d} p}{{\rm d}\kern0.06em x}{\left(1-\frac {y}{h}\right)}}_{{\tau_{T}}},}\end{equation}

where $\overline {(\cdot )}$ represents the ensemble-averaged variable, $(\cdot )^{\prime }$ is the fluctuating variable, and $(\cdot )^{\prime } = (\cdot )-\overline {(\cdot )}$. Here, $\tau _R$, $\tau _E$, $\tau _V$ and $\tau _T$ are the instantaneous Reynolds stress, elastic stress, viscous shear stress and total stress locally averaged along the streamwise, respectively. Similarly, the elastic energy budget equation can be obtained based on the elastic energy transport equation as

(3.3)\begin{equation} {\int_0^2\underbrace{\overline{\tau_E}\,\frac{\partial\bar{u}}{\partial y}}_{\overline{P_E}}\,\mathrm{d}y- \int_0^2\underbrace{\frac{\overline{f(r)\,\tau_{ii}}}{2\,Wi}}_{\overline{\varepsilon_E}}\,\mathrm{d}y+ \int_0^2\underbrace{\overline{\tau_{ij}^{\prime}\,\frac{\partial u_i^{\prime}}{\partial x_j}}}_{\bar{R}}\,\mathrm{d}y=0,}\end{equation}

where $P_E$, $\varepsilon _E$ and $R$ are the instantaneous terms of the energy production by the elastic stress, the elastic dissipation, and energy exchange between elastic energy and turbulent kinetic energy locally averaged along the streamwise, respectively. Likewise, the budget of turbulent kinetic energy can be obtained as

(3.4)\begin{equation} {\int_0^2\underbrace{-\frac12\,\overline{u^{\prime}\nu^{\prime}}\, \frac{\partial\bar{u}}{\partial y}\,\mathrm{d}y}_{\overline{P_K}}- \int_0^2\underbrace{\frac\beta{Re}\,\overline{\frac{\partial u_i^{\prime}}{\partial x_j}\, \frac{\partial u_i^{\prime}}{\partial x_j}}\,\mathrm{d}y}_{\overline{\varepsilon_K}}- \int_0^2\overline{\underbrace{\tau_{ij}^{\prime}\, \frac{\partial u_i^{\prime}}{\partial x_j}}_{\bar{R}}}\,\mathrm{d}y=0,}\end{equation}

where $P_K$ and $\varepsilon _K$ are the terms of the energy production by the Reynolds stress and the turbulent dissipation locally averaged along the streamwise direction, respectively.

Figure 7 illustrates the averaged budgets of shear stress and turbulent kinetic energy based on the results obtained by different channel lengths. Here, for the intermittent flow regime, the time averaging is performed for the different stages separately. As is shown, different flow patterns present completely different dynamical behaviour. The stage of SAR induced by the centre mode exhibits significant characteristics around the channel centre. For instance, the elastic nonlinear shear stress is lifted up with the peak close to the channel centre (see figure 7a). Although additional nonlinear shear stress is formed relative to laminar flow, it cannot cause a significant increase in flow drag due to the low shear strain rate therein. Compared to negative $\overline {P_K}$, turbulent kinetic energy comes from energy conversion term $\bar {R}$, which is also tightly supported near the channel centre (see figure 7d). However, unlike that of the SAR stage, the stage of EIT exhibits significant near-wall characteristics. For example, the peak of elastic nonlinear shear stress locates much closer to the wall compared to the SAR state (see figure 7b), which can induce high flow drag weighted by high shear strain rate there. The formation of turbulent kinetic energy also relies mainly on energy conversion term $\bar {R}$, but the peak of $\bar {R}$ is very close to the wall. The above phenomena indicate that there exist completely different dynamic mechanisms for EIT from the flow pattern induced by the centre mode.

Figure 7. Statistical properties for different periods and channel lengths: (a,b) stress distributions in the normal direction based on inner scale; (c,d) turbulent kinetic energy budgets in the normal direction for different channels. Here, 8-SAR and 8-EIT correspond to the results obtained by $SX=8$ in the SAR and EIT stages, respectively.

3.4. Origin and self-sustaining process of EIT

The intermittent flow regime between the SAR and EIT states provides a fabulous opportunity for exploring the origin and self-sustaining mechanism of EIT. To this end, this subsection investigates the structural and dynamical evolution processes of intermittent flow regime obtained at ${Wi}= 100$ with $SX = 8$, and ${Wi} = 40$ with $SX = 5$, respectively. The structural evolution is characterized by the polymer extension structures, and the dynamical evolution process is also evaluated using the the instantaneous budgets of turbulent kinetic energy and elastic energy, as well as shear stress balance analysis, respectively. For the two cases at $Wi=100$ and 40, figures 8 and 9 show several typical moments of EIT from burst to disappearance. The detailed evolution can be found in the supplementary movies. As illustrated in figures 8 and 9 as well as the supplementary movies, the excitation process of EIT can be described as follows.

Figure 8. The structural and dynamical evolution processes of the intermittent flow regime at ${Wi}= 100$ and $SX = 8$.

Figure 9. The structural and dynamical evolution processes of the intermittent flow regime at $Wi= 40$ and $SX = 5$.

In the intermittent flow regime of $SX = 8$ and ${Wi} = 100$, starting from the flow with the SAR structure, several near-wall sheet-like streamwise extension structures first appear at $y \approx 0.5$ in the flow (see state 1). These structures gradually grow and extend towards the channel centre (see states 1 and 2). Then they begin to split and modulate the SAR structure (see states 3 and 4), until the SAR structure integrates into the sheet-like extension structures. Subsequently, frequent splitting leads to a rapid increase in $C_f$ as shown in figure 6(a), then the flow develops into the EIT state without the SAR structure (see state 5). The detailed splitting process can be clearly identified in the supplementary movie of Case B from 21 s to 24 s. Due to the above demonstrated computational domain effects on flow states, EIT could not be maintained continuously for a long time as the near-wall extension structures gradually decline (see state 6). Finally, the flow returns to the SAR regime dominated by the centre mode (see state 7). After a long duration of the SAR state, the intervention of wall mode triggers the above process again.

Regarding the instantaneous dynamic evolution process, during the development process from pure SAR state to fully developed EIT state in figure 8, $\tau _{E}$ is significantly higher than $\tau _{R}$, which is responsible for absorbing energy from the average motion and converting it into elastic energy, manifested as a significant elastic energy generation term $P_{E}$. However, the turbulent energy generation $P_{K}$ is weaker, and even has a negative distribution in some regions. Turbulent velocity fluctuations come mainly from energy conversion $R$. The above phenomena indicate that elastic nonlinearity plays a dominant role in the dynamics of SAR and EIT, responsible for their induction and maintenance. Therefore, the origin and self-sustaining mechanism of EIT can be further confirmed by focusing on the elastic nonlinear behaviour in the flow. First, in the pure SAR state (state 7), the dynamic mechanism exhibits centralized characteristics in spatial distribution, such as the peak values of $\tau _{E}$ and $P_{E}$ located at $y \approx 0.75$, and they are approximately linearly distributed at $y<0.6$. Therefore, we believe that SAR is induced and maintained by the centre-mode dynamics. At state 1, with the burst of sheet-like extension structures, near-wall, wall-mode dynamics get involved in the flow, accompanied by local uplift of $\tau _{E}$ and $P_{E}$ at approximately $y = 0.5$. Subsequently, the wall-mode dynamics gradually increases, and the modulated centre-mode dynamics becomes difficult to detect at state 2. In states 3 and 4, the wall-mode dynamics gradually shifts towards the channel wall with high shear strain rates, causing a rapid increase in the flow drag. At state 5 with fully developed EIT, the wall-mode dynamics relatively decreases, and the peak values of $\tau _{E}$ and $P_{E}$ are located at $y \approx 0.2$. It is interesting that at the moment when EIT decays to state 6, $\tau _{E}$ and $P_{E}$ are extremely weak, and energy conversion almost disappears with the decay of EIT at state 6, which cannot provide energy for the maintenance of turbulent fluctuations, indicating the disappearance of elastic nonlinear dynamics. The above phenomena fully demonstrate that EIT originates not from the SAR structure induced by centre-mode dynamics, but rather from the sheet-like extension structures triggered by a wall mode.

Moreover, in the intermittent flow regime of $SX = 5$ and ${Wi} = 40$, as shown in figure 9, it is observed that even starting from the laminar-like flow without SAR structure, the appearance and evolution of near-wall sheet-like structures still closely mirror the process of the case at $SX = 8$, ${Wi} = 100$ in figure 8. They trigger the flow to be unstable and EIT state finally (see state 3). This detailed process can be found in the supplementary movie of Case A from 18 s to 28 s. Similar processes can also be confirmed through the evolution of instantaneous dynamics in figure 9 from state 1 to state 4. Here, the non-existence of peaks near the centreline further corroborates the absence of centre mode.

Therefore, the above results indicate that in the current parameter space, the EIT originates from the near-wall sheet-like structures induced by some wall modes rather than the centre mode, no matter whether there exists centre mode instability or not. From the perspective of dominant structure regeneration, the self-sustaining process of EIT can be described as: small disturbances near the wall induce high extension sheet-like structures, which gradually grow and split under the elastic nonlinearity as well as the fluid inertia, and regenerate new sheet-like structures. The above process continues to occur, maintaining the turbulent state of the flow. Therefore, different from the process of large eddies generating small eddies, and small eddies generating mini eddies in IT, we argue that there exists a different type of structural similarity in EIT: large extension sheets generate small extension sheets, and small extension sheets continues to regenerate as they grow.

4. Concluding remarks

In summary, a series of DNS of 2-D channel FENE-P fluid flow is performed to obtain the MFU of EIT in this paper. Based on the numerical results, the origin and self-sustaining process of EIT are then investigated, and the following major conclusions can be drawn.

(1) The size of the computational domain can significantly affect the numerically obtained flow pattern. The improper choice of domain size will lead to different or inaccurate flow dynamics. If the channel length is long enough, then the flow will sustain the EIT regime with the increase of $Wi$; otherwise, the flow will gradually fall back from the EIT state to the SAR state due to the insufficient channel length. This implies the existence of an MFU to sustain the EIT state. Moreover, it is found that the MFU is essentially determined by the characteristic scale of polymer extension structures whose evolution is crucial to the sustenance of EIT.

(2) Through investigating the dynamics of different flow states, it is found that the flow states obtained by insufficient channel length follow different dynamics from EIT. The SAR state exhibits dominant dynamics near the channel centre. Unlike the SAR state, EIT shows significant near-wall features, with the peak of elastic nonlinear shear stress and the energy exchange between elastic energy and turbulent kinetic energy located near the wall.

(3) The intermittent flow regime obtained at the critical channel length gives an in-depth insight on the origin and sustaining process of EIT. It indicates that in the absence of SAR structures, the sheet-like extension structures near the wall can be induced and gradually evolve into fully developed EIT. This means that EIT originates not from the centre mode, but from some wall modes, which induces the sheet-like extension structures near the wall. In detail, the sheet-like extension structures induced by small disturbances gradually grow and fracture, while the extension structures formed by fractures continue to grow and fracture. Once triggered, EIT is self-sustained by the regeneration of the extension structures.

So far, the above results are obtained under fixed inertial effect, and comprehensive investigations are of course still necessary to draw an exhaustive picture of an MFU for EIT. Moreover, with the MFU, now we can reach the level of identification of various exact coherent structures, the geometry of EIT, and detailed dynamical process of EIT in future work.

Supplementary movies

Supplementary movies are available at https://doi.org/10.1017/jfm.2024.977.

Funding

This research was funded by the National Natural Science Foundation of China (NSFC 51976238, 52006249, 12202308, 12472255).

Declaration of interests

The authors report no conflict of interest.

Appendix

Before a large amount of numerical simulation, grid independence validation was conducted at two representative $Wi$ values (i.e. ${Wi} = 60$ and $100$) and different channel lengths. Figures 10 and 11 illustrate some important statistics and structural properties obtained under different grid sets at ${Wi} = 60$, $SX = 10$. The insets illustrate the relative differences $\delta$ of the results at the $512 \times 304$ grid, comparing with those at higher-resolution cases ($768 \times 304$ and $512 \times 384$), respectively. Here, the relative differences at different grid resolutions are defined as $\delta = (\theta _i-\theta _{512 \times 304})/\theta _{512 \times 304,p}$, where $\theta _i$ represents the results at higher resolution, $\theta _{512 \times 304}$ represents the results at the $512 \times 304$ grid, and $\theta _{512 \times 304,p}$ represents the peak value of the corresponding data. It can be found that the variation of the streamwise grid number from $N_x = 256$ to $N_x = 768$ has gradually decreasing effects on the statistics and the structural properties, and the results converge at $N_x = 512$. Fixing $N_x = 512$, with the increase of grid resolution in the normal direction from $N_y = 152$ to $N_y = 384$, the statistics of EIT increase slightly and almost converge at $N_y = 304$. With the $512 \times 304$ grid, the numerical simulations can accurately predict no matter the tendency but also the peaks of different parameters. As illustrated by the insets of figure 10, the relative differences of different parameters are mostly less than 1 %, and the maximum ones are within 5 %, comparing with those at the two highest resolution cases. Furthermore, figure 12 shows the energy spectrum at different locations for the case with resolution $512 \times 304$ and ${Wi} = 60$, which proves that there is no energy accumulation at a higher wavenumber region. Therefore, the grid resolution $512 \times 304$ is suitable in the current study.

Figure 10. Statistics obtained by different grid resolutions for the case ${Re} = 2000$, $\beta = 0.9$, $L^2 = 10\,000$, ${Wi} = 60$: (a) the ensemble-averaged drag coefficient $C_f$; (b) the profile of the mean streamwise velocity $\bar {u}$; (c) the profile of $\overline {C_{xy}}$; (d) the profile of $\overline {\text {tr}(\boldsymbol {c})}$. Here, $C_f = 2\overline {\tau _w}/\rho u^2_b$ with $\overline {\tau _w}$ is the temporally averaged wall shear stress. The insets illustrate the relative differences $\delta$ of the results at the $512 \times 304$ grid comparing with those of higher resolution cases ($768 \times 304$ and $512 \times 384$, respectively).

Figure 11. Instantaneous snapshots of polymer extension obtained by different grid resolutions: (a) $256\times 152$, (b) $512\times 152$, (c) $512\times 304$, (d) $768\times 304$, (e) $768\times 384$.

Figure 12. Energy spectrum $E(k)$ at different locations for ${Re} = 2000$, $\beta = 0.9$, $L^2 = 10\,000$ and ${Wi} = 60$ with the $512 \times 304$ grid.

Moreover, figure 13 shows the grid effects on the obtained flow pattern under different channel lengths at a relatively high $Wi$ (${Wi} = 100$). As is shown, the improper choice of grid resolution can produce different flow states. For instance, at ${Wi} = 100$, $SX = 5$, the flow state obtained by the $128\times 152$ grid is an intermittent chaotic state with higher drag, but it converges to a steady state with an arrowhead structure and much lower drag when refining the grid to be $224\times 272$, $256\times 304$ and further finer grids. Here, it seems to be counter-intuitive that a more chaotic state is obtained at a coarser grid, which may be related to the PDI. Insufficient grid resolution, which brings in an additional numerical artificial diffusion, can lead to new type of non-physical flow instability. The increase of grid resolution can alleviate this non-physical flow instability. Finally, to get converged results, the grid resolution is set to be $256n\times 304$ during all the simulations.

Figure 13. Comparison of instantaneous $C_f$ for cases with different lengths and grid resolutions for ${Re} = 2000$, $\beta = 0.9$, $L^2 = 10\,000$, ${Wi} = 100$.

References

Alves, M.A., Oliveira, P.J. & Pinho, F.T. 2021 Numerical methods for viscoelastic fluid flows. Annu. Rev. Fluid Mech. 53, 509541.CrossRefGoogle Scholar
Beneitez, M., Page, J., Dubief, Y. & Kerswell, R.R. 2024 Multistability of elasto-inertial two-dimensional channel flow. J. Fluid Mech. 981, A30.CrossRefGoogle Scholar
Beneitez, M., Page, J. & Kerswell, R.R. 2023 Polymer diffusive instability leading to elastic turbulence in plane Couette flow. Phys. Rev. Fluids 8, L101901.CrossRefGoogle Scholar
Choueiri, G.H., Lopez, J.M. & Hof, B. 2018 Exceeding the asymptotic limit of polymer drag reduction. Phys. Rev. Lett. 120, 124501.CrossRefGoogle ScholarPubMed
Choueiri, G.H., Lopez, J.M., Varshney, A., Sankar, S. & Hof, B. 2021 Experimental observation of the origin and structure of elastoinertial turbulence. Proc. Natl Acad. Sci. USA 118 (45), e2102350118.CrossRefGoogle ScholarPubMed
Couchman, M.M.P., Beneitez, M., Page, J. & Kerswell, R.R. 2024 Inertial enhancement of the polymer diffusive instability. J. Fluid Mech. 981, A2.CrossRefGoogle Scholar
Dubief, Y., Page, J., Kerswell, R.R., Terrapon, V.E. & Steinberg, V. 2022 First coherent structure in elasto-inertial turbulence. Phys. Rev. Fluids 7, 073301.CrossRefGoogle Scholar
Dubief, Y., Terrapon, V.E. & Hof, B. 2023 Elasto-inertial turbulence. Annu. Rev. Fluid Mech. 55, 675705.CrossRefGoogle Scholar
Dubief, Y., Terrapon, V.E. & Julio, S. 2013 On the mechanism of elasto-inertial turbulence. Phys. Fluids 25, 110817.CrossRefGoogle ScholarPubMed
Garg, P., Chaudhary, I., Khalid, M., Shankar, V. & Subramanian, G. 2018 Viscoelastic pipe flow is linearly unstable. Phys. Rev. Lett. 121, 024502.CrossRefGoogle ScholarPubMed
Graham, M.D. 2014 Drag reduction and the dynamics of turbulence in simple and complex fluids. Phys. Fluids 26 (10), 101301.CrossRefGoogle Scholar
Groisman, A. & Steinberg, V. 2000 Elastic turbulence in a polymer solution flow. Nature 405 (6782), 5355.CrossRefGoogle Scholar
Groisman, A. & Steinberg, V. 2004 Elastic turbulence in curvilinear flows of polymer solutions. New J. Phys. 6 (1), 29.CrossRefGoogle Scholar
Jiménez, J. & Moin, P. 1991 The minimal flow unit in near-wall turbulence. J. Fluid Mech. 225, 213240.CrossRefGoogle Scholar
Khalid, M., Chaudhary, I., Garg, P., Shankar, V. & Subramanian, G. 2021 The centre-mode instability of viscoelastic plane Poiseuille flow. J. Fluid Mech. 915, A43.CrossRefGoogle Scholar
Li, F.C., Yu, B., Wei, J.J. & Kawaguchi, Y. 2012 Turbulent Drag Reduction by Surfactant Additives. John Wiley & Sons.Google Scholar
Page, J., Dubief, Y. & Kerswell, R.R. 2020 Exact travelling wave solutions in viscoelastic channel flow. Phys. Rev. Lett. 125, 154501.CrossRefGoogle ScholarPubMed
Samanta, D., Dubief, Y., Holzner, M., Schafer, C., Morozov, A.N., Wagner, C. & Hof, B. 2013 Elasto-inertial turbulence. Proc. Natl Acad. Sci. USA 110, 10557.CrossRefGoogle ScholarPubMed
Sánchez, H.A.C., Jovanović, M.R., Kumar, S., Morozov, A., Shankar, V., Subramanian, G. & Wilson, H.J. 2022 Understanding viscoelastic flow instabilities: Oldroyd-B and beyond. J. Non-Newtonian Fluid Mech. 302, 104742.CrossRefGoogle Scholar
Shekar, A., McMullen, R., McKeon, B. & Graham, M. 2020 Self-sustained elastoinertial Tollmien–Schlichting waves. J. Fluid Mech. 897, A3.CrossRefGoogle Scholar
Shekar, A., McMullen, R.M., McKeon, B.J. & Graham, M.D. 2021 Tollmien–Schlichting route to elastoinertial turbulence in channel flow. Rev. Fluids 6, 093301.CrossRefGoogle Scholar
Shekar, A., McMullen, R.M., Wang, S.N., McKeon, B.J. & Graham, M.D. 2019 Critical-layer structures and mechanisms in elastoinertial turbulence. Phys. Rev. Lett. 122, 124503.CrossRefGoogle ScholarPubMed
Shu, C. 1998 Essentially non-oscillatory and weighted essentially non-oscillatory schemes for hyperbolic conservation laws. In Advanced Numerical Approximation of Nonlinear Hyperbolic Equations (ed. Quarteroni, A.), pp. 325432. Springer.CrossRefGoogle Scholar
Sid, S., Terrapon, V.E. & Dubief, Y. 2018 Two-dimensional dynamics of elasto-inertial turbulence and its role in polymer drag reduction. Phys. Rev. Fluids 3, 011301.CrossRefGoogle Scholar
Steinberg, V. 2021 Elastic turbulence: an experimental view on inertialess random flow. Annu. Rev. Fluid Mech. 53, 2758.CrossRefGoogle Scholar
Toms, B.A. 1949 Some observations on the flow of linear polymer solutions through straight tubes at large Reynolds numbers. In Proc. 1st International Congress on Rheology, vol. 2, pp. 135–141. North-Holland.Google Scholar
Wan, D.D., Sun, G.R. & Zhang, M.Q. 2021 Subcritical and supercritical bifurcations in axisymmetric viscoelastic pipe flows. J. Fluid Mech. 929, A16.CrossRefGoogle Scholar
Wang, S.M., Zhang, W.H., Wang, X.Y., Li, X.B., Zhang, H.N. & Li, F.C. 2021 Maximum drag reduction state of viscoelastic turbulent channel flow: marginal inertial turbulence or elasto-inertial turbulence. J. Fluid Mech 960, A12.CrossRefGoogle Scholar
White, C.M. & Mungal, M.G. 2008 Mechanics and prediction of turbulent drag reduction with polymer additives. Annu. Rev. Fluid Mech. 40, 235256.CrossRefGoogle Scholar
Xi, L. & Bai, X. 2016 Marginal turbulent state of viscoelastic fluids: a polymer drag reduction perspective. Phys. Rev. E 93, 043118.CrossRefGoogle ScholarPubMed
Xi, L. & Graham, M.D. 2010 Turbulent drag reduction and multistage transitions in viscoelastic minimal flow units. J. Fluid Mech. 647, 421452.CrossRefGoogle Scholar
Xi, L. & Graham, M.D. 2011 Active and hibernating turbulence in minimal channel flow of Newtonian and polymeric fluids. Phys. Rev. Lett. 104, 218301.Google Scholar
Yin, G., Huang, W.X. & Xu, C.X. 2018 Prediction of near-wall turbulence using minimal flow unit. J. Fluid Mech. 841, 654673.CrossRefGoogle Scholar
Zhang, H.N., Zhang, W.H., Wang, X.Y., Li, Y.S., Ma, Y., Li, X.B. & Li, F.C. 2023 On the role of tensor interpolation in solving high-Wi viscoelastic fluid flow. Phys. Fluids 35, 031708.CrossRefGoogle Scholar
Zhang, W.H., Zhang, H.N., Wang, Z.M., Li, Y.K., Yu, B. & Li, F.C. 2022 Repicturing viscoelastic drag-reducing turbulence by introducing dynamics of elasto-inertial turbulence. J. Fluid Mech. 940, A31.CrossRefGoogle Scholar
Zhu, L. & Xi, L. 2021 Nonasymptotic elastoinertial turbulence for asymptotic drag reduction. Phys. Rev. Fluids 6, 014601.CrossRefGoogle Scholar
Figure 0

Figure 1. Temporally averaged and instantaneous $C_f$ of viscoelastic fluid flow at different $Wi$ obtained by different computational domains. The two insets are the instantaneous $C_f$ at two typical $Wi$, 40 and 100, respectively. The red open and closed circles represent the temporally averaged $C_f$ for different stable stages at $SX=8$ under the same $Wi$ value; LD indicates low-drag, and HD indicates high-drag. The dashed line corresponds to $C_f$ in the laminar regime of FENE-P fluid at different $Wi$.

Figure 1

Figure 2. Relations of ${Wi}_r$ with (a) $Wi$ and (b) $C_f$.

Figure 2

Figure 3. Phase diagram of flow states at different $Wi$ obtained by different computational domains. Here, SSW means steady sheets near the wall; SW-EIT means EIT occurrence near a single wall; ‘$+$’ indicates the alternative occurrence of different states.

Figure 3

Figure 4. Features of different flow states: (a) SSW and (b) SW-EIT obtained at ${Wi}=30$, $SX= 2.5$; (c) SAR and (d) EIT obtained at ${Wi}=100$, $SX= 8$.

Figure 4

Figure 5. (a) Spectra of the conformation tensor component $c_{xx}$ at $y\approx 0.25$ at $SX=20$ and different $Wi$, where the solid dots with different colours represent the peaks of the spectra. (b) Characteristic scales $L_s$ of the $c_{xx}$ and the critical computational domain at different $Wi$, where $L_s = 20/k_{p}$, and $k_{p}$ is the peak wavenumber obtained from $E_{c_{xx}}(k)$. The stars and triangles represent the same flow patterns mentioned in figure 3, and the error bars represent ${\pm }10\,\%$.

Figure 5

Figure 6. Dynamical and structural evolution cycles of $C_f$ with $\tau _{xx}$ (a) for different $Wi$ at $SX = 8$ and $20$, (b) for different $SX$ at ${Wi} =100$ (the insets present the snapshots of streamwise extension fields $c_{xx}$ for different $SX$, corresponding to the moments a–e in inset 2 of figure 1).

Figure 6

Figure 7. Statistical properties for different periods and channel lengths: (a,b) stress distributions in the normal direction based on inner scale; (c,d) turbulent kinetic energy budgets in the normal direction for different channels. Here, 8-SAR and 8-EIT correspond to the results obtained by $SX=8$ in the SAR and EIT stages, respectively.

Figure 7

Figure 8. The structural and dynamical evolution processes of the intermittent flow regime at ${Wi}= 100$ and $SX = 8$.

Figure 8

Figure 9. The structural and dynamical evolution processes of the intermittent flow regime at $Wi= 40$ and $SX = 5$.

Figure 9

Figure 10. Statistics obtained by different grid resolutions for the case ${Re} = 2000$, $\beta = 0.9$, $L^2 = 10\,000$, ${Wi} = 60$: (a) the ensemble-averaged drag coefficient $C_f$; (b) the profile of the mean streamwise velocity $\bar {u}$; (c) the profile of $\overline {C_{xy}}$; (d) the profile of $\overline {\text {tr}(\boldsymbol {c})}$. Here, $C_f = 2\overline {\tau _w}/\rho u^2_b$ with $\overline {\tau _w}$ is the temporally averaged wall shear stress. The insets illustrate the relative differences $\delta$ of the results at the $512 \times 304$ grid comparing with those of higher resolution cases ($768 \times 304$ and $512 \times 384$, respectively).

Figure 10

Figure 11. Instantaneous snapshots of polymer extension obtained by different grid resolutions: (a) $256\times 152$, (b) $512\times 152$, (c) $512\times 304$, (d) $768\times 304$, (e) $768\times 384$.

Figure 11

Figure 12. Energy spectrum $E(k)$ at different locations for ${Re} = 2000$, $\beta = 0.9$, $L^2 = 10\,000$ and ${Wi} = 60$ with the $512 \times 304$ grid.

Figure 12

Figure 13. Comparison of instantaneous $C_f$ for cases with different lengths and grid resolutions for ${Re} = 2000$, $\beta = 0.9$, $L^2 = 10\,000$, ${Wi} = 100$.

Supplementary material: File

Zhang et al. supplementary movie 1

Statistical and structural evolutions for Case A: SX = 5, Wi = 40, Re = 2000, L2 = 10000 and β = 0.9.
Download Zhang et al. supplementary movie 1(File)
File 1.9 MB
Supplementary material: File

Zhang et al. supplementary movie 2

Statistical and structural evolutions for Case B: SX = 8, Wi = 100, Re = 2000, L2 = 10000 and β = 0.9.
Download Zhang et al. supplementary movie 2(File)
File 2.2 MB